Title:
Universal Credit
Lead department or agency:
Department for Work and PensionsOther departments or agencies:
Jobcentre PlusLocal Authorities
Her Majesty’s Revenue and Customs
Impact Assessment (IA)
IA No:
Date: 16 February 2011 Stage : Final Proposal
Source of intervention:Domestic Type of measure: Primary Legislation Contact for enquiries:
Summary: Intervention and Options
What is the problem which is under consideration? Why is government intervention necessary?
There are two fundamental problems with the current welfare system: poor work incentives and complexity. As a result the current system hinders rather than helps millions of individuals who are in poverty and facing welfare dependency. For people often reliant on benefits, the incentives to move into work or to increase earnings once in work can be very low. In nearly 1.1 million workless households, a person would currently lose more than 70 per cent of their earnings if they move into work of 10 hours a week. The incentives to increase hours once in work are also very weak. At present around 0.7m households in low paid work would lose more than 80 per cent of any increase in their earnings because of higher tax or withdrawn benefits. The current system of benefits provides targeted support to meet specific needs, but the net effect is a complex array of benefits which interact in complicated ways, creating perverse incentives and penalties, confusion and administrative cost. This has the perverse effect of preventing many in our society from seeing work as the best route out of poverty. It also increases the risk of error and the opportunities for fraud. Welfare dependency has become a significant problem in Britain with a huge social and economic cost.
What are the policy objectives and intended effects?
The policy will restructure the benefit system, to create one single income-replacement benefit for working age adults which unifies the current system of means-tested out of work benefits, Tax Credits and support for housing. It will improve work incentives by allowing individuals to keep more of their income as they move into work, and by introducing a smoother and more transparent reduction of benefits when they increase their earnings. It will reduce the number of benefits and the number of agencies that people have to interact with and smooth the transition into work. This will make it easier for customers to understand their entitlements and easier to administer the system, thus leaving less scope for fraud and error. The effects of the policy will be to reduce the number of workless households by always ensuring that work pays.
What policy options have been considered? Please justify preferred option (further details in Evidence Base) We set out five options in the consultation document 21st Century Welfare;
1) Universal Credit, 2) Single Unified Taper, 3) Mirrlees Model,
4) Single Working Age Benefit,
5) Single benefit/negative income tax model.
When will the policy be reviewed to establish its impact and the extent to which the policy objectives have been achieved?
From 2014-15
Are there arrangements in place that will allow a systematic collection of monitoring information for future policy review?
Summary: Analysis and Evidence
Net Benefit (Present Value (PV)) (£m) Price Base
Year
PV Base Year
Time Period
Years Low: High: Best Estimate:
COSTS (£m)
Total Transition(Constant Price) Years
Average Annual
(excl. Transition) (Constant Price)
Total Cost
(Present Value)
Low High
Best Estimate
Description and scale of key monetised costs by ‘main affected groups’
1) Universal Credit is expected to be introduced in October 2013, and individuals will be migrated to Universal Credit over the subsequent 4 years. Costs and benefits over this transition period will depend upon the precise nature of the migration strategy. This Impact Assessment provides an assessment of the costs and benefits once Universal Credit has been fully implemented and transitional protection has been exhausted.
2) Overall, it is estimated that benefit expenditure will be around £2.6bn higher once Universal Credit is fully implemented. This will be a cost to the Exchequer and the taxpayer. This estimate includes an increase of £2bn due to changes in entitlement rules and around £2.6bn accounting for increased take-up. Offsetting this it is estimated that there will be savings of around £2bn due to reduced fraud, error and overpayments together with changes to the earnings disregards that currently exist in tax credits.
Other key non-monetised costs by ‘main affected groups’
1) There will be resource costs for implementation of Universal Credit and transitioning the legacy caseload to the new scheme. In the longer run it is anticipated that the new system will reduce administration costs.
2) There will be fiscal costs associated with transitional protection against cash losses at the point of transition to Universal Credit. This will generate equivalent economic benefits for the households who receive the cash protection.
BENEFITS (£m)
Total Transition(Constant Price) Years
Average Annual
(excl. Transition) (Constant Price)
Total Benefit
(Present Value)
Low High
Best Estimate
Description and scale of key monetised benefits by ‘main affected groups’
1) Once fully implemented it is expected that overall individuals will benefit from Universal Credit by the equivalent benefit expenditure rise of £2.6bn. Within this group some may have higher entitlements whilst other may have lower entitlements compared to the current system.
2) Around 2.7m households will be entitled to higher entitlements under Universal Credit. The increase in benefit payments will generate welfare gains to households, with 85% of the gains going to households in the bottom two quintiles of the income distribution.
Other key non-monetised benefits by ‘main affected groups’
1) Increased simplicity and improved work incentives under Universal Credit will lead to higher employment. As a result, there will be positive welfare impacts due to increases in incomes for individuals who move into work in response to the reformed benefits system. In addition, there will be associated wider social benefits due to reduced crime and improved health outcomes.
2) Universal Credit will reduce the number of individuals in poverty. On reasonable assumptions, the combined impact of take-up and entitlements might lift around 950,000 individuals out of poverty, including 350,000 children and more than 600,000 working-age adults. These poverty impacts exclude the positive impacts of more people moving into work.
3) We have taken a conservative approach in capturing the fiscal impacts of improved work incentives. The costs and benefits are calculated using a static model and do not take into account the dynamic impacts of the policy, i.e. the increased number of people in work and resulting associated benefits. Therefore, Exchequer savings from moving people into employment have not been included in this Impact Assessment. Neither have the welfare impacts of moving individuals into work.
Key assumptions/sensitivities/risks Discount rate (%) 3.5%
The costs/savings are calculated before taking account of any behavioural change. Importantly they
exclude any additional impact on work patterns. Unless otherwise stated, the estimates of costs/savings are calculated from the Department's Policy Simulation Model (PSM). They compare Universal Credit with the benefit and Tax Credit system projected forwards to 2014/15 this takes account of projected changes in demography and economy. Clearly any estimates into the future will have an element of uncertainty, however, this analysis uses the best available data to provide a robust assessment of the likely pattern of impacts resulting from these changes The costs savings are calculated on a static basis, and so do not allow for benefits from the policy intention of moving more people into work.
Impact on admin burden (AB) (£m): Impact on policy cost savings (£m): In scope New AB: AB savings: Net: Policy cost savings:
Enforcement, Implementation and Wider Impacts
What is the geographic coverage of the policy/option? Great Britain From what date will the policy be implemented? October 2013 Which organisation(s) will enforce the policy? DWP
What is the annual change in enforcement cost (£m)? NA Does enforcement comply with Hampton principles? Yes Does implementation go beyond minimum EU requirements? NA What is the CO2 equivalent change in greenhouse gas emissions?
(Million tonnes CO2 equivalent)
NA NA
Does the proposal have an impact on competition? NO What proportion (%) of Total PV costs/benefits is directly attributable to
primary legislation, if applicable?
Costs: Benefits:
Annual cost (£m) per organisation
(excl. Transition) (Constant Price)
Micro < 20 Small Medium Large
Are any of these organisations exempt? N/A N/A N/A N/A N/A
Specific Impact Tests: Checklist
Please note this checklist is not intended to list each and every statutory consideration that departments should take into account when deciding which policy option to follow. It is the responsibility of
departments to make sure that their duties are complied with.
Does your policy option/proposal have an impact on…? Impact Page ref within IA
Statutory equality duties1 YES Separate
Publication
Economic impacts
Competition NO
Small firms NO
Environmental impacts
Greenhouse gas assessment NO
Wider environmental issues NO
Social impacts
Health and well-being NO
Human rights NO
Justice system NO
Rural proofing NO
Sustainable development NO
1
Evidence Base (for summary sheets) – Notes
References
Include the links to relevant legislation and publications, such as public impact assessment of earlier stages (e.g. Consultation, Final, Enactment).
No. Legislation or publication
1 21st Century Welfare - (http://www.dwp.gov.uk/docs/21st-century-welfare.pdf)
2 Universal Credit: Welfare That Works (http://www.dwp.gov.uk/docs/universal-credit-full-document.pdf) 3 Impact Assessment Universal Credit : Welfare That Works
SUMMARY
- Universal Credit will radically restructure the way in which benefits are calculated. The rationalisation of the benefit calculation rules will remove the more perverse features of the current system, and will substantially improve work incentives.
- As a result of the changes in benefit calculation, Universal Credit will restructure the pattern of entitlements; combined with increased take-up and the impact of greater simplicity, Universal Credit has an overall long-run cost to the exchequer of around £2.6bn in benefit expenditure2. This does not allow for the potential benefits from the dynamic impacts which are the policy intention. The £2.6bn consists of an increase of £2bn due to changes in entitlement rules and around a further £2.6bn taking account of increased take-up. Offsetting this it is estimated that there will be savings of around £2bn due to reduced fraud, error and overpayments together with changes to the current earnings disregards in tax credits. The net impact of Universal Credit will be to redistribute income to households with lower incomes.
- In the longer term, reduced complexity has the potential to lead to savings of more than £0.5bn a year in administrative costs.
- It is estimated that around 2.7m households will have higher entitlements as a result of Universal Credit, with over 1 million household seeing an increase in entitlements of more than £25 a week. 85 per cent of this increase will be going to households in the bottom two quintiles of the income distribution.
- Transitional protection will ensure that there are no cash losers from Universal Credit. At the point of transition, households who would otherwise see a reduction in their entitlement will receive full cash protection against this change.
- In the longer-term approximately 1.7m households will have notional lower entitlements than they otherwise would have done as a result of Universal Credit, although more than 75 per cent of these will have a reduction of less than £25 per week.
- The greater simplicity of Universal Credit will lead to a substantial increase in the take-up of currently unclaimed benefits, with most of the impact being at the lower end of the income distribution. The changes to entitlement are estimated to increase average weekly net income in the bottom two income deciles by £4 and £5 per week respectively. After accounting for
imperfect take up in the current system and improved take up under Universal Credit, the gain for the bottom two deciles increase to £14 and £12 per week respectively.
- Universal Credit will substantially improve the incentives to work; the number of households who lose more than 70 per cent of their earnings through taxation and benefit withdrawal on moving into 10 hours of work will fall by 1.1m under Universal Credit.
- Universal Credit improves the incentives to increase hours of work; as a result of the single withdrawal rate, 1.46m households will see a reduction in their marginal deduction rate (MDR) and there will now be virtually no households with MDRs above 80 per cent. Although 2.11m will see an increase in their MDR the median MDR will increase by only four percentage points. These households tend to have higher incomes and would be in receipt of Tax Credits in the current system. For some households the increase in MDRs occurs because they are receiving support which they don’t receive under the current system, and so is associated with an
improvement in their financial position.
INTRODUCTION
1. The White Paper (“Universal Credit: Welfare that Works”) set out the principles of the reform of the benefit system which the Government is planning to undertake. The purpose of these
2
changes is to remove or mitigate the many financial and administrative barriers to taking work which are inherent in the current system. This Impact Assessment provides the Government’s current assessment of the broad impacts of the Universal Credit based on the key components of the Universal Credit as outlined previously in the White Paper. The department will provide further iterations of this Assessment as the policy develops.
2. The policy rationale is to remove the financial and administrative barriers to work inherent in the current welfare system. The reform is designed to ensure that work always pays and to
encourage more people to see work as the best route out of poverty. In the longer-term, it will reduce the economic costs of worklessness and reduce the number of children and adults living in poverty. On reasonable assumptions, the combined impact of take-up and entitlements might lift around 950,000 individuals out of poverty, including 350,000 children and more than 600,000 working-age adults.
3. In the current benefit system, the financial returns to work can often be very weak. Many
claimants would have most of any increase in earnings deducted from their benefits/Tax Credits, with some households facing deduction rates as high as 96 per cent. These deductions often vary in unpredictable ways depending on the level of earnings and the combination of benefits and Tax Credits received.
4. Similarly, the incentives to move into work can be weak, particularly at low earnings or hours. Under the current system, if one person in a workless household moves into work then a very high proportion of their earnings is offset by reduced benefits and Tax Credits. For example around 1.3 million households face losing more than 70 per cent of their earnings if they move into work of 10 hours a week at the National Minimum Wage.
5. This problem is compounded by the administrative complexity of the system. There are separate systems for out-of-work and in-work support so a move into work entails a recalculation of
entitlement and possible delays and gaps in payment. As a result, many people are not prepared to take the risk of moving into work.
6. The Universal Credit system will improve work incentives in three ways:
• Ensuring that support is reduced at a consistent and predictable rate, and that people generally keep a higher proportion of their earnings;
• Ensuring that any work pays and, in particular, low-hours work;
• Reducing the complexity of the system, and removing the distinction between in-work and out-of-work support, thus making clear the potential gains to work and reducing the risks associated with moves into employment.
7. In addition, the Universal Credit will have a positive impact on child poverty; in the steady-state, taking into account improved take up as well as entitlement changes, Universal Credit will lift 350,000 children out of poverty. This is due both to the re-focusing of entitlements on lower income in-work households, and because a simpler system should lead to a considerable increase in the take-up of Universal Credit compared to the current system of benefits and Tax Credits. In effect, there will be ‘automatic passporting’ for people who currently claim some, but not all, of the benefits or Tax Credits to which they are currently entitled. In addition, the simpler system will reduce the scope for fraud, error and overpayments thus ensuring that the right benefit is paid to the right people at the right time.
Universal Credit Model and the Baseline
8. White Paper Universal Credit: Welfare that Works, set out the Government’s intended overall design for Universal Credit. This Impact Assessment presents analysis of the impacts of Universal Credit based on that design. It includes analysis of changes in entitlements,
9. Some aspects of the policy design of Universal Credit are still to be finalised, for example childcare payments and the method by which Universal Credit will be paid.
10. Council Tax Benefitwill be abolished and Local Authorities will be given scope to take account of the priorities of their own communities when determining the amount of support for low-income households to meet their Council Tax bills. There is more work to be done on the detail of the new system and the Department for Work and Pensions (DWP) and the Department for Communities and Local Government (DCLG) will work closely together with local government and devolved administrations to flesh out the overall framework. In doing so the Government will aim to protect the most vulnerable, particularly pensioners, and not undermine the positive impact of Universal Credit on work incentives. In the absence at this stage of further detail on the workings of the new system, the analysis in this Impact Assessment includes Council Tax Benefit in its current form both in the baseline and as part of Universal Credit. The Department will look further at the impact of these proposals in subsequent iterations of the Impact
Assessment.
11. Unless otherwise stated, the modelling in this Impact Assessment is based on the DWP Policy Simulation Model which draws on data from the 2008/09 Family Resources Survey. All costs and benefits are reported in 2010/11 prices. Unless otherwise stated, all impacts are provided in the steady state that is once Universal Credit is fully implemented and transitional protection has been fully exhausted. All the analysis of changes in entitlement is presented on a Before
Housing Costs (BHC) basis, that is before housing costs are deducted from household income.
Fiscal Impacts
12. Once Universal Credit has been fully implemented and transitional protection has been
exhausted we estimate that benefit expenditure will be around £2.6bn higher. This includes an increase of £2bn due to changes in entitlement rules and around £2.6bn due to increased take-up. Offsetting this we estimate that there will be savings of around £2bn due to reduced fraud and error and changes to the de minimis rule and over-payments.
13. There will be three categories of fiscal costs to Universal Credit during the transition period:
• Costs of implementing Universal Credit and transitioning cases to the new system; • The costs of paying transitional protection to ensure that there are no cash losers; • Costs of higher entitlement and take-up as people move over to Universal Credit.
14. £2bn has been set aside to fund transition to Universal Credit during the 2010 Spending Review period. This will include both the administrative costs and any increase in benefit expenditure. In the long-run, Universal Credit has the potential to lead to savings of more than £0.5bn a year in administrative costs.
15. The policy intention is to improve work incentives and so encourage more people to move into work. The estimates of the fiscal impacts do not include any savings from these dynamic impacts.
Benefit entitlement
Take-Up
17.
Because Universal Credit is a simpler system it is anticipated that there will be an increase in the proportion of people who take up their benefit entitlements. Once we adjust our model to account for improvements in take-up the Department anticipate that benefit expenditure will increase by around £2.6bn per annum over and above costs associated with entitlement changes.Fraud, Error and Simplicity
18. The greater simplicity of the Universal Credit scheme will generate savings by reducing the scope for fraud, error and overpayments. In steady-state the Department anticipate the savings to be of the order of £2bn per annum. The savings fall into four categories:
• Hours worked play a minimal role in the Universal Credit assessment, so there will no longer be fraud and error due to misreporting of hours worked in Tax Credits.
• Tax Credits currently contain a de minimis rule (or disregard) for changes of earnings, whereby increases of up to £5,000 per annum and reductions of up to £2,500 do not have to be reported. Under Universal Credit the de minimis rule will be removed which will lead to a net reduction in expenditure;
• Universal Credit will move benefit calculations to real time assessments and will remove the annual process of reconciliation of Tax Credits;
• Universal Credit replaces a range of out of work benefits. Access to real time earnings data and better sharing of information will reduce the amount of fraud and error among these customers. In addition, because more customers will continue to claim Universal Credit after a significant change in circumstances (e.g. a move into work), there will be more
opportunities to recover any overpayments.
Impact on Individual Welfare
Transitional Protection
19. Universal Credit will simplify the rules used to calculate entitlement by introducing a system of tailored earnings disregards and a single taper-rate. As a result, some households will be entitled to more than under the current system, while others will be entitled to less. For those currently receiving benefits or Tax Credits there is a commitment to ensure that no one will experience a reduction in the benefit they are receiving as a result of the introduction of Universal Credit. At the point of transition onto the new system, households who would otherwise experience a reduction in income will receive full cash protection against their losses.
20. At the point of transfer a comparison will be made between the household’s total entitlement from current benefits and Tax Credits and the amount of their Universal Credit entitlement. In the majority of cases, Universal Credit will provide a level of support that is at least as high as the current system so there will be no need for transitional protection. Under Universal Credit, in steady state, around 3.5m households will see no change in their entitlement, 2.7m households will receive higher entitlements and around 1.7m households will receive lower entitlements. If the Universal Credit entitlement is less than that under the old system, the claimant will be
awarded an amount of transitional protection equivalent to the potential reduction in their income. As a result they will not be worse off in cash terms.
21. Over time the value of transitional protection will be eroded as people move off Universal Credit or their circumstances change. As a result, in steady-state, there will be some households whose income is notionally lower than it would have been under the old system. However, these
Changes in household benefit entitlement
22. This section analyses the long-run impact of Universal Credit on the distribution of benefit entitlements. As it is a steady-state analysis it does not allow for transitional protection and, as a result, will not be a full reflection of the impacts on existing claimants during the transition period.
23. Universal Credit is a fundamental reform of the current complex system of benefit rules and therefore leads to both increases and reductions in the level of entitlements. Table 1 segments the change in entitlements by the position of the household in the income distribution. It shows that around 2.7m households have higher entitlements than they would have under the current benefit and Tax Credit system, while 1.7m have lower entitlements. 3.5m households, who are mostly workless, would experience no change.
24. The net impact of the changes is to increase entitlements by around £2bn in steady-state, with most of this money going to households in the lowest two quintiles of the income distribution. As demonstrated in a subsequent section, the changes in entitlement combine with higher take-up to have a progressive impact on the income distribution.
Table 1 – Changes in benefit entitlement by income (households)
Higher Entitlement No Change Lower Entitlement
Bottom Quintile 1,100,000 1,900,000 500,000
2nd Quintile 1,200,000 1,000,000 700,000
3rd Quintile 300,000 400,000 300,000
4th Quintile 100,000 200,000 100,000
5th Quintile * * *
Total 2,700,000 3,500,000 1,700,000
Source: DWP Policy Simulation Model (based on FRS 2008/9),
*
Denotes a figure of less then 50,00025. The majority of households who have a change in entitlement will have an income change of less than £25 a week. The wide ranging scope of the reform does mean that the range of potential changes in entitlement is large, as illustrated in table 2.
Table 2: Banded Changes in entitlement (pounds per week and households)
Higher Entitlement
Lower Entitlement More than £75 100,000 100,000
£50 to £75 300,000 100,000
£25 to £50 700,000 200,000
£10 to £25 1,000,000 500,000
Up to £10 500,000 800,000
Total 2,700,000 1,700,000 Source: DWP Policy Simulation Model (based on FRS 2008/9),
Chart 1: Average change in entitlement by family type (for those households on Universal Credit) 0 0.5 1 1.5 2 2.5 3 3.5 4 4.5 5
Couple with children Couple without children
Lone Parent Single no children
Family Type C h an g e i n en ti tl em en t £/ wee k 0.0% 0.2% 0.4% 0.6% % n e t in c o me g a in e d
Average change in entitlement % net income gained
Source: DWP Policy Simulation Model (based on FRS 2008/9),
27. Table 3 develops this point by showing the distribution of changes in entitlement by family type and household tenure. In all family types there are significant numbers of households with higher or lower entitlements than under the current system. This largely reflects the fact that we are introducing a system for benefit entitlements which removes the unnecessary complexities of the current system. Therefore, the pattern of changes in entitlements is driven as much by the simplification to the calculation rules as by the membership of a particular demographic group.
28. For example, 65 per cent of renting couples with children have higher entitlements as a result of Universal Credit, with only 9 per cent seeing a reduction. The reason for this is that this group benefits from the combination of more generous disregards and a reduced benefit withdrawal rate which creates the more substantial increases in entitlement. Universal Credit takes the first steps to address the couple penalty by rewarding families, especially those with children.
[image:11.595.48.439.63.325.2],
Table 3: Changes in entitlement by family type and household tenure type (row percentages in brackets)
Higher Entitlement No change Lower Entitlement
Under 25 No Children 300,000 (40%) 400,000 (60%) -
Single No Children 400,000 (15%) 1,500,000 (61%) 600,000 (25%) Couple No Children 300,000 (35%) 300,000 (42%) 200,000 (24%) Lone Parent - Renting 400,000 (32%) 800,000 (60%) 100,000 (7%) Lone Parent - No Rent 300,000 (43%) 100,000 (18%) 300,000 (39%) Couple with Children - Renting 500,000 (65%) 200,000 (26%) 100,000 (9%) Couple with Children - No Rent 500,000 (49%) 100,000 (10%) 400,000 (41%)
All 2,700,000 (34%) 3,500,000 (45%) 1,700,000 (21%)
Source: DWP Policy Simulation Model (based on FRS 2008/9), 2014/15
Why do entitlements change under Universal Credit?
• A tailored system of earnings disregards which are generally higher than under the current system. This allows people to keep more of their earnings, thus improving work incentives. Different amounts will be disregarded from earnings before the taper applies in order to reflect the needs of different families and ensure that work pays for those who need the most support. There will be considerably higher disregards for lone parents and couples with children, and lower disregards for single people without children;
• Due to affordability constraints the amount to be disregarded will be reduced to reflect support people receive for rent or mortgage interest support. Increasing earnings disregards allows people to keep more of their earnings, therefore improving work incentives;
• A single withdrawal rate of 65 per cent, which can be higher or lower than the current withdrawal rate depending on the combination of benefits/Tax Credits currently received by the household, but which eradicates the very high withdrawal rates currently faced by many;
• Removal of Working Tax Credit (WTC) which tends to have higher amounts in payment for people working 16 and 30 hours;
• Childless 18-24 year olds (who are not disabled) can not claim in-work Tax Credits under the current rules, but will be able to claim Universal Credit;
• Applying a capital rule to child elements for people with capital of more than £16,000.
30. Universal Credit has very simple rules for calculating entitlements, but the move away from the complexities of the current system means that some of the changes in entitlement will be driven by complex interactions between the different changes. This can be illustrated by two examples:
• Lone parents are more likely to see higher entitlements due to higher disregards, whereas the removal of the 16 and 30 hour premia will reduce entitlements;
• Households who are towards the upper end of the income distribution may benefit from a higher earnings disregard (depending on the household circumstances) under Universal Credit but may also have a higher withdrawal rate applied to their earnings compared with current rules.
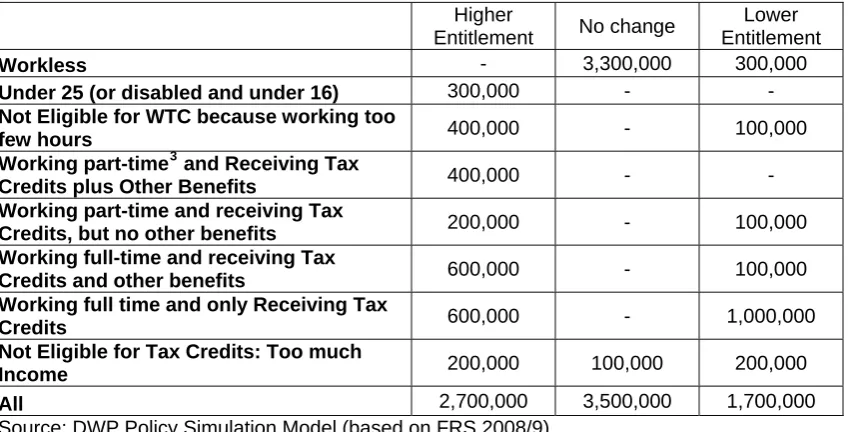
Table 4: Changes in entitlement by work status and Tax Credit eligibility (for households who entitled to state support under both the current system and Universal Credit)
Higher
Entitlement No change
Lower Entitlement
Workless - 3,300,000 300,000
Under 25 (or disabled and under 16) 300,000 - -
Not Eligible for WTC because working too
few hours 400,000 - 100,000
Working part-time3 and Receiving Tax
Credits plus Other Benefits 400,000 - -
Working part-time and receiving Tax
Credits, but no other benefits 200,000 - 100,000
Working full-time and receiving Tax
Credits and other benefits 600,000 - 100,000
Working full time and only Receiving Tax
Credits 600,000 - 1,000,000
Not Eligible for Tax Credits: Too much
Income 200,000 100,000 200,000
All 2,700,000 3,500,000 1,700,000
Source: DWP Policy Simulation Model (based on FRS 2008/9),
32. In most cases workless households experience no change in their entitlement in static financial terms. This is because they do not benefit from the earnings disregard, and their basic benefit rates are as in the current benefit and Tax Credit system.
33. Claimants who are under 25, who are childless and not disabled, are currently unable to claim WTC when they are in work. Therefore they will benefit from the removal of this exclusion within Universal Credit. Likewise households who are working part-time and who receive Tax Credits and other benefits, will gain from the fact that they will have a lower withdrawal rate than under the current system and because they are likely to have a higher earnings disregard.
34. Working households not currently receiving WTC but receiving other benefits will tend to have higher entitlements under Universal Credit. They benefit from the fact the Universal Credit taper is lower than the combined taper on their current suite of benefits and Tax Credits, but they do not experience an offsetting reduction due to the removal of WTC.
35. If households are working less than 16 hours, and are either disabled or have children, then they benefit from the fact that their earnings disregards are generally higher than under the current system. Because they are working below 16 hours they are not currently entitled to WTC, and so will not be affected by the fact that the generosity of WTC is duplicated in the current system.
36. If households are in receipt of Housing Benefit, Council Tax Benefit and Tax Credits then they will have a lower withdrawal rate under Universal Credit and so are more likely to receive higher entitlements.
37. Around 200,000 households who are currently not eligible for Tax Credits because their household income is above the eligibility threshold, also receive Council Tax Benefit in the current system. These households will not be eligible for Universal Credit.
38. The households with lower entitlements will tend to be claimants who are in one or more of the following categories;
• Those in receipt of a large amount of WTC;
• Those who do not receive HB/CTB;
• Those who have a low disregard;
3
• Households with substantial amounts of capital.
39. Many people who currently receive a large amount of support through WTC, for example those who receive the 16/30 hour premia, will generally have lower entitlements under Universal Credit because the generosity of their WTC entitlements is not replicated under Universal Credit. For some households the impact of this change will be offset by the impact of the higher disregards and a lower withdrawal rate.
40. As a proportion of those with lower entitlements, nearly 60% fall into a group with these three characteristics:
• working more then 30 hours and, • receiving WTC (and/or CTC) and, • not in receipt of HB and/or CTB.
41. However, households with children are less likely to have lower entitlements then those without children. Of renting households with children, 65 per cent have higher entitlements, whereas only 30 per cent of renting households without children have higher entitlements. Likewise for non renting households, 41% of those with children will have higher entitlements compared with 8% for the equivalent group without children.
42. Likewise, working households who are currently only in receipt of Tax Credits will have a higher withdrawal rate under Universal Credit. These households currently face a 41 percent taper rate on gross income or 73 per cent MDR after tax and NI. However under Universal Credit the taper rate will increase to 65 percent on net income or 76 percent MDR after tax and Nl. Therefore, these households are more likely to have a lower entitlement. However, in some cases, this effect will be offset by the impact of the higher disregards under Universal Credit.
Entitlement changes and transitional protection
43. As outlined above, the move to a simpler system will mean that some households will be entitled to more than under the current system, while some will be entitled to less.
44. For those currently receiving benefits or Tax Credits there is a commitment to ensure that no one will experience a reduction in the benefit they are receiving as a result of the introduction of Universal Credit. At the point of transition onto the new system, those households whose circumstances remain unchanged and who would otherwise experience a reduction in income will receive full cash protection.
45. At the point of transfer a comparison will be made between the household’s total entitlement from current benefits and Tax Credits and the amount of their Universal Credit entitlement. As already demonstrated, for a majority of households Universal Credit will provide a level of support that is similar to or higher to that in the current system so there will be no need for transitional protection. If the Universal Credit entitlement is less than that under the old system, the claimant will be awarded an amount of transitional protection equivalent to the potential reduction in their income. As a result they will not be worse off in cash terms.
Impacts on Income Distribution and Poverty
46. Universal Credit removes many of the complexities and inconsistencies of the current benefit and Tax Credit system and replaces it with increased support for low-income families and consistency in support as income rises. However, this simplification will mean that, in the long term, some households will be entitled to less under Universal Credit than they would have been had the current benefit and Tax Credit system continued. It is important to note that the design of the current system creates greater incentives to work at particular levels of hours of work,
Universal Credit and the circumstances of current benefit and Tax Credit claimants change. Chart 2 below illustrates this long-term impact after transitional protection has been fully eroded, showing the average change in income for the working age population in each ten per cent band (decile) of the income distribution.
47. The chart shows that the bottom two deciles of the income distribution will see increases in entitlement of around £4.40 and £5.40 a week. For the bottom decile this equates to an increase of about 2.4 per cent of average weekly income. It also shows that Universal Credit will benefit poorer families, with the poorest gaining the most as a proportion of their income. Those higher up the income distribution see gains which are smaller as a proportion of their income. The second decile gains 1.9 per cent on average and the sixth decile sees a 0.04 percentage increase in income. The higher income deciles see small reductions in net income, with the average change in net income being less than a 50p a week. Chart 2 also shows that when we adjust for improvements in take-up the gains to the bottom of the income distribution are even greater. The bottom two deciles gain around £10 and £6 more a week respectively. This is also represented in the percentage of net income changed. For the bottom decile this represents nearly an 11 percent increase in weekly income.
48. The most substantial reductions in entitlement are in the 7th decile, where households in the decile lose an average of 30p a week The reason for this is that those in the seventh decile are most likely to be in receipt of Working Tax Credit and no other elements of the current system; they will tend to have lower entitlements as outlined above.
Chart 2 – Long term Distributional Impact – Entitlement changes by income decile (caseload and average change in entitlement)
-£2.00 £0.00 £2.00 £4.00 £6.00 £8.00 £10.00 £12.00 £14.00 £16.00
1 2 3 4 5 6 7 8 9 10
Decile C h a n g e in n e t in c o m e £ /we e k -2% 0% 2% 4% 6% 8% 10% 12% 14% 16% % ne t i n c om e i nc re a s e d/ re duc e d
Average change in net income (Assuming imperfect take-up)
Average change in net income (Assuming perfect take-up) % net income increased/reduced (Assuming perfect take-up)
% net income increased/reduced (Assuming imperfect take-up)
49. Chart 3 below shows the distribution of changes in entitlement by income decile. In the first six decile groups there are more households with higher entitlements than lower entitlements. Households in the top half of the income distribution are less likely to be affected by the
introduction of Universal Credit. This is because they are currently not entitled to means tested benefits and are therefore unlikely to be affected by the changes.
Chart 3: Entitlement changes by income decile
0%
10%
20%
30%
40%
50%
60%
70%
80%
90%
100%
1
2
3
4
5
6
7
8
9
10
Income decile
Reduced Entitlement
No Change Increased Entitlement
Source: DWP Policy Simulation Model (based on FRS 2008/9),
50. Chart 4 shows the effect of Universal Credit on poverty by family type. Poverty is defined as living below 60 per cent of equivalised medium income. Changes in modelled entitlements suggest a substantial impact on poverty in steady-state - lifting approximately 200,000 children and 400,000 working age adults out of poverty. In addition, the increased take-up of currently unclaimed entitlements will strongly reinforce the positive impact on poverty. On reasonable assumptions, the combined impact of take-up and entitlements might lift around 950,000
individuals out of poverty, including 350,000 children and more than 600,000 working-age adults. These poverty impacts exclude the positive impacts of more people moving into work.
51. The introduction of Universal Credit will significantly improve the take-up of unclaimed
entitlements, a powerful tool in tackling poverty. This is partly because it will be easier for people to understand the level of benefit to which they are entitled. In addition, there will be an
Chart 4: The impact of Universal Credit on poverty by family type
Change in poverty by family type
-1,000,000 -900,000 -800,000 -700,000 -600,000 -500,000 -400,000 -300,000 -200,000 -100,000 0
All individuals Children Working age
C
h
a
n
ge
i
n
po
v
e
rt
y
(
n
o.
o
f i
nd
iv
idu
a
ls
)
Perfect Take-Up Imperfect Take-Up
Source: DWP Policy Simulation Model (based on FRS 2008/9),
Impact on Work Incentives
52. The Universal Credit will substantially improve incentives to work in three key ways:
• It will increase the incentive to start work by increasing the proportion of earnings which people keep when they move into work – this is measured through changes in the participation tax rate (PTRs);
• It will increase the incentive to increase hours of work and progress through the labour market by reducing the proportion of any increase in earnings which is lost due to tax or reduced benefit payments – this is measured through the marginal deduction rates (MDRs)
• It will be a simpler system which removes some of the risks associated with moves into work and makes much clearer the actual financial gain from working.
• The current system mainly rewards those working 16 or 30 hours, under Universal Credit all hours of work are rewarded.
• The higher earnings disregards and lower taper rate means that many households will be able to keep a higher proportion of their earnings. Therefore, Universal Credit encourages workless households to take up mini jobs. Mini jobs are important in helping individuals who have spent long periods in unemployment take steps into the labour market, particularly, those on ESA (Work Related Activity Group) and individuals on IS.
Impact on Employment incentives - Participation Tax Rates
54. PTRs are obviously important for individuals considering the decision to enter work. However, for Universal Credit to have the desired effect it will also be important that individuals understand the system and can see the gain to work. Therefore the greater transparency of the new system will be an important component in maximising the benefits of improved PTRs.
55.
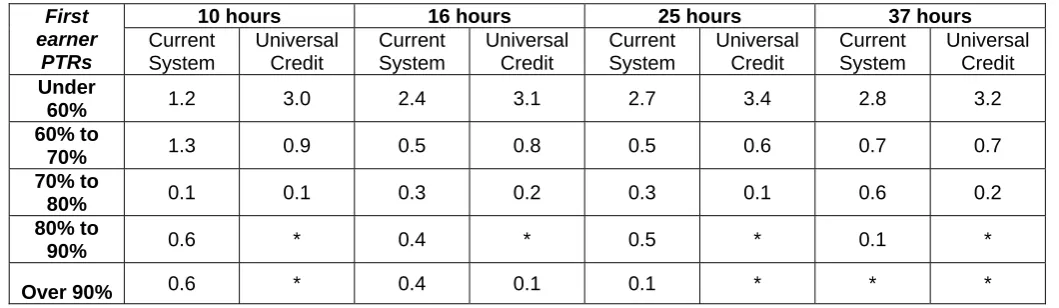
Table 5 below, illustrates the change in PTRs for first earners in workless households at different points of hours worked. It is assumed that those entering work do so at the National Minimum Wage (NMW) of £5.93 per hour4. It shows that under Universal Credit there is a large reduction in the number of households facing PTRs of over 70 per cent. For example, for those who go into 10 hours of work, the number of households facing PTRs of over 70 per cent falls by around 1.1 million under Universal Credit. For those entering 16 hours of work, the number of [image:18.595.35.565.223.377.2]households who face PTRs over 70 per cent falls by over 900,000.
Table 5: PTRs for first earners in a workless household at various hours (millions, individuals)
10 hours 16 hours 25 hours 37 hours
First earner
PTRs
Current System
Universal Credit
Current System
Universal Credit
Current System
Universal Credit
Current System
Universal Credit
Under
60% 1.2 3.0 2.4 3.1 2.7 3.4 2.8 3.2
60% to
70% 1.3 0.9 0.5 0.8 0.5 0.6 0.7 0.7
70% to
80% 0.1 0.1 0.3 0.2 0.3 0.1 0.6 0.2
80% to
90% 0.6 * 0.4 * 0.5 * 0.1 *
Over 90% 0.6 * 0.4 0.1 0.1 * * *
Source: DWP Policy Simulation Model (based on FRS 2008/9), 2014/155. Figures may not sum due to rounding
‘*’ denotes fewer than 50,000 people
56. These reductions occur for two reasons:
• Universal Credit provides higher earnings disregards for many more people than does the current system;
• For those households earning above their disregard, the single taper rate is lower than the 100 per cent taper which they face under current out of work benefits, or the very high withdrawal rate for if they face the simultaneous tapers for Housing Benefit, Council Tax Benefit and Tax Credits.
57. Table 6 below shows the PTRs for potential second earners in a household, where one partner is already in work. The second earner is assumed to enter work at the NMW. In general, second earners face higher PTRs because the earnings disregard is exhausted by the earnings of the main earner. Furthermore, two earner households are likely to have a higher income and
therefore are less likely to face simultaneous tapers on more than one benefit or Tax Credit. For this reason second earners do not benefit as much from the reduced taper under Universal Credit.
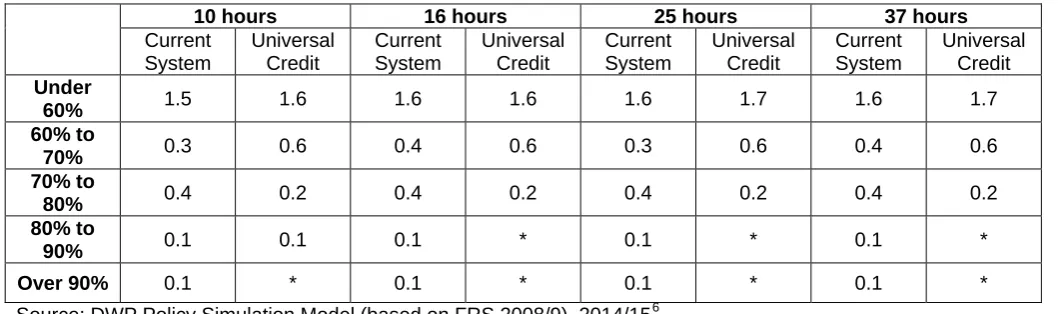
58. More broadly, as the Universal Credit delivers a more progressive tax and benefit system, a couple with two earners who have a higher income tend to lose a bit more in terms of state support.
59. Although the number of workless households will reduce, it is possible that in some families, second earners may choose to reduce or rebalance their hours or leave work. In these cases, the improved ability of the main earner to support his or her family will increase the options available for families to strike their preferred work/life balance.
4
In 2010/11 5
60.
Table 6 illustrates this point, highlighting that Universal Credit has very little effect on second earner PTRs. In some instances there is an increase in PTRs for the second earner, primarily for those households who are currently in receipt of Tax Credits but not other benefit; this is [image:19.595.37.568.147.304.2]primarily because their current MDR of 73 per cent is lower than the 76.2 per cent which will apply under Universal Credit.
Table 6: PTRs for potential second earners at various hours (millions, individuals)
10 hours 16 hours 25 hours 37 hours
Current System Universal Credit Current System Universal Credit Current System Universal Credit Current System Universal Credit Under
60% 1.5 1.6 1.6 1.6 1.6 1.7 1.6 1.7
60% to
70% 0.3 0.6 0.4 0.6 0.3 0.6 0.4 0.6
70% to
80% 0.4 0.2 0.4 0.2 0.4 0.2 0.4 0.2
80% to
90% 0.1 0.1 0.1 * 0.1 * 0.1 *
Over 90% 0.1 * 0.1 * 0.1 * 0.1 *
Source: DWP Policy Simulation Model (based on FRS 2008/9), 2014/156. Figures may not sum due to rounding
‘*’ denotes fewer than 50,000 people
Employment incentives by Family Type
61. Table 7 shows that the Universal Credit virtually eliminates the highest PTRs (above 70 per cent) making it much more worthwhile for all family types to consider work at 10 hours a week. Single adults without children are most likely to face the highest PTRs under the current system. In the current system they have a very small earnings disregard (£5 a week unless they have a
disability in which case it is £20) and then face a pound for pound taper on their ESA/IS/JSA.
Table 7: PTRs for the first earner in a workless household if they were to enter work at 10 hours per week (working age only) by family type (millions, individuals)
Couple with children Couple without
children Lone parent
Single without children PTR for first
earners Current system Universal Credit Current system Universal Credit Current system Universal Credit Current system Universal Credit
Below 60% 0.1 0.3 0.2 0.4 0.1 0.9 0.9 1.5
60% to 70% 0.1 * 0.1 * 0.5 * 0.6 0.9
70% to 80% * 0 * * * 0 0.1 0.1
80% to 90% 0.1 0 0.1 0 0.1 0 0.2 *
0ver 90% * 0 * 0 * 0 0.5 *
Source: DWP Policy Simulation Model (based on FRS 2008/9), 2014/157. Figures may not sum due to rounding
‘*’ denotes fewer than 50,000 people
Impact on Earnings incentives – Marginal Deduction Rates
62. Marginal Deduction Rates (MDRs) measure the incentive for someone to increase their hours of work. As the earnings of a household increase, means-tested benefits and Tax Credits start to be withdrawn. In addition, above a certain level of earnings, the increase in their wages will also be partially offset by income tax and national insurance contributions. The MDR is calculated as the proportion of a small increase in earnings which is lost in lower benefits/Tax Credits and/or higher income tax and national insurance payments.
6
Modelling is based on entitlement changes only. 7
63. Under the current system, many households have very high MDRs which substantially damage their incentive to increase their hours of work. There are two particularly notable circumstances in which very high MDRs occur:
• Firstly, MDRs are 100 per cent for anyone working while in receipt of IS/ESA/JSA and whose earnings are above the disregard level;
• People who have exhausted their IS/ESA/JSA but are simultaneously in receipt of
Housing Benefit, Council Tax Benefit and Tax Credits, can have MDRs as high as 96 per cent.
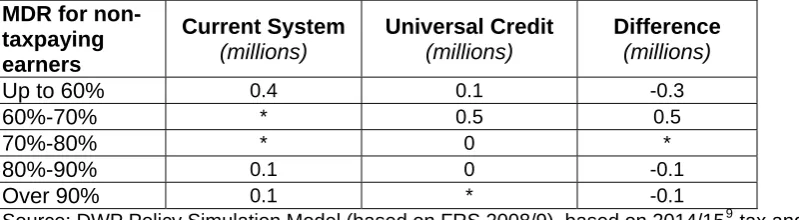
64. Universal Credit replaces the multiplicity of tapers for in-work support with a consistent taper of around 65 per cent, and removes the 100 per cent taper for out of work benefits; as a result Universal Credit will reduce the highest MDRs, as illustrated in tables 8 and 9 which compare the distribution of MDRs under the current and the new system. The tables illustrate the fact that, to all intents and purposes, no in-work households will face an MDR of above 76.2 per cent under the new Universal Credit system. One of the key impacts of Universal Credit is that around 700,000 people, who currently have MDRs above 80 per cent, will see their MDR reduced to 76.2 per cent or lower. Once Universal Credit is in place, the government will have the scope to adjust the taper rate to further increase work incentives.
65. It is important to note that MDRs are partially driven by the generosity of the benefit system. There is a trade off between increasing entitlements and reducing MDRs. It is possible to reduce MDRs by reducing entitlements. However, under Universal Credit 2.7 million households will receive higher entitlements and some of these households will see their MDRs increase as a result. For example, some households become entitled to some state support for the first time under Universal Credit; as a result the Universal Credit taper will be combined with tax/NI thus increasing their MDR. Therefore, for these households, the increase in MDRs is associated with an increase in their income.
[image:20.595.44.444.491.601.2]66. Additionally, the effectiveness of reducing MDRs on work incentives will be supported by the greater simplicity and transparency of the new system.
Table 8: MDRs8 for those in work (working age only), earning below the tax threshold
MDR for non-taxpaying earners
Current System (millions)
Universal Credit (millions)
Difference (millions)
Up to 60% 0.4 0.1 -0.3
60%-70% * 0.5 0.5
70%-80% * 0 *
80%-90% 0.1 0 -0.1
Over 90% 0.1 * -0.1
Source: DWP Policy Simulation Model (based on FRS 2008/9), based on 2014/159 tax and benefit rules. Figures may not sum due to rounding
‘*’ denotes fewer than 50,000 people
8
MDRs for those receiving income related benefits or Tax Credits in the current system or receiving the new Universal Credit. Self employed and students are excluded.
9
Table 9: MDRs10 for those in work (working age only), earning above the tax threshold
MDR for taxpaying earners
Current System (millions)
Universal Credit (millions)
Difference (millions)
Up to 60% 0.9 0.8 -0.2
60%-70% 0.2 0.4 0.2
70%-80% 1.6 2.0 0.4
80%-90% 0.4 * -0.4
Over 90% 0.1 * -0.1
Source: DWP Policy Simulation Model (based on FRS 2008/9), 2014/1511. Figures may not sum due to rounding
‘*’ denotes fewer than 50,000 people
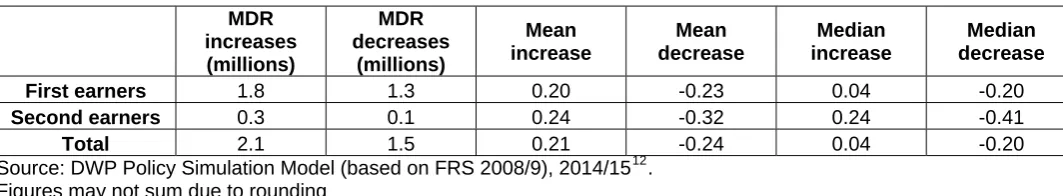
Distribution of Changes in MDRs
67. Table 10 summarises the impact of Universal Credit on the distribution of MDRs, and segments them into first and second earners in the household. Some 2.1m individuals will have higher MDRs under Universal Credit but the median increase will be comparatively small, at around four percentage points. Many of these cases will be households with above-average income for Universal Credit claimants, and who move from an MDR of 73 to 76.2 per cent.
68. Around 1.5m individuals will have lower MDRs under Universal Credit with a median reduction of twenty percentage points; this reflects the virtual elimination of the highest MDRs under Universal Credit and the move to a maximum MDR of 76.2 per cent.
69. 330,000 second earners will face higher MDRs under Universal Credit and 140,000 second earners will witness reduced MDRs. The median increase is higher for this group than for first earners, reflecting the fact that second earners already tend to have lower MDRs. A second earner who does not earn enough to pay income tax or national insurance, but whose household income is sufficiently high to place them on the Tax Credit taper would have an MDR under the current system of 41 per cent. This would increase to 65 per cent under the new system.
[image:21.595.47.579.551.649.2]70. In some cases an increase in MDR would occur because the reduced taper of Universal Credit means that a household would still be in receipt of some of the benefit at a point where under the current system their benefits/Tax Credits would have tapered away completely. In this case, the increase in the MDR is associated with an increase in their net income.
Table 10: Changes in MDRs
MDR increases (millions)
MDR decreases
(millions)
Mean increase
Mean decrease
Median increase
Median decrease
First earners 1.8 1.3 0.20 -0.23 0.04 -0.20
Second earners 0.3 0.1 0.24 -0.32 0.24 -0.41
Total 2.1 1.5 0.21 -0.24 0.04 -0.20
Source: DWP Policy Simulation Model (based on FRS 2008/9), 2014/1512. Figures may not sum due to rounding
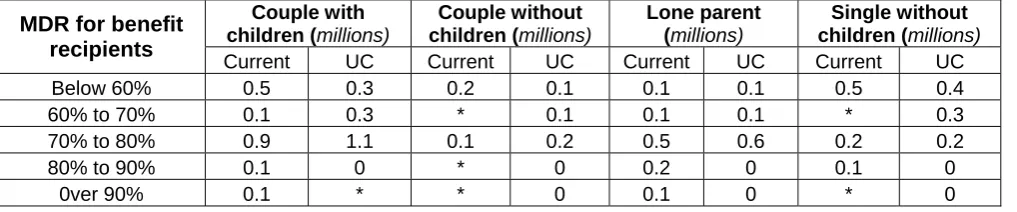
Earnings Incentives by Family Type
71. Table 11 segments the banded MDRs by family type, while Table 12 shows the increases and decreases. Table 11 shows that no household types are left on the highest MDRs. In absolute terms, families with children are the greater beneficiaries from this change.
10
MDRs for those receiving income related benefits or Tax Credits in the current system or receiving the new Universal Credit. Self employed and students are excluded.
11
Modelling is based on entitlement changes only. 12
72. Couples with children are slightly more likely than other family types to see an increase in their MDRs. The median increase is comparatively small (4 percentage points) which reflects the fact that they more likely to have incomes which place them in the group, described above, whose MDRs move from 73 per cent to 76.2 per cent as a result of Universal Credit.
Table 11: MDRs13 for those in work (working age only) by family type
Couple with children (millions)
Couple without children (millions)
Lone parent (millions)
Single without children (millions) MDR for benefit
recipients
Current UC Current UC Current UC Current UC
Below 60% 0.5 0.3 0.2 0.1 0.1 0.1 0.5 0.4
60% to 70% 0.1 0.3 * 0.1 0.1 0.1 * 0.3
70% to 80% 0.9 1.1 0.1 0.2 0.5 0.6 0.2 0.2
80% to 90% 0.1 0 * 0 0.2 0 0.1 0
0ver 90% 0.1 * * 0 0.1 0 * 0
Source: DWP Policy Simulation Model (based on FRS 2008/9), 2014/1514. Figures may not sum due to rounding
‘*’ denotes fewer than 50,000 people
Table 12: MDRs average changes
Couple with children
Couple without
children Lone parent
Single without
children All
MDR increases (millions) 1.1 0.2 0.5 0.4 2.1
MDR decreases (millions) 0.6 0.2 0.4 0.4 1.5
Mean increase 18 34 7 43 21
Mean decrease -23 -33 -22 -24 -24
Median increase 4 44 4 45 4
Median decrease -20 -20 -14 -20 -20
Source: DWP Policy Simulation Model (based on FRS 2008/9), 2014/1515. Figures may not sum due to rounding
73. For those people for whom MDRs fall, the reductions are substantial across all of the family types. This reflects the removal of the very high MDRs in the current system. The increases are more variable with families without children experiencing the largest average increase. The numbers affected by these larger increases will be comparatively small, and some of them will be people who become newly entitled to support as a result of Universal Credit, and so
experience an increase in their net income.
Examples of impacts on Work Incentives
74. In this section we have assessed the impact of Universal Credit on work incentive for four hypothetical family types. For each family we have compared the budget constraints under Universal Credit and the current system. The budget constraints show how net income changes as hours worked increase. The level of the budget constraint shows the net income received at particular levels of hours worked, while the slope is an indication of the MDR faced by the household.
Single person
75. Chart 5 shows the budget constraints for a single person aged over 25 who earns the national minimum wage and who pays £80 rent and £15 council tax a week.
13
MDRs for those receiving income related benefits or Tax Credits in the current system or receiving the new Universal Credit. Self employed and students are excluded.
14
Modelling is based on entitlement changes only. 15
76. Under Universal Credit, support is withdrawn at a consistent rate of 65% which is reflected in the stable slope of the budget constraint. Interactions with income tax and NI leads to small shifts in the slope (i.e. the MDR) at 20 hours as the individual starts paying NI contributions, and at 25 where the individuals begins to pay income tax; however the MDR doesn’t vary outside the range of 65% to 76.2%.
77. The budget constraint under the current system is considerably more complex:
• The individual experiences a small increase in income when they first enter work (working less than 1 hour) due to the £5 earnings disregard. They then experience no further increase in income up to 12 hours of work, due to the 100% deduction rate for out of work benefits.
• At 13 hours the individual moves onto the tapers for Housing Benefit and Council Tax Benefit and will face an MDR of 85 per cent. Between 13 and 40 hours, the MDR varies between 76 per cent and 91 per cent.
• There are several discontinuities in the budget constraint as benefits are withdrawn at different rates and the individual becomes entitled to increase in support, for example Working Tax Credit at 30 hours.
78. At virtually all levels of hours worked in the chart the individual is financially better off under Universal Credit. With the following exception:
• When they work fewer then 5 hours they benefit from a £5 disregard under the current system which isn’t available under Universal Credit.
79. In general the individual faces higher PTRs under the current system than they do under Universal Credit. Under Universal Credit the PTR never increases above 75 per cent, whereas under the current system the individual can face a PTR of over 90 per cent on the first few hours worked. This reflects the higher rate of withdrawal under the current system.
80. In general, the individual faces a lower MDR under Universal Credit than the current system. The exceptions are:
• When the individual works less the 1 hour their earnings are disregarded under the current system;
• At 30 hours when the individual becomes entitled to a payment of WTC;
Chart 5: Budget Constraint for a single person
£0 £50 £100 £150 £200 £250 £300
0 10 20 30 40 50
Customer hours worked
W
eekl
y N
et
i
n
co
m
e
Current system Universal Credit
Couple with two children
81. Chart 6 below shows the budget constraint for a couple with two children. They are assumed to pay £80 rent and £15 council tax a week. This is a single earner household working at the national minimum wage.
82. It shows that the couple are on average better off under Universal Credit. Under Universal Credit the household sees a gradual increase in net income as the number of hours worked increases. As with the example above under Universal Credit support is withdrawn at a steady rate of 65 per cent. Small shifts in the slope occur at various points due to NI and tax contributions. These points are:
• At 20 hours where the individual starts paying NI contributions;
• At 25 where the individuals begins to pay income tax;
83. Under the current system the budget constraint is more complicated as there are interactions between different benefit tapers along with the NI/Tax rates:
• Under the current system as the working partner increases the number of hours worked they see no increase in income up to 16 hours due to the 100 per cent taper of IS/JSA:
• A steady increase in net income as they become eligible for WTC at 24 hours.
Thereafter, the increase in net income flattens out due to the very high combined taper rate (95 per cent).
84. Chart 6 illustrates that under Universal Credit this household gets to keep more of their earnings when they move into work. Therefore, Universal Credit presents a greater financial incentive than the current system to enter work. The household is financially better off under Universal Credit, with the exception of 24-27 hours worked, where the household has the same net income as under the current system.
85. Under Universal Credit the MDR is more transparent and does not rise above 76.2 per cent. However, under the current system the picture is slightly more complicated:
a result the household faces an MDR of 100 per cent. Therefore, as the working partner increases the number of hours worked they see no increase in income up to 16 hours then a very small increase at 16 hours.
• At 16 hours entitlement to JSA/IS is lost. Therefore, there is a substantial increase in the MDR (401 per cent). At this point the household witnesses a small decrease in household income.
• After 21 hours the household begins to pay NI/Tax so the MDR increases again;
• At 24 hours the household qualifies for WTC and at the same point the HB/CTB taper kicks in so there is a sharp increase in MDR to 96 per cent.
86. Due to the higher earnings disregard under Universal Credit and the lower taper the household faces lower PTRs at all hours worked, with the exception of 24 hours where the household receives WTC. It must be noted, however even at this point the PTRs under the two systems are not dramatically different (53 per cent under the current system and 55 per cent under Universal Credit. Additionally, under Universal Credit there is a steady increase in the PTR, whereas under the current system there are sharp increases at certain points as different tapers kick in.
Chart 6: Budget Constraint for a couple with two children
£0 £50 £100 £150 £200 £250 £300 £350 £400 £450 £500
0 10 20 30 40 50
Customer hours worked
W
eekl
y N
et
i
n
co
m
e
Current system Universal Credit
Lone parent with two children
87. Chart 7 below shows the budget constraint for a lone parent with two children. She is assumed to pay £80 a week in rent and £15 in council tax and receive Income Support when out of work. She is assumed to enter work at the national minimum wage.
88. Under Universal Credit support is withdrawn at more consistent rate 65 per cent. When the individual starts to pay NI and income tax the withdrawal rate increases to a maximum of 76.2 per cent. Under Universal Credit the household sees a gradual increase in income as the number of hours worked increases, with a sharp increase in net income up to 8 hours worked because of the more generous disregard.
• The individual gets to keep all their earnings for the first three hours worked due to the £20 earnings disregard. Then they experience no increase in net weekly income up to 16 hours due to the 100 per cent taper of IS.
• A sharp increase in net income as the individual becomes entitled to WTC at 16 hours.
• Then a very small (an increase of £1 thereafter for every hour worked) as the various tapers kick in.
90. The household is financially better off under Universal Credit up to 16 hours worked. From 16 to 30 hours worked the individual is better off under the current system, this is primarily due to WTC (where the current system provides step increases in benefit entitlement).
91. Universal Credit withdraws in-work support at a much more predictable rate as MDRs only vary when earnings pass the tax and/or NI thresholds, or when entitlement to Universal Credit is exhausted. However, under the current system the MDR profile is more complicated:
• As the lone parent moves into a few hours of work she or he has the first £20 of her earnings disregarded but then has an MDR of 100% applied until her Income Support is
extinguished16.
• Between 25 and 30 hours a week she or he currently experiences an MDR of above 95% - the combined effect of the interaction of the tax and National Insurance system with Housing Benefit, Council Tax Benefit and tax credit tapers.
92. The PTR is considerably lower under Universal Credit at lower levels of hours and then
increases more smoothly as earnings increase. Due to the more generous earnings disregards under Universal Credit the household gets to keep more of their income as they move into work.
93. Moreover, under Universal Credit there is an opportunity to work much more flexibly, where all hours of work pay not just 16 or 30 hours.
Chart 7: Budget Constraint for a lone parent with two children
£0 £50 £100 £150 £200 £250 £300 £350 £400 £450
0 10 20 30 40 50
Customer hours worked
W
eekl
y N
et
i
n
co
m
e
Current system Universal Credit
16
Second Earners
94. Chart 8 below shows the budget constraint for the second earner, who is part of a couple with no children. The couple is assumed to be paying £80 rent and £15 council tax. The first earner is assumed to be working 35 hours at the national minimum wage (£5.93). The household is better off under Universal Credit up to 22 hours worked. At more than 22 hours worked the household has the same amount of weekly income under both Universal Credit and the current system.
95. Under the current system up to 5 hours worked for the second earner the household is still entitled to HB. Until this point the MDR under Universal Credit is lower (65 per cent) than the current system (80). Once all HB entitlement has been exhausted, the household only receives WTC. The taper applied to WTC under the current system is lower (40 per cent) than the taper rate applied to the remaining element of Universal Credit (65 per cent). From around 23 hours onwards the household is no longer entitled to any means tested state support so the MDR falls and hence net income rises at an increasing pace.
96. The improved ability of the main earner to support his or her family under Universal Credit will enable greater choice for families t