ARTICLE
Racial and Ethnic Disparities in Medical and Dental
Health, Access to Care, and Use of Services in
US Children
Glenn Flores, MDa,b, Sandra C. Tomany-Korman, MSc
aDivision of General Pediatrics, Department of Pediatrics, University of Texas Southwestern Medical Center, Dallas, Texas;bDepartment of Pediatric Medicine, Children’s Medical Center, Dallas, Texas;cSignature Science, LLC, Austin, Texas
The authors have indicated they have no financial relationships relevant to this article to disclose.
ABSTRACT
BACKGROUND.Not enough is known about the national prevalence of racial/ethnic disparities in children’s medical and dental care.
OBJECTIVE.The purpose of this work was to examine racial/ethnic disparities in medical and oral health, access to care, and use of services in a national sample.
METHODS.The National Survey of Children’s Health was a telephone survey in 2003– 2004 of a national random sample of parents and guardians of 102 353 children 0 to 17 years old. Disparities in selected medical and oral health and health care measures were examined for white, African American, Latino, Asian/Pacific Islander, Native American, and multiracial children. Multivariate analyses were performed to adjust for primary language at home, age, insurance coverage, income, parental education and employment, and number of children and adults in the household. Forty measures of medical and oral health status, access to care, and use of services were analyzed.
RESULTS.Many significant disparities were noted; for example, uninsurance rates were 6% for whites, 21% for Latinos, 15% for Native Americans, 7% for African Amer-icans, and 4% for Asians or Pacific Islanders, and the proportions with a usual source of care were as follows: whites, 90%; Native Americans, 61%; Latinos, 68%; African Americans, 77%; and Asians or Pacific Islanders, 87%. Many disparities persisted for
ⱖ1 minority group in multivariate analyses, including increased odds of suboptimal health status, overweight, asthma, activity limitations, behavioral and speech prob-lems, emotional difficulties, uninsurance, suboptimal dental health, no usual source of care, unmet medical and dental needs, transportation barriers to care, problems getting specialty care, no medical or dental visit in the past year, emergency depart-ment visits, not receiving depart-mental health care, and not receiving prescription medi-cations. Certain disparities were particularly marked for specific racial/ethnic groups: for Latinos, suboptimal health status and teeth condition, uninsurance, and problems getting specialty care; for African Americans, asthma, behavior problems, skin aller-gies, speech problems, and unmet prescription needs; for Native Americans, hearing or vision problems, no usual source of care, emergency department visits, and unmet medical and dental needs; and for Asians or Pacific Islanders, problems getting
specialty care and not seeing a doctor in the past year. Multiracial children also experienced many disparities.
CONCLUSIONS.Minority children experience multiple disparities in medical and oral health, access to care, and use of services. Certain disparities are particularly marked for specific racial/ethnic groups, and multiracial children experience many disparities.
www.pediatrics.org/cgi/doi/10.1542/ peds.2007-1243
doi:10.1542/peds.2007-1243
This work was presented in part at the annual meetings of the Pediatric Academic Societies, April 30, 2006, San Francisco, CA; Academy Health, June 26, 2006, Seattle, WA; and American Public Health Association, November 7, 2006, Boston, MA.
Key Words
disparities, minorities, children, race, ethnicity, African Americans, Hispanics, Asians/Pacific Islanders, Native Americans, multiracial
Abbreviations
NSCH—National Survey of Children’s Health
OARO— overweight or at risk for overweight
ED— emergency department ADHD—attention-deficit/hyperactivity disorder
NHANES—National Health and Nutrition Examination Survey
Accepted for publication Jun 18, 2007 Address correspondence to Glenn Flores, MD, Division of General Pediatrics, Department of Pediatrics, University of Texas Southwestern Medical Center, 5323 Harry Hines Blvd, Dallas, TX 75390. E-mail: glenn.flores@utsouthwestern. edu
A
LTHOUGH INCREASING ATTENTION is being paid to racial/ethnic disparities in health and health care, very little of the attention is directed toward children. For example, in a recent report on disparities by the Agency for Healthcare Research and Quality,1 therewere⬎3 times as many disparity measures for adults as there were for children and only 15% of measures were child specific, and in the Institute of Medicine’s compre-hensive health disparities monograph, only 5% of stud-ies addressed disparitstud-ies in children.2There has been no
published comprehensive analysis (to our knowledge) of racial/ethnic disparities in medical and dental health, access to care, and use of services in US children. The study aim, therefore, was to perform such an analysis, using a large, nationally representative database that provides the opportunity to examine child health dispar-ities for all 5 of the major US racial/ethnic groups, as well as multiracial children.
METHODS
Data Source
The data source was the National Survey of Children’s Health (NSCH), a module of the State and Local Area Integrated Telephone Survey conducted by the Centers for Disease Control and Prevention’s National Center for Health Statistics. A detailed description of the design, methods, and operation of the NSCH is provided else-where.3Herein, a brief summary is provided of methods
relevant to this analysis.
The NSCH was designed to produce national and state-specific prevalence estimates for a variety of phys-ical, emotional, and behavioral health indicators and measures of children’s health care experiences.3A
ran-dom-digit-dial sample was selected of households with children under 18 years old from each of the 50 states and the District of Columbia. One child was randomly selected from all of the children in each household as the subject of the survey. The parent or guardian who knew the most about the child’s health and health care served as the survey respondent. NSCH interviews were admin-istered in Spanish and English.
A total of 102 353 NSCH interviews were completed from January 2003 to July 2004. The weighted, overall Council of American Survey Research Organizations re-sponse rate was 55.3%. Estimates based on sampling weights generalize to the noninstitutionalized popula-tion of children napopula-tionwide (including for each racial/ ethnic group, given that the NSCH is a random-digit-dial sample of households with children from each of the 50 states and the District of Columbia).3 The sampling
weights also adjust for households with multiple tele-phone lines and provide multiple adjustments for non-response bias, including for unknown household status and eligibility, households with multiple children, and noncoverage of households without telephones.
Analyses
Data were coded and analyzed by using Stata 8 (Stata Corp, College Station, TX).4 For all of the variables,
responses of “don’t know” or “refused to answer” were set to missing.
Children’s race/ethnicity was classified as white, black/ African American (hereafter referred to as African Ameri-can), Latino or Hispanic (hereafter referred to as Latino), Asian/Pacific Islander, Native American, and multiracial on the basis of parental response. Other demographic vari-ables examined included the child’s age and insurance coverage, the number of children and adults in the house-hold, highest educational attainment in the househouse-hold, household employment status, and combined annual fam-ily income. The child’s insurance coverage was classified as uninsured or publicly or privately insured on the basis of the coverage at the time that the survey was administered. Highest household educational attainment was dichoto-mized as high school graduate or greater versus not a high school graduate. Household employment was coded affir-matively if anyone in the household was employed for
ⱖ50 weeks in the previous year. Household income was defined as below the poverty threshold versus at or above the threshold on the basis of the family size and federal thresholds at the time of the survey.
The following dependent variables with multiple re-sponse categories were transformed into dichotomous variables: child’s health status excellent or very good versus not excellent or very good (eg, good, fair, or poor, consistent with previous research5); child’s BMI
over-weight or at risk for overover-weight (OARO;ⱖ85th percen-tile for age and gender) versus not OARO; teeth condi-tion excellent or very good versus not excellent or very good (eg, good, fair, or poor); ⬎vs ⱕ1 year since last dental visit; child has versus has not seen physician in past year; child did versus did not receive all of the needed medical or dental care (if child received care); the child had no versus ⱖ1 visit to the emergency de-partment (ED) in the past year; the child did versus did not receive preventative dental care in past year; the child was versus was not given prescription in last year; and the child needed but did versus did not receive a prescription in last year.
Variance estimation techniques were used with Stata to adjust for the complex survey design of the NSCH. Pearson’s 2 test statistic was used to test for indepen-dence between race/ethnicity and discrete factors. To account for the complex survey design, the statistic was turned into an F statistic with noninteger degrees of freedom using a second-order Rao and Scott correction. The t statistic from linear regression, with degrees of freedom equal to the total number of primary sampling units minus the total number of strata, was used to identify racial or ethnic disparities in means of continu-ous factors. The tstatistic also was used to test for the significance of factors included in multivariable linear and logistic regression models.
RESULTS
Sociodemographics
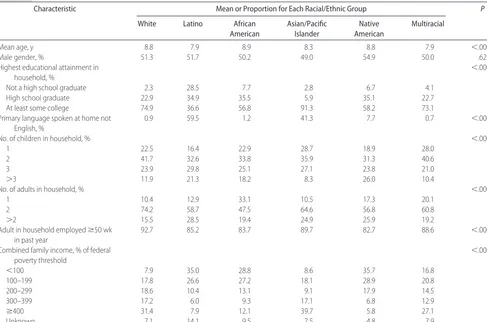
mean age than white children but no significant differ-ences in the proportion of boys. There were substantial differences in the highest educational attainment in the household, with 29% of Latino children’s households with no high school graduate, compared with 8% in African American, 7% in Native American, 4% in mul-tiracial, 3% in Asian/Pacific Islander, and 2% in white children’s households. Conversely, 91% of Asian/Pacific Islander children’s households had a member who has attended at least some college, compared with three fourths of white, 73% of multiracial, 57% of African American, and 37% of Latino children’s households. The primary language spoken at home was far more likely not be English in Latino (60%), Asian/Pacific Is-lander (41%), and Native American (8%) households compared with white (1%) and multiracial (1%) chil-dren’s households.
Native American, Latino, and African American fam-ilies were significantly more likely to have⬎3 children in the household compared with white and multiracial families (Table 1). Approximately one fourth of Latino, Native American, and Asian/Pacific Islander and⬃20% of African American and multiracial families had ⬎2 adults in the children’s household compared with 16% of white households. White children’s households (93%) were most likely to have an adult employed in the household forⱖ50 weeks in the past year, whereas
Native American (83%), African American (84%), and Latino (85%) households were least likely.
The combined annual family income was⬍100% of the federal poverty threshold in more than one third of Native American and Latino children’s households, approxi-mately one third of African American children’s house-holds, and 17% of multiracial families, compared with only 9% of Asian/Pacific Islander and 8% of white children’s households. Conversely, ⬃40% of Asian/Pacific Islander and one third of white children’s households have com-bined family incomes of ⱖ400% of the federal poverty threshold compared with 27% of multiracial, 8% of Latino, and 6% of Native American children’s households.
Medical and Oral Health Status
Approximately 90% of white, Asian/Pacific Islander, multiracial, and Native American children were in ex-cellent or very good health status compared with only 79% of African American and 65% of Latino children (Table 2). Conversely, Latino children (8%) were most likely and Asian/Pacific Islander children least likely (0.3%) to be in poor or fair health. Approximately one third of African American, Native American, and Latino children were overweight compared with 21% to 25% of children in other racial or ethnic groups. Approxi-mately 55% of Native American, 52% of African Amer-ican, and 47% of Latino children were OARO compared TABLE 1 Selected Sociodemographic Features of US Children 0 to 17 Years old (Nⴝ102 353) According to Race/Ethnicity
Characteristic Mean or Proportion for Each Racial/Ethnic Group P
White Latino African
American
Asian/Pacific Islander
Native American
Multiracial
Mean age, y 8.8 7.9 8.9 8.3 8.8 7.9 ⬍.0001
Male gender, % 51.3 51.7 50.2 49.0 54.9 50.0 .62
Highest educational attainment in household, %
⬍.0001
Not a high school graduate 2.3 28.5 7.7 2.8 6.7 4.1
High school graduate 22.9 34.9 35.5 5.9 35.1 22.7
At least some college 74.9 36.6 56.8 91.3 58.2 73.1
Primary language spoken at home not English, %
0.9 59.5 1.2 41.3 7.7 0.7 ⬍.0001
No. of children in household, % ⬍.0001
1 22.5 16.4 22.9 28.7 18.9 28.0
2 41.7 32.6 33.8 35.9 31.3 40.6
3 23.9 29.8 25.1 27.1 23.8 21.0
⬎3 11.9 21.3 18.2 8.3 26.0 10.4
No. of adults in household, % ⬍.0001
1 10.4 12.9 33.1 10.5 17.3 20.1
2 74.2 58.7 47.5 64.6 56.8 60.8
⬎2 15.5 28.5 19.4 24.9 25.9 19.2
Adult in household employedⱖ50 wk in past year
92.7 85.2 83.7 89.7 82.7 88.6 ⬍.0001
Combined family income, % of federal poverty threshold
⬍.0001
⬍100 7.9 35.0 28.8 8.6 35.7 16.8
100–199 17.8 26.6 27.2 18.1 28.9 20.8
200–299 18.6 10.4 13.1 9.1 17.9 14.5
300–399 17.2 6.0 9.3 17.1 6.8 12.9
ⱖ400 31.4 7.9 12.1 39.7 5.8 27.1
Unknown 7.1 14.1 9.5 7.5 4.8 7.9
with 40% of multiracial and only approximately one third of white and Asian/Pacific Islander children.
A need for more medical care than others was highest among Native American and multiracial children and lowest in Asian/Pacific Islander children (Table 2). The prevalence of limited abilities is significantly higher among African American, Native American, and multi-racial children, and special therapy need or receipt was by far the greatest among Native Americans (11%). Ap-proximately one fourth of African American, multira-cial, and Native American children had difficulty with emotions, concentration, behavior, or interpersonal re-lations, significantly higher than the other racial or
eth-nic groups, particularly Asians/Pacific Islanders (10%). The prevalence of emotional developmental or behav-ioral problems needing treatment or counseling, how-ever, differed little among racial/ethnic groups, except for the significantly lower prevalence among Asians/ Pacific Islanders. Learning disabilities were particularly prevalent among Native Americans (13%) but rare among Asians/Pacific Islanders.
Disparities were observed for a variety of specific child-hood conditions (Table 2). Asthma was significantly more prevalent among African American (18%), multiracial (15%), and Native American (14%) children compared with the other racial/ethnic groups (11%–12% preva-TABLE 2 Medical and Oral Health Status of US Children 0 to 17 Years Old (Nⴝ102 353) According to Race/Ethnicity
Health Status Characteristic Mean or Proportion for Each Racial/Ethnic Group P
White Latino African American
Asian/Pacific Islander
Native American
Multiracial
Health status, %a ⬍.0001
Excellent 68.7 41.8 52.4 59.9 55.0 62.5
Very good 22.1 23.5 26.7 28.0 30.8 24.8
Good 7.7 26.5 16.7 11.8 11.0 10.4
Fair 1.3 7.6 3.6 0.3 2.7 2.0
Poor 0.2 0.6 0.7 0.0 0.5 0.3
BMI class, % ⬍.0001
Underweight 7.4 7.5 6.9 12.7 4.2 7.3
Normal 57.4 45.8 41.6 52.2 40.4 52.5
At risk of overweightb 14.7 16.1 14.6 13.0 21.0 15.3
Overweightc 20.6 30.7 36.9 22.0 34.4 24.9
Needs more medical care than others, % 11.9 9.5 11.7 4.5 13.9 13.6 ⬍.0001
Has limited abilities, % 5.1 4.3 8.6 5.3 8.4 7.2 ⬍.0001
Needs/gets special therapy, %d 6.3 5.7 6.9 2.0 11.2 7.2 .0004
Difficulty with emotions, concentration, behavior, or interpersonal relations, %
17.0 15.4 24.6 9.7 21.8 23.9 ⬍.0001
Emotional, developmental, or behavioral problems needing treatment or counseling, %
6.4 6.1 7.7 1.3 6.4 7.7 .0001
Learning disability, % 9.6 9.9 11.0 1.9 12.8 10.9 .0001
Asthma, % 11.5 11.0 18.2 11.9 14.2 15.1 .0001
Hearing or vision problems, % 2.9 3.0 1.9 2.0 5.8 2.9 .15
ADHD, % 8.0 3.3 7.2 1.8 7.1 8.5 .0001
Depression or anxiety, % 4.7 3.6 3.2 0.7 5.5 5.5 .0001
Behavior problems, % 4.9 4.8 8.2 0.6 4.5 6.9 .0001
Bone, joint, or muscle problems, % 3.4 2.5 3.3 0.7 2.7 4.1 .0001
Diabetes, % 0.4 0.2 0.2 0.1 1.0 0.3 .04
Developmental delay, % 4.0 2.0 3.2 0.7 4.6 4.7 .0001
Allergies, %
Respiratory 16.5 9.8 15.6 10.6 14.7 18.1 .0001
Digestive 3.6 3.2 3.7 3.6 3.2 5.9 .01
Skin 9.2 7.5 14.6 8.9 12.0 14.3 .0001
Headaches, % 5.4 5.4 7.2 2.7 8.7 6.5 .03
Speech problems, % 3.2 3.5 5.1 2.1 5.3 4.2 .0002
ⱖ3 ear infections in last 12 mo, % 5.0 5.1 4.1 1.8 5.2 5.6 .10
Teeth condition, %a ⬍.0001
Excellent 49.4 26.9 34.4 33.6 36.0 43.8
Very good 27.1 20.5 26.8 34.8 30.6 26.2
Good 17.6 31.4 27.7 23.3 22.3 20.9
Fair 4.6 16.6 8.8 5.9 7.5 7.5
Poor 1.3 4.6 2.4 2.5 3.6 1.7
aData are by parental report. bBMI is 85% to 94% for age and gender. cBMI isⱖ95% for age and gender.
dData include physical, occupational, or speech therapy.
lence). Native American children had a significantly higher prevalence of hearing or vision problems and diabetes. Rates of attention-deficit/hyperactivity disorder (ADHD) and respiratory allergies differed little among racial/ethnic groups, except for significantly lower rates among Latino and Asian/Pacific Islander children. Rates of depression or anxiety; bone, joint, or muscle problems; and developmen-tal delay were approximately equivalent, except for a sig-nificantly lower prevalence for all 3 of the conditions among Asians/Pacific Islanders. Behavior problems were especially prevalent in African American (8%) and multi-racial (7%) children and rare (0.6%) among Asians/ Pacific Islanders. Digestive allergies occurred somewhat more fre-quently among multiracial children, and skin allergy prev-alence was significantly higher among African American, multiracial, and Native American children. Headaches oc-curred more often among African Americans and less often among Asians/Pacific Islanders, and prevalence of speech problems was somewhat greater among Native Americans and African Americans. No significant racial or ethnic dif-ferences were seen in the rates of ear infections.
Approximately three fourths of white, Asian/Pacific Islander, and multiracial children’s teeth were in excel-lent or very good condition compared with only approx-imately two thirds of African American and Native American children and about half of the Latino children (Table 2). Poor or fair teeth condition was greatest in
Latino children (21%), with high rates (11%) also seen in African American and Native American children.
Access to Medical and Dental Care
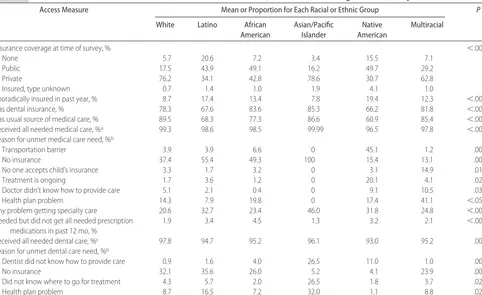
Latino (21%) and Native American (16%) children were significantly more likely to be uninsured than African American (7%), multiracial (7%), white (6%), and Asian/Pacific Islander (3%) children (Table 3). Public insurance coverage rates were greatest among Native American, African American, and Latino children, and private insurance coverage rates were significantly higher in Asian/Pacific Islander (79%), white (76%), and multiracial (63%) children. Sporadic insurance cov-erage reached double digits among Native American, Latino, African American, and multiracial children. Na-tive American and Latino children were least likely to have dental insurance, with approximately two thirds of each group having dental coverage, compared with 78% to 85% coverage rates in other racial/ethnic groups.
Although close to 90% of white, Asian/Pacific Is-lander, and multiracial children had a regular source of medical care, only 61% of Native American and 68% of Latino children had a regular source of medical care (Table 3).
Native American, African American, and Latino chil-dren were less likely than Asian/Pacific Islander and white children to have all of their medical care needs TABLE 3 Access to Medical and Dental Care for US Children 0 to 17 Years Old (Nⴝ102 353) According to Race/Ethnicity
Access Measure Mean or Proportion for Each Racial or Ethnic Group P
White Latino African
American
Asian/Pacific Islander
Native American
Multiracial
Insurance coverage at time of survey, % ⬍.0001
None 5.7 20.6 7.2 3.4 15.5 7.1
Public 17.5 43.9 49.1 16.2 49.7 29.2
Private 76.2 34.1 42.8 78.6 30.7 62.8
Insured, type unknown 0.7 1.4 1.0 1.9 4.1 1.0
Sporadically insured in past year, % 8.7 17.4 13.4 7.8 19.4 12.3 ⬍.0001
Has dental insurance, % 78.3 67.6 83.6 85.3 66.2 81.8 ⬍.0001
Has usual source of medical care, % 89.5 68.3 77.3 86.6 60.9 85.4 ⬍.0001
Received all needed medical care, %a 99.3 98.6 98.5 99.99 96.5 97.8 ⬍.0001
Reason for unmet medical care need, %b
Transportation barrier 3.9 3.9 6.6 0 45.1 1.2 .0001
No insurance 37.4 55.4 49.3 100 15.4 13.1 .003
No one accepts child’s insurance 3.3 1.7 3.2 0 3.1 14.9 .01
Treatment is ongoing 1.7 3.6 1.2 0 20.1 4.1 .02
Doctor didn’t know how to provide care 5.1 2.1 0.4 0 9.1 10.5 .03
Health plan problem 14.3 7.9 19.8 0 17.4 41.1 ⬍.05
Any problem getting specialty care 20.6 32.7 23.4 46.0 31.8 24.8 ⬍.0001
Needed but did not get all needed prescription medications in past 12 mo, %
1.9 3.4 4.5 1.3 3.2 2.1 ⬍.0001
Received all needed dental care, %c 97.8 94.7 95.2 96.1 93.0 95.2 .0001
Reason for unmet dental care need, %b
Dentist did not know how to provide care 0.9 1.6 4.0 26.5 11.0 1.0 .0001
No insurance 32.1 35.6 26.0 5.2 4.1 23.9 .002
Did not know where to go for treatment 4.3 5.7 2.0 26.5 1.8 3.7 .02
Health plan problem 8.7 16.5 7.2 32.0 1.1 8.8 .02
aData are only if made a physician visit in past 12 months.
bData are only access barriers with significant racial or ethnic disparities; see text for other barriers. cData are only if patient made a dental visit in past 12 months.
met (Table 3). Transportation barriers are significantly more often responsible for unmet medical care needs among Native American children, at 45%. Lack of in-surance was a reason for unmet medical need for ap-proximately half of Latino and African American chil-dren and 100% of Asian/Pacific Islander chilchil-dren. Lack of acceptance of the child’s insurance was a frequent reason for the unmet medical care need for multiracial children (15%), whereas the ongoing nature of the treatment was cited by 20% of Native Americans. Ap-proximately 10% of both multiracial and Native Amer-ican parents cited the doctor not knowing how to pro-vide care as a reason for unmet need, whereas health plan problems were cited by⬎40% of parents of multi-racial children and 14% to 20% of African American, Native American, and white children.
Asian/Pacific Islander children were most likely to en-counter any problem getting specialty care, at⬃50%. Ap-proximately one third of Latino and Native American chil-dren also encountered problems getting specialty care compared with approximately one fourth of multiracial, 23% of African American, and 20% of white children (Table 3). African American children (5%) were slightly more likely to have not obtained all of their needed pre-scription medications in the past year, whereas Asian/ Pacific Islander children (1%) were least likely to have unmet prescription needs.
Nonwhite racial/ethnic groups of children had greater unmet dental care needs than white children, with Na-tive Americans (7%) at particularly high risk (Table 3). More than one fourth of Asian/Pacific Islander children’s parents attributed their unmet dental care need to their dentist not knowing how to provide care; Native Amer-ican parents (11%) also frequently cited this reason. Lack of dental insurance coverage was cited as a reason for unmet pediatric dental needs by all of the groups
except for Asians/Pacific Islanders and Native Ameri-cans. Asian/Pacific Islander children had unmet dental needs substantially more often because of parents not knowing where to go for treatment, at 27%. Dental health plan problems were a reason for unmet dental needs most often for Asian/Pacific Islander (32%) and Latino (17%) children.
Use of Medical and Dental Care and Prescription Medications Almost one third of Native American, Asian/Pacific Is-lander, and Latino children had made no physician visit in the past year compared with only⬃20% to 21% for other racial/ethnic groups (Table 4). Somewhat greater proportions of Native American (5%) and African Amer-ican (4%) children made ⱖ3 ED visits in the past year compared with other racial/ethnic groups (2%–3%). Mental health care in the past year was most often received by multiracial children and least often by Asian/ Pacific Islander children.
Latino (18%) and multiracial (16%) children had the highest risk of never having seen a dentist. Among chil-dren who had seen a dentist, Native Americans (15%) were most likely to have made no preventive dental visit in the past year; a high proportion of Latinos (12%) and African Americans (11%) also made no preventive den-tal visit in the past year, compared with only 5% to 7% among the other racial/ethnic groups.
Prescription medication use and need was most com-mon acom-mong multiracial (25%), African American (22%), and white (22%) children compared with other racial/ethnic groups (14%–17%; Table 4). For most racial/ethnic groups, approximately half of the children used a prescription medication in the past year in con-trast to only approximately one third of Asian/Pacific Islander and African American children. A slightly higher risk of not using but needing a prescription med-TABLE 4 Use of Medical Care, Dental Care, and Prescription Medications Among US Children 0 to 17 Years Old (Nⴝ102 353) According to
Race/Ethnicity
Use of Service Measure Mean or Proportion for Each Racial or Ethnic Group P
White Latino African
American
Asian/Pacific Islander
Native American
Multiracial
No physician visit in last 12 mo, % 20.7 27.9 19.5 29.2 29.5 20.3 ⬍.0001
No. of ED visits in last year, % ⬍.0001
0 82.2 82.0 77.3 85.0 73.5 78.3
1–2 15.8 15.4 18.8 13.4 21.6 19.0
ⱖ3 2.0 2.6 3.9 1.6 4.9 2.8
Received mental health care in past 12 mo, %a
7.6 5.3 5.9 1.3 6.3 9.2 ⬍.0001
Never seen dentist, % 13.1 17.8 12.3 11.8 14.4 16.0 ⬍.0001
No routine preventive dental visit in last 12 mo, %ab
4.8 11.8 11.3 6.8 15.0 6.7 ⬍.0001
Needs/uses prescription medication, % 21.8 14.3 22.3 16.3 16.9 25.0 ⬍.0001
Used prescription medication in past 12 mo, %
⬍.0001
Yes 53.0 44.8 37.7 35.5 43.5 46.7
No, did not need 45.1 51.7 57.8 63.2 53.3 51.2
No, but needed 1.9 3.4 4.5 1.3 3.2 2.1
aData are only for children⬎12 months old.
bData are only among those who have ever made a dental visit.
ication in the past 12 months was seen for African Amer-ican, Latino, and Native American children.
Multivariable Analyses
Medical and Oral Health Status
Compared with white children, Latino, African Ameri-can, and multiracial children had significantly greater adjusted odds of their health status and teeth condition both not being excellent or very good (Table 5). Native American and African American children had double the odds and Latino children 1.4 times the odds of white children of being OARO. African American and Asian/ Pacific Islander children were less likely than whites to need more medical care than others, whereas multiracial and African American children were more likely than white children to have limited abilities and difficulty with emotions, concentration, behavior, or interper-sonal relations. Native Americans had double the odds of white children of needing or getting special therapy, whereas Asian/Pacific Islander children were one third less likely. Compared with whites, African Americans and Asian/Pacific Islanders had lower odds of emotional, developmental, or behavioral problems needing treat-ment or counseling, and Asian/Pacific Islander children had lower odds of a learning disability.
African American, multiracial, and Latino children had significantly greater odds of having asthma than white
children (Table 5). Native Americans had almost double the odds of whites of having hearing or vision problems, whereas African Americans had a lower likelihood. Com-pared with white children, Asian/Pacific Islander, African American, and Latino children had lower odds of ADHD, and Asian/Pacific Islander and African American children had lower odds of depression or anxiety. African Ameri-cans had a greater odds and Asian/Pacific Islanders and Native Americans lower odds of behavior problems versus whites. Lower odds of bone, joint, or muscle problems occurred in Asians/Pacific Islanders, and lower odds of developmental delay occurred in Asians/Pacific Islanders and African Americans. African American children had a significantly lower odds of diabetes mellitus, whereas Na-tive Americans had a nonsignificant trend of almost triple the odds of diabetes mellitus compared with whites. Diges-tive allergies were significantly more likely in multiracial versus white children, and skin allergies occurred more frequently in African Americans and multiracial children. There were greater odds of speech problems in African American versus white children but lower odds of frequent ear infections for both African Americans and Latinos.
Access to Medical and Dental Care
Compared with white children, Native American chil-dren had 2.4 times the odds, Latin chilchil-dren had 1.5 times the odds, and multiracial children had 1.3 times the odds TABLE 5 Multivariable Analyses of Racial/Ethnic Disparities in Medical and Oral Health Status Among US Children 0 to 17 Years Old
(Nⴝ102 353)
Measure Odds Ratio (95% Confidence Interval) vs White Children
Latino African
American
Asian/Pacific Islander
Native American
Multiracial
Health not excellent or very good 1.84 (1.62–2.10) 1.93 (1.74–2.14) NS NS 1.32 (1.10–2.10) Teeth condition not excellent or very good 1.65 (1.48–1.83) 1.65 (1.52–1.79) NS NS 1.39 (1.20–1.61)
OARO 1.38 (1.24–1.54) 1.86 (1.71–2.02) NS 2.25 (1.75–2.89) NS
Needs more medical care than others NS 0.81 (0.72–0.91) 0.45 (0.22–0.92) NS NS
Has limited abilities NS 1.29 (1.13–1.48) NS NS 1.34 (1.03–1.74)
Needs or gets special therapya NS NS 0.35 (0.15–0.82) 1.67 (1.15–2.44) NS
Difficulty with emotions, concentration, behavior, or interpersonal relations
NS 1.27 (1.15–1.40) NS NS 1.45 (1.22–1.71)
Emotional, developmental, or behavioral problems needing treatment or counseling
NS 0.850 (0.730–0.999) 0.25 (0.11–0.55) NS NS
Learning disability NS NS 0.24 (0.12–0.47) NS NS
Asthmatic 1.34 (1.16–1.54) 1.61 (1.45–1.78) NS NS 1.38 (1.17–1.62)
Hearing or vision problems NS 0.55 (0.42–0.71) NS 1.70 (1.06–2.74) NS
ADHD 0.73 (0.58–0.91) 0.71 (0.61–0.83) 0.36 (0.12–1.09) NS NS
Depression or anxiety NS 0.49 (0.39–0.61) 0.20 (0.05–0.70) NS NS
Behavior problems NS 1.20 (1.01–1.42) 0.18 (0.06–0.50) 0.64 (0.41–0.99) NS
Bone, joint, or muscle problems NS NS 0.28 (0.12–0.64) NS NS
Diabetes NS 0.55 (0.33–0.91) NS 2.61 (0.86–7.88)b NS
Developmental delay NS 0.67 (0.55–0.83) 0.22 (0.10–0.46) NS NS
Digestive allergies NS NS NS NS 1.57 (1.20–2.06)
Skin allergies NS 1.82 (1.64–2.02) NS NS 1.59 (1.34–1.90)
Speech problems NS 1.34 (1.09–1.64) NS NS NS
ⱖ3 ear infections in last 12 mo 0.74 (0.57–0.95) 0.67 (0.55–0.82) NS NS NS
Multivariate analyses were adjusted for primary language spoken at home, child’s age and insurance coverage, caregiver’s educational attainment and employment status, number of children in the household, number of adults in the household, and poverty level. NS indicates not significant.
aPhysical, occupational, or speech therapy. bNonsignificant trend, withP⫽.09.
of being uninsured, whereas Asian/Pacific Islander chil-dren were less likely to be uninsured (Table 6). All of the nonwhite racial/ethnic groups, except for Asians/Pacific Islanders, also were more likely to have had sporadic insurance coverage in the past year. Native Americans had almost double the odds of whites of lacking dental insurance, whereas Asians/Pacific Islanders, African Americans, and multiracial children were less likely to lack dental insurance.
Compared with white children, Native Americans had 4 times the odds, African Americans and Latinos approximately double the odds, and multiracial children 1.4 times the odds of having no usual source of medical care (Table 6). Native Americans and multiracial chil-dren had approximately triple the odds of whites of not receiving all of their needed medical care, whereas Asians/Pacific Islanders had substantially lower odds of unmet medical care need. Multiracial children had ⬃6 times the odds of unmet medical care need because of health plan problems and no one accepting the child’s insurance. For other barriers resulting in unmet medical needs, Latino parents were less likely to cite no one accepting the child’s insurance, multiracial children’s
parents were less likely to cite no insurance, and African American parents were less likely to cite cost. Native Americans had a 20 times greater odds of transportation problems as the cause of unmet medical needs, and parents of Latino and Native American children were more likely to report ongoing treatment as a reason for unmet medical needs.
Both Asian/Pacific Islander and Latino children were significantly more likely than white children to have a problem getting specialty care (Table 6). Both African American and Latino children had approximately double the odds of whites of needing but not getting all of their needed prescription medications in the past year.
Multiracial, Native American, and African American children had double the odds of white children of not receiving all of their needed dental care (Table 6). Trans-portation problems were substantially more likely to be the reason for unmet dental care needs among Asians/ Pacific Islanders and Native Americans. Asians/Pacific Islanders had 15 times the odds, Native Americans had 10 times the odds, and African Americans had⬃5 times the odds of whites of unmet dental needs because of parental reports that the dentist did not know how to TABLE 6 Multivariable Analyses of Racial/Ethnic Disparities in Access to Medical and Dental Care Among US Children 0 to 17 Years Old
(Nⴝ102 353)
Measure Odds Ratio (95% Confidence Interval) vs White Children
Latino African
American
Asian/Pacific Islander
Native American Multiracial
No health insurancea 1.46 (1.25–1.70) NS 0.38 (0.18–0.80) 2.41 (1.75–3.32) 1.31 (1.01–1.69) Sporadically insured in past yeara 1.35 (1.17–1.57) 1.41 (1.26–1.60) NS 2.15 (1.62–2.85) 1.42 (1.18–1.70) No dental insurancea NS 0.67 (0.61–0.74) 0.42 (0.26–0.67) 1.62 (1.28–2.05) 0.78 (0.66–0.93) No usual source of medical care 1.77 (1.56–2.00) 1.99 (1.81–2.20) NS 3.96 (3.05–5.14) 1.37 (1.14–1.65) Did not receive all needed medical careb NS NS 0.030 (0.004–0.200) 2.99 (1.11–8.03) 2.83 (1.78–4.51) Reason for unmet medical care need
Health plan problem NS NS NE NS 5.91 (2.39–14.6)
No one accepts child’s insurance 0.27 (0.10–0.76) NS NE NS 6.26 (1.77–22.2)
No insurance NS NS NE NS 0.21 (0.08–0.51)
Cost NS 0.36 (0.16–0.82) NS NS NS
Transportation NS NS NE 20.40 (2.51–165.50) NS
Treatment is ongoing 6.08 (1.36–27.1) NS NE 20.70 (2.44–174.60) NS
Any problem getting specialty care 1.36 (1.07–1.72) NS 2.98 (1.35–6.56) NS NS
Needed but did not get all needed prescription medications in past 12 mo
1.66 (1.25–2.22) 1.96 (1.51–1.55) NS NS NS
Did not receive all needed dental carec NS 2.10 (1.63–2.70) NS 2.21 (1.09–4.45) 2.42 (1.56–3.75) Reason for unmet dental care needc
Transportation NS NS 16.70 (1.82–152.60) 5.10 (1.55–16.7) NS
Dentist did not know how to provide care NS 4.51 (1.67–12.2) 14.90 (2.44–90.80) 10.3 (1.40–94.0) NS
No one accepts child’s insurance NS NS 11.00 (1.63–74.10) NS NS
Inconvenient times or could not get an appointment
NS NS NS 5.43 (2.05–14.40) NS
No dental insurance NS NS 0.06 (0.01–0.42) 0.06 (0.02–0.19) NS
Cost NS 0.60 (0.41–0.90) NS 0.12 (0.04–0.35) NS
Treatment is ongoing NS NS NE 5.33 (1.46–19.50) NS
Multivariate analyses were, except as noted below, adjusted for primary language spoken at home, child’s age and health insurance coverage, caregiver’s educational attainment and employment status, number of children in the household, number of adults in the household, and poverty level. NS indicates not statistically significant; NE, not estimable, because of small sample size.
aAdjusted for primary language spoken at home, child’s age, caregiver’s educational attainment and employment status, number of children in the household, number of adults in the household,
and poverty level.
bOnly if child made a physician visit in past 12 months.
cOnly for those making a dental visit in past 12 months; adjusted for primary language spoken at home, child’s age and dental insurance coverage, caregiver’s educational attainment and
provide care. Unmet dental needs were significantly more likely because of no one accepting the child’s den-tal insurance among Asians/Pacific Islanders and incon-venient appointment times or inability to get an appoint-ment among Native Americans. Unmet dental needs because of no dental insurance were less likely in Asians/Pacific Islanders and Native Americans and be-cause of cost were less likely for Native Americans and African Americans. Native Americans were more likely than whites to cite ongoing treatment as a reason for unmet dental needs.
Use of Medical Care, Dental Care, and Prescription Medications
All 5 of the nonwhite racial/ethnic groups of children were significantly more likely than white children to have made no physician visit in the past year (Table 7). Both Native Americans and African Americans were more likely to have madeⱖ1 ED visit in the past year. Asian/Pacific Islander and African American children had greater odds of white children of having received no mental health care in the past year.
African American, multiracial, and Native American children had significantly greater odds than white chil-dren of having had no preventive dental visit in the past year (Table 7). Multiracial children were more likely and Native Americans less likely than white children to need or use a prescription medication, whereas all of the nonwhite groups of children were significantly more likely than white children to have not been given a prescription medication in the past year.
DISCUSSION
Disparities for Nonwhite Racial/Ethnic Groups
The study findings document that racial/ethnic minority children in the United States experience multiple dispari-ties in medical and oral health, access to care, and use of services. Compared with white children, all 5 of the mi-nority groups were significantly less likely (after adjust-ment) to have had a physician visit and to have been given a prescription medication in the past year. Compared with white children, at least 3 minority groups had significantly greater adjusted odds of suboptimal health status and
con-dition of the teeth, being OARO, asthma, no health insur-ance, sporadic health insurance in the past year, no usual source of medical care, unmet dental care needs, and no routine preventive dental visit in the past year.
These data indicate that minority children in America often face a “triple threat” of greater risks of suboptimal medical and oral health status, impaired access to medical and dental care, and lower receipt of prescription medica-tions and essential medical and dental services. The reduc-tion and eliminareduc-tion of such disparities, therefore, may require innovative, comprehensive approaches and con-ceptual frameworks, including considering the family and community milieu of the child,6 carefully disaggregating
socioeconomic status and race/ethnicity,7consideration of
disparities as a quality issue,8and understanding the
inter-play of both underlying risk status and differential access to effective interventions.9
Disparities for Latino Children
Certain disparities are particularly marked for specific minority groups, and appreciation of these noteworthy disparities may be useful for clinicians, health systems, and policy makers addressing the needs of diverse pop-ulations. More than one third of Latino children had suboptimal (not excellent or very good) health status, and more than one half had suboptimal condition of the teeth, the highest proportions of any group, and Latino children had approximately double the adjusted odds of white children of suboptimal health status and teeth condition. As has been documented in several other studies over 3 decades,10–14Latino children had the
high-est prevalence of being uninsured, at 21%, and double the adjusted odds of uninsurance compared with white children. Approximately one third of Latino children had no usual source of medical care and one-third en-countered a problem getting specialty care, and Latino children had significantly greater adjusted odds than white children of no usual source of medical care, not getting all of their needed prescription medications, and having problems getting specialty care.
Disparities for African American Children
African American children experienced the greatest number of disparities of any racial or ethnic group in TABLE 7 Multivariable Analyses of Racial/Ethnic Disparities in Use of Medical Care, Dental Care, and Prescription Medications Among US
Children 0 to 17 Years Old (Nⴝ102 353)
Measure Odds Ratio (95% Confidence Interval) vs White Children
Latino African
American
Asian/Pacific Islander
Native American
Multiracial
No physician visit in past 12 mo 1.18 (1.02–1.36) 1.30 (1.17–1.45) 2.62 (1.76–3.90) 1.59 (1.21–2.08) 1.26 (1.02–1.55)
One more ED visits in past 12 mo NS 1.19 (1.09–1.30) NS 1.57 (1.21–2.02) NS
Received no mental health care in past 12 mo NS 1.74 (1.47–2.06) 5.11 (2.31–11.3) NS NS No routine preventive dental visit in past 12 mo NS 1.43 (1.28–1.60) NS 1.36 (1.00–1.85) 1.41 (1.19–1.68)
Needs or uses prescription medication NS NS NS 0.76 (0.57–1.01) 1.20 (1.03–1.38)
Not given prescription medication in past 12 mo 1.31 (1.18–1.46) 1.79 (1.64–1.95) 2.32 (1.65–3.25) 1.33 (1.04–1.71) 1.37 (1.19–1.57)
Multivariate analyses were adjusted for primary language spoken at home, child’s age and health insurance coverage (or dental insurance coverage, in the case of preventive dental visits), caregiver’s educational attainment and employment status, number of children in the household, number of adults in the household, and poverty level. NS indicates not statistically significant; NE, not estimable, because of small sample size.
medical and oral health status, with significantly greater adjusted odds than white children for 8 measures. Afri-can AmeriAfri-can children had approximately double the odds of white children of suboptimal health status and teeth condition. More than half of African American children were OARO, and they had approximately dou-ble the adjusted odds of whites of OARO. African Amer-ican children had the highest prevalence of limited abil-ities (9%) and difficulty with emotions, concentration, behavior, or interpersonal relations (25%), disparities that persist after adjustment. Consistent with other re-cent national data,15African American children had the
highest asthma prevalence of any racial or ethnic group, although the magnitude (18%) in this study exceeded that of previous work; after adjustment, African Amer-icans still had double the odds of asthma versus whites. African American children also had a particular high prevalence and greater adjusted odds of skin allergies and speech problems. For access to medical and dental care, African American children had significantly greater adjusted odds than white children of sporadic insurance, no usual source of medical care, unmet prescription medication need, unmet dental need, and dentists not knowing how to provide care as the reason for unmet dental need. Similar to previous research, African Amer-icans were found to have greater odds ofⱖ1 ED visit, no routine preventive dental visit, and not receiving a pre-scription medication in the past year.14,16,17
Disparities for Asian/Pacific Islander Children
Asian/Pacific Islander children experienced significantly better medical and oral health status than white children for 8 indicators, including substantially lower adjusted risks of limited abilities; needing or getting special ther-apy; emotional, developmental, or behavioral problems needing treatment or counseling; learning disabilities; ADHD; depression or anxiety; behavior problems; bone, joint, or muscle problems; and developmental delay. The magnitude of these lower risks ranged from 2 to as much as 5 times lower odds compared with white children. This is the first report (to our knowledge) to support such consistently and substantially lower risks for Asian/ Pacific Islander children. The data do not permit deter-mination of whether these findings might at least in part reflect reduced access to care, resulting in a lower like-lihood of physician-diagnosed conditions, functional limitations, and treatment. Of note, Asian/Pacific Is-lander children had significantly lower adjusted risks than white children of lacking medical or dental insur-ance and having unmet medical care needs.
In contrast, among those needing specialty care, ap-proximately half of Asians/Pacific Islanders experienced problems getting specialty care (the highest prevalence for any group), and they had the highest adjusted risk of problems getting specialty care, at triple the odds of white children. Asian/Pacific Islander children also ex-perienced substantially higher adjusted odds of unmet dental care need because of transportation problems, the dentist not knowing how to provide care, and no one accepting the child’s insurance, with odds that range from 11 to 17 times greater than for white children. In
addition, Asian/Pacific Islander children had the highest adjusted odds of having made no physician visit, receiv-ing no mental health care, and receivreceiv-ing no prescription medication in the past year.
Consistent with these findings, previous work re-ported Asian/Pacific Islander children’s disparities for no contact with a physician in the past year and no medication receipt in the past 3 months (for certain subgroups).18 However, this is the first published study
(to our knowledge) to report that Asian/Pacific Islander children experience a unique constellation of better medical and oral health, better health and dental insur-ance coverage, and fewer unmet medical needs but sub-stantially higher odds of problems obtaining specialty care, selected barriers causing unmet dental needs, fewer physician visits, no mental health care, and lower receipt of prescription medications in the past year.
Disparities for Native American Children
Native American children were at particularly high risk for OARO, with the highest prevalence (55%) and great-est adjusted odds (more than double) versus white chil-dren. The prevalence of diabetes mellitus among Native American children (1%) was the highest for any racial or ethnic group, exceeding the prevalence of this disease in other racial/ethnic groups of children by 2 to 10 times. One in 9 Native American children needed or got special therapy, by far the highest prevalence, and Native Amer-icans had approximately twice the adjusted odds of whites of needing or getting special therapy. Native American children also had an especially high preva-lence of hearing or vision problems, which, at 6%, is double to triple the prevalence among other racial or ethnic groups, and Native Americans had approximately double the adjusted odds of whites of having hearing or vision problems.
Native American children had the worst access to medical and dental care, both in terms of the sheer number of disparities (a total of 6) and the magnitude. Native Americans had the highest adjusted odds of any racial or ethnic group of children of lacking health and dental insurance and being sporadically insured, at ap-proximately double the odds of white children for all 3 of the outcomes. Native Americans had substantially greater adjusted odds than whites of no usual source of medical care, at quadruple the odds, of unmet medical care needs, at triple the odds, and of unmet dental care, at double the odds. Transportation problems were a substantial reason for unmet medical and dental needs, and other important reasons for unmet dental needs included the dentist not knowing how to provide care and inconvenient appointment times or not being able to get appointments.
Native American children had the highest adjusted odds ofⱖ1 ED visit in the past year, at double the odds of white children. Previous research on ED use in chil-dren could not report ED use rates for Native American children because of small sample sizes,14,19,20so the
no physician visit and no routine preventive dental visit in the past year were significantly higher for Native Americans. The study findings complement previous re-search documenting poor condition of the teeth in Na-tive American children21and disparities in leading health
indicators among Native American adolescents.22
Disparities for Multiracial Children
Very little has been published on disparities for multira-cial children,16most likely because of insufficient sample
sizes for this group in most national databases. Multira-cial children experienced multiple disparities in medical and oral health status. They had significantly higher adjusted odds than white children of suboptimal health status and teeth condition and the highest odds of lim-ited abilities, digestive allergies, and difficulties with emotions, concentration, behavior, or interpersonal re-lations. Multiracial children had 1.4 times the adjusted odds of asthma versus white children, and the preva-lence of asthma among multiracial children, at 15%, was second only to African Americans. Multiracial children had significantly greater adjusted odds of digestive dis-eases than any other group, and they had significantly higher odds of asthma and skin allergies, at levels ex-ceeded only by African American children.
Multiracial children had significantly higher adjusted odds versus white children of being uninsured and spo-radically insured and had the highest odds of unmet dental care needs. They also had approximately triple the adjusted odds of whites of unmet medical needs and 6 times the odds of health plan problems and no one accepting the child’s insurance as the reasons for unmet medical needs, distinguishing multiracial children as the only minority group experiencing higher risks for these reasons. Multiracial children also had the highest risk of unmet dental care needs, at more than double the ad-justed odds of whites. The also had significantly greater odds than whites of no routine preventive dental visit in the past 12 months, need or use of prescription medica-tion, and not being given a prescription medication in the past 12 months.
This is the first study (to our knowledge) to report health and health care disparities for multiracial children using nationwide data. A recent study of children with special health care needs23 found high unmet need for
vision care among multiracial children, consistent with our findings of high unmet medical and dental care needs for the general population of multiracial children.
Disparities in Overweight
Consistent with recent national data,24,25the study
find-ings document a high prevalence of OARO among US children, ranging from more than one third to more than one half of children, depending on the racial or ethnic group. Previous analyses, however, did not have adequate sample sizes to assess overweight and OARO among Asian/Pacific Islander, Native American, and multiracial children or among Latino children as a whole (ie, other than Mexican American children), so the cur-rent study eliminates key knowledge gaps. The study
findings reveal that Native American children have the highest prevalence of OARO, at 55%. Although nation-ally representative data on overweight among Native American children have not been available previously, these findings are consistent with high levels of OARO reported for individual tribes, Native American popula-tions in specific regions, and multiple tribes across the country.26–30NSCH data also revealed a high prevalence
of OARO among Asian/Pacific Islander children, at 35%, equivalent to the prevalence in white children. These are the first published national rates (to our knowledge) for Asian/Pacific Islander children; the only comparable data come from a study of young children in Hawaii, which found no difference in overweight risk in Asian versus white children, but significantly higher adjusted odds of overweight for Samoan children.31 Multiracial
children were also found to have a high prevalence of OARO, at 40%; no other published studies have exam-ined OARO among multiracial children. Caution should be exercised in interpreting NSCH BMI data, however, because these data are based on parentally reported height and weight, rather than actual measurements.
Consistent with previous work,24,25high OARO
prev-alence rates were found for African American (52%), Latino (47%), and white (35%) children. These NSCH rates are higher than those reported in analyses of the 1999 –2002 National Health and Nutrition Examination Survey (NHANES) for African American (35%), Mexi-can AmeriMexi-can (40%), and white (28%) children, which may be because of several factors: (1) weight and height in the NSCH were derived from parental reports, whereas weight and height were directly measured in NHANES subjects; (2) the NSCH analyses were based on children 0 to 17 years old, whereas NHANES analyses examined children 6 to 19 years old; and (3) the NSCH data (2003–2004) are somewhat more recent than the NHANES data (1999 –2002).
Importance of Inclusion of All of the Major Racial/Ethnic Groups and Multiracial Children
The study findings document the importance of includ-ing all of the major racial/ethnic groups and multiracial children in analyses of racial/ethnic disparities in the health and health care of children. Many studies of racial/ethnic disparities are limited to comparisons of whites, African Americans, and Latinos or even just whites and African Americans. In this study, omission of Native American, Asian/Pacific Islander, and multiracial children would have resulted in many unique disparities being missed and several of the highest prevalence rates being ignored for multiple health, dental, access, and use-of-services outcomes. These results suggest that spe-cial efforts should be made to collect and analyze data for all of the racial/ethnic groups and multiracial children, particularly when a comprehensive, accurate assessment of disparities is required.
Study Limitations
subcategories known to be important in identifying health care disparities,5,18,32,33 so important subgroup differences
and the heterogeneity of individual racial/ethnic groups could not be examined in additional detail. The children’s conditions were identified by parental report, not direct physician diagnosis, so the prevalence of conditions could be overestimated or underestimated, and there could have been racial/ethnic variation in parental perception and as-sessment. NSCH data were collected only on the primary language spoken at home and not parental limited English proficiency, although the latter language measure has been shown to be more useful when examining health status, access to care, and use of services.34NSCH interviews were
conducted only in English and Spanish3; it is unclear how
many households had to be excluded because the parent or guardian did not have adequate proficiency in English or Spanish. NSCH data also were not available on the immi-gration status of children or parents.
Study Strengths
A main strength of this study was that analyses were performed for all 5 of the major US racial/ethnic groups. In addition, disparities also could be examined for mul-tiracial children. Additional strengths included the large, nationally representative sample of ⬎102 000 children and the comprehensive set of outcomes in the NSCH that encompassed medical and oral health, access to care, and use of services.
Practice and Policy Implications
The study findings suggest several important action steps that may prove useful in the reduction and elimination of racial/ethnic disparities in children. Previously unre-ported and substantial disparities in Native American, Asian/Pacific Islander, and multiracial children indicate the need for more comprehensive data collection, anal-yses, and monitoring on disparities in all of the major racial/ethnic groups and multiracial children. Stark dis-parities in nonfinancial barriers to care, sporadic insur-ance, and lack of health insurance suggest an urgent need for improvements in access to care and reductions in unmet needs. The pronounced disparities for specific racial/ethnic groups and multiracial children may serve as a useful guide for clinicians and public health provid-ers for tailoring preventive and routine care, treatment, and programs aimed at reducing disparities. Targeted community-based interventions may prove especially effective in eliminating racial/ethnic disparities, as has been documented in a recent randomized, controlled trial.35Federal legislation aimed at reducing racial/ethnic
disparities in health and health care, such as the Minor-ity Health Improvement and Health DisparMinor-ity Elimina-tion Act36 and the Community Health Workers Act of
2007,37 could potentially have a major impact on the
reduction and elimination of disparities.
CONCLUSIONS
Racial/ethnic minority children in the United States ex-perience multiple disparities in medical and oral health, access to care, and use of services. Certain disparities are
particularly marked for specific racial/ethnic groups, and awareness of these noteworthy disparities may be useful for clinicians, health systems, and policy makers in op-timally addressing the needs of diverse populations. Multiracial children also experience many disparities, including the highest odds of limited abilities, digestive allergies, unmet dental care needs, and difficulties with emotions, concentration, behavior, or interpersonal re-lations. Reduction and elimination of racial/ethnic dis-parities in children may require more comprehensive data collection, analyses, and monitoring of disparities in all of the major racial/ethnic groups and multiracial chil-dren, improvements in access to care and reducing un-met needs, and targeted community-based interven-tions.
REFERENCES
1. Agency for Healthcare Research and Quality. 2006 National Healthcare Disparities Report.Rockville, MD: US Department of Health and Human Services, Agency for Healthcare Research and Quality; 2006: AHRQ Publication 07– 0012
2. Committee on Understanding and Eliminating Racial and Eth-nic Disparities in Health Care. Literature review. In: Smedley BD, Stith AY, Nelson AR, eds.Unequal Treatment: Confronting Racial and Ethnic Disparities in Health Care. Washington, DC: National Academies Press; 2003:285–383
3. Blumberg SJ, Olson L, Frankel MR, Osborn L, Srinath KP, Giambo P. Design and operation of the National Survey of Children’s Health, 2003.Vital Health Stat.2005;1(43):1–124 4. Stata Corp.Stata Survey Data Reference Manual: Release 8. College
Station, TX: Stata Corporation; 2003
5. Flores G, Bauchner H, Feinstein AR, Nguyen US. The impact of ethnicity, family income, and parental education on children’s health and use of health services. Am J Public Health.1999; 89(7):1066 –1071
6. Mendoza FS, Fuentes-Afflick E. Latino children’s health and the family-community health promotion model. West J Med.
1999;170(2):85–92
7. Weitzman M, Byrd RS, Auinger P. Black and white middle class children who have private health insurance in the United States.Pediatrics.1999;104(1 pt 2):151–157
8. Beal AC. Policies to reduce racial and ethnic disparities in child health and health care.Health Aff (Millwood).2004;23:171–179 9. Wise PH. The anatomy of a disparity in infant mortality.Annu
Rev Public Health.2004;24:341–362
10. Newacheck PW, McManus MA. Health insurance status of adolescents in the United States. Pediatrics. 1989;84(4): 699 –708
11. Wood DL, Hayward RA, Corey CR, Freeman HE, Shapiro MF. Access to medical care for children and adolescents in the United States.Pediatrics.1990;86(5):666 – 673
12. Newacheck PW, Hughes DC, Cisternas M. Children and health insurance: an overview of recent trends.Health Aff (Millwood).
1995;14(1):244 –254
13. Passel JS. Demographic and social trends affecting the health of children in the United States.Ambul Pediatr.2002;2(2 suppl): 169 –179
14. Flores G, Olson L, Tomany-Korman SC. Racial and ethnic disparities in early childhood health and healthcare.Pediatrics.
2005;115(2). Available at: www.pediatrics.org/cgi/content/ full/115/2/e183
insur-ance and its impact on preventive dental care visits for U.S. children.J Am Dent Assoc.2007;138(3):369 –380
17. Guevara JP, Mandell DS, Rostain AL, Zhao J, Hadley TR. Disparities in reporting and treatment of health conditions in children: an analysis of the Medical Expenditure Panel Survey.
Health Serv Res.2006;41(2):532–549
18. Yu SM, Huang ZJ, Singh GK. Health status and health services utilization among US Chinese, Asian Indian, Filipino, and other Asian/Pacific Islander children.Pediatrics.2004;113(1 pt 1):101–107
19. Burt CW, McCaig LF. Trends in hospital emergency depart-ment utilization: United States, 1992–99.Vital Health Stat 13.
2001;(150):1–34
20. Elixhauser A, Machlin SR, Zodet MW, et al. Health care for children and youth in the United States: 2001 annual report on access, utilization, quality, and expenditures. Ambul Pediatr.
2002;2(6):419 – 437
21. Edelstein BL. Disparities in oral health and access to care: findings of national surveys.Ambul Pediatr. 2002;2(2 suppl): 141–147
22. Harris KM, Gordon-Larsen P, Chantala K, Udry JR. Longitudi-nal trends in race/ethnic disparities in leading health indicators from adolescence to young adulthood.Arch Pediatr Adolesc Med.
2006;160(1):74 – 81
23. Heslin KC, Casey R, Shaheen MA, Cardenas F, Baker RS. Racial and ethnic differences in unmet need for vision care among children with special health care needs.Arch Opthalmol.2006; 124(6):895–902
24. Ogden CL, Flegal KM, Carroll MD, Johnson CL. Prevalence and trends in overweight among US children and Adolescents, 1999 –2000.JAMA.2002;288(14):1728 –1732
25. Hedley AA, Ogden CL, Johnson CL, Carroll MD, Curtin LR, Flegal KM. Prevalence of overweight and obesity among US children, adolescents, and adults, 1999 –2002. JAMA. 2004; 291(23):2847–2850
26. Moore WE, Stephens A, Wilson T, Wilson W, Eichner JE. Body mass index and blood pressure screening in a rural public school system: the Healthy Kids Project.Prev Chronic Dis.2006; 3(4):A114
27. Zephier E, Himes JH, Story M, Zhou X. Increasing prevalences
of overweight and obesity in Northern Plains American Indian children.Arch Pediatr Adolesc Med.2006;160(1):34 –39 28. Eisenmann JC, Katzmarzyk PT, Arnall DA, Interpreter C,
Malina RM. Growth and overweight of Navajo youth: secular changes from 1955 to 1977. Int J Obes (Lond). 2000;24(2): 211–218
29. Neumark-Sztainer D, Story M, Resnick MD, Blum RW. Psy-chosocial concerns and weight control behaviors among over-weight and nonoverover-weight Native American adolescents.J Am Diet Assoc.1997;97(6):598 – 604
30. Jackson MY. Height, weight, and body mass index of American Indian schoolchildren, 1990 –1991. J Am Diet Assoc. 1993; 93(10):1136 –1140
31. Baruffi G, Hardy CJ, Waslien CI, Uyehara SJ, Krupitsky D. Ethnic differences in the prevalence of overweight among young children in Hawaii. J Am Diet Assoc. 2004;104(11): 1701–1707
32. Williams DR, Jackson JS. Race/ethnicity and the 2000 Census: recommendations for African American and other black pop-ulations in the United States.Am J Public Health.2000;90(11): 1728 –1730
33. Denny CH, Holtzman D, Cobb N. Surveillance for health be-haviors of American Indians and Alaska Natives: findings from the Behavioral Risk Factor Surveillance System, 1997–2000.
MMWR Surveill Summ.2003;52(7):1–13
34. Flores G, Abreu M, Tomany-Korman SC. Limited English pro-ficiency, primary language spoken at home, and disparities in children’s health and healthcare: how language barriers are measured matters.Public Health Rep.2005;120(4):418 – 430 35. Flores G, Abreu M, Chaisson CE, et al. A randomized trial of
the effectiveness of community-based case management in insuring uninsured Latino children. Pediatrics. 2005;116(6): 1433–1441
36. S. 4024 [109th]: Minority Health Improvement and Health Disparity Elimination Act. Available at: www.govtrack.us/ congress/billtext.xpd?bill⫽s109-4024. Accessed March 12, 2007
DOI: 10.1542/peds.2007-1243 originally published online January 14, 2008;
2008;121;e286
Pediatrics
Glenn Flores and Sandra C. Tomany-Korman
Use of Services in US Children
Racial and Ethnic Disparities in Medical and Dental Health, Access to Care, and
Services
Updated Information &
http://pediatrics.aappublications.org/content/121/2/e286
including high resolution figures, can be found at:
References
http://pediatrics.aappublications.org/content/121/2/e286#BIBL
This article cites 29 articles, 7 of which you can access for free at:
Subspecialty Collections
http://www.aappublications.org/cgi/collection/ethics:bioethics_sub
Ethics/Bioethics following collection(s):
This article, along with others on similar topics, appears in the
Permissions & Licensing
http://www.aappublications.org/site/misc/Permissions.xhtml
in its entirety can be found online at:
Information about reproducing this article in parts (figures, tables) or
Reprints
http://www.aappublications.org/site/misc/reprints.xhtml
DOI: 10.1542/peds.2007-1243 originally published online January 14, 2008;
2008;121;e286
Pediatrics
Glenn Flores and Sandra C. Tomany-Korman
Use of Services in US Children
Racial and Ethnic Disparities in Medical and Dental Health, Access to Care, and
http://pediatrics.aappublications.org/content/121/2/e286
located on the World Wide Web at:
The online version of this article, along with updated information and services, is
by the American Academy of Pediatrics. All rights reserved. Print ISSN: 1073-0397.