University of Pennsylvania
ScholarlyCommons
Publicly Accessible Penn Dissertations
1-1-2015
Surface Chemistry Mediated Assembly of
Polymer-Grafted Nanorods in Solution and Polymer
Matrices
Robert Charles Ferrier
University of Pennsylvania, [email protected]
Follow this and additional works at:http://repository.upenn.edu/edissertations
Part of theChemical Engineering Commons,Mechanics of Materials Commons, and the
Polymer Chemistry Commons
This paper is posted at ScholarlyCommons.http://repository.upenn.edu/edissertations/1712
For more information, please [email protected]. Recommended Citation
Ferrier, Robert Charles, "Surface Chemistry Mediated Assembly of Polymer-Grafted Nanorods in Solution and Polymer Matrices" (2015).Publicly Accessible Penn Dissertations. 1712.
Surface Chemistry Mediated Assembly of Polymer-Grafted Nanorods in
Solution and Polymer Matrices
Abstract
In the dissertation, I investigate ways to assemble nanorods, typically made of gold, in solution and polymer matrices by controlling surface chemistry. Gold nanorods were anisotropically functionalized with polymer on the side and alkane dithiol on the end causing the gold nanorods to spontaneously assemble in solution. The assembly could be tuned by controlling the incubation time which affected the solution absorbance due to plasmon coupling. Linked gold nanorods were cast in polymer thin films and their optical properties were imparted to the film. This anisotropic functionalization method was utilized to placed DNA or peptides on the ends of the gold nanorods allowing for reversibly assembly. In the case of DNA, assembly was reversed upon heating and could be tuned by controlling the concentration of the complimentary DNA strand. In the case of the peptide, assembly was triggered by the presence of Zn2+ ions and could be reversed by adding in a chelater. Anisotropic modification of the nanorods could also be used to assemble organic semiconductors around the nanorods at specific facets. Here, organic semiconductors rhodamine-B, 5(6)-carboxyfluorescein, and cyanine-3 were assembled onto the surface of gold nanorods. By tuning the surface chemistry the organic semiconductors would assemble around the nanorods in different ways which resulted in unique optical properties. The dispersion of PMMA-grafted mesoscopic iron-oxide rods in polymer matrices was studied by varying the PMMA brush molecular weight (N) polymer matrix molecular weight (P), and polymer matrix type. Here, we found that the ratio of P/N and matrix type had little effect on dispersion of iron-oxide mesorods. N was found to be the main factor that determined dispersion, which is attributed to the large size of the mesorods. Long PS and short PMMA brushes were grafted to gold nanorod surfaces and the dispersion of this system in PS and PMMA was investigated by controlling matrix molecular weight. We found that the gold nanorods would disperse in PS matrices 24 times larger than the grafted brush, while in PMMA matrices the nanorods would aggregate. SCFT calculations revealed that the good dispersion is most likely due to the collapse of the short PMMA brush and the enthalpic penalty for the collapse of the PS brush onto the PMMA brush. Finally, PS-grafted gold nanorods were assembled in liquid crystals. Assembly was tuned by controlling temperature and liquid crystal defect structure in the presence of micropillar arrays. The assembly of the nanorods resulted in changes in characteristic absorbance peaks of over 100 nm. From these studies, we are able to predict and control the assembly of nanorods in both solution and polymer matrices allowing us to fine-tune optical properties.
Degree Type
Dissertation
Degree Name
Doctor of Philosophy (PhD)
Graduate Group
Chemical and Biomolecular Engineering
First Advisor
Russell J. Composto
Keywords
Colloids, Gold Nanorods, Polymer Physics, Surface Chemistry
Subject Categories
Chemical Engineering | Mechanics of Materials | Polymer Chemistry
SURFACE CHEMISTRY MEDIATED ASSEMBLY OF POLYMER-GRAFTED NANORODS IN SOLUTION AND POLYMER MATRICES
Robert Charles Ferrier, Jr. A DISSERTATION
in
Chemical and Biomolecular Engineering
Presented to the Faculties of the University of Pennsylvania in
Partial Fulfillment of the Requirements for the Degree of Doctor of Philosophy
2015
Supervisor of Dissertation
________________________
Russell J. Composto, Professor of Materials Science and Engineering
Graduate Group Chairperson
_________________________
John C. Crocker, Professorof Chemical and Biomolecular Engineering
Dissertation Committee
Daeyeon Lee, Associate Professor of Chemical and Biomolecular Engineering
Robert A. Riggleman, Assistant Professor of Chemical and Biomolecular Engineering
SURFACE CHEMISTRY MEDIATED ASSEMBLY OF POLYMER-GRAFTED NANORODS IN SOLUTION AND POLYMER MATRICES
COPYRIGHT 2015
Robert Charles Ferrier, Jr.
This work is licensed under the Creative Commons Attribution- NonCommercial-ShareAlike 3.0 License
To view a copy of this license, visit
iii
Dedicated to:
Teresa A. Ferrier, in life.
Robert C. Ferrier, Sr., in death.
iv
ACKNOWLEDGMENT
I read many theses to prepare for the writing of my own thesis. In doing so, I found myself being invariably drawn to the acknowledgments section. Hidden at the fore of these arcane tomes of scientific gobbledygook is a chapter rife with markedly human verbiage, full of emotion and complexity of character that was inexorably lost in the morass of technical writing present in the main document. Aside from this, the most striking feature of this section was it began the same way every single time: “science cannot be done by yourself.”
I find this particularly true in my case; I have garnered a cavalcade of collaborators across three different continents during my tenure here at Penn. As a result, I have grown tremendously both as a scientist and as a person. I know that this section will not be able to fully communicate the immense gratitude I have for everyone mentioned here, but I hope that those reading know my sentiments in writing pales in comparison to my true feelings which I could never adequately express.
v
year, you told me, “I have never had a bad PhD student.” I am glad that I was not your first.
As an advisor, you are top notch; you let me travel to research, you let me collaborate, do my own things, let me work on my own and helped me when I needed it. I have definitely come out better than I came in and for that I have you to thank.
I would also like to thank my committee members. I learned something important from each of you that I have incorporated into this thesis. Prof. Winey taught me to pay attention to the most minute of details even though you think no one will notice, someone will. This self-discipline is important to cultivate and I have been getting better about it as of late. I hope I haven’t made any errors here, in the dissertation. Prof. Riggleman taught me that 1)
I could probably never do simulations and 2) simulations are an extremely useful tool to help explore the underlying physics of many phenomena we see. Prof. Lee showed me that even if something isn’t in your field you can still learn from it and adapt it to what you do.
Prof. Lee and Prof. Riggleman also always got me excited about what I was doing, I always appreciated that. Sometimes it is hard to put your work into context, but they were always very forthcoming with context and advice.
Thank you to the staff especially Pat Overend, Vicky Lee, Irene Clements, Doug Yates, and Steve Szewczyk for all your help throughout the years. Doug would always answer my questions about the TEM even though they were dumb. Steve helped me and Elaine with the LC/AuNR project and he was also always around to talk about something if you could find him. Thanks to Pat, Vicky, and Irene who would always be there for a chat or to help send a package, get some mail, send an email or really just help with anything.
vi
receive a fellowship from the NSF to research abroad in Japan at Kyoto University with Prof. Ohno. In Ohno-Sensei’s lab I learned how to do research mostly by observing Huang Yun, Nakanishi-san, and Kyou-San, all three PhD students. Huang Yun, a Chinese, and I immediately hit it off due to our shared love of basketball and shared connection to China (although, perhaps, mine was tenuous at the time). Nakanishi-san and I bonded over our love of bourbon. Ohno-sensei welcomed me into his lab and taught me how to do living radical polymerization, a skill that I still treasure today. It is in this lab that I developed my love for Mahjong a game that I have learned to play with the Japanese, Chinese, and Taiwanese. I credit Mizuta Yuki and Araki Wakiuchi with this. I had so many great experiences in Japan: video game collecting, Mahjong playing, sight-seeing, alcohol drinking, food eating, and researching.
I was also lucky to receive, again from the NSF through the NBIC and also from the French Laboratoire d’excellence campaign through ARCANE, a fellowship to research in
vii
Grenoble and back down before or after work. I have done this particular trek exactly once and I can say that I would never want to do it again due to the shear tiredness. Like Patrice and Brigitte, Didier was also extremely positive and excited about research. Didier always had great ideas about what experiments we could do that would be interesting. It was in Didier’s lab that I worked with Guillaume Gines and Dr. Christine St. Pierre. Christine was
a tech in the lab and she would run the MALDI-TOF. She wanted to improve her already great English skills and as such would always talk to me about any topic asking me about English words for technical things. Guillaume taught me so much about DNA. Easily one of the most knowledgeable PhD students I have met, he would discuss at length with me about how to do particular procedures off the top of his head. We talked some about music, about his trip to the Czech Republic, about his thesis. His passion and intelligence truly informed the rest of my PhD work.
While abroad I worked with people that became my friends, at Penn I was friends with those that I worked with. Elaine Lee came to me one day, after I had been constantly pushing for months with my friends for potential collaborations, with an idea to use my gold nanorods in her liquid crystal / nanopillar assemblies. Obviously I immediately jumped at the chance and we were able to produce a functional, controllable, LC/NR/Nanopillar device. We worked well together despite my constant, random crooning and general ridiculousness. Jason Koski, whom I knew through Mike O’Reilly, turned
viii
paper, I think, is of significant import to the nanocomposite community. I also spent much time with Matthew “Will” Eibling in Prof. Saven’s lab. Will synthesized a unique,
metal-binding peptide that we thought we could use to link the gold nanorods together reversibly. The project started out pretty rough and it was difficult to get any positive results, but because of Will’s brilliant insights, we were able to make the project work extremely well.
ix
There were many friends inside and out of the department that helped me to get here today. Tom Donnelly, my oldest friend, the best man at my wedding, was always there for me when I needed him. I lived with him for a few years during my PhD. He always kept me grounded and always gave me an out to focus on something other than science. Rick Antoine, Kevin Carfagno, Manthan Gandhi, and Bevan Reitz were also always there to hang out with no matter what. Carlos Aspetti, my “partner for ten years,” and I have a long history. We both went to Drexel, studied physics, studied materials science, and worked in the same lab. We are completely different people but this made us, I think, much closer friends in the end. My cohort in MSE at Penn was invaluable throughout my career. Carlos Aspetti, Mike O’Reilly, Kate Murphy, Pavan Nukala, Vicky Doan-Nguyen, and Lisa Chen
x
encouragement and motivation. Your sunny attitude at lunch always helped me get through my day.
xi
from a completely different country, a completely different culture, we have so many things in common and we speak the same language, despite neither of us really speaking each other’s language. Travelling with her has been the best experience of my life and we have
gone all over the world. Britain, France, Japan, China, Taiwan…Maine. Every place is better than the last when I am with her. Her family has been so supportive of me, especially her father. He likes me so much that when he calls he asks when I am coming back to China, but not her. Her father and mother make me so welcome I truly have a home half way across the world. Xiaowen has supported me all this time during my “permanent head damage.” Always being understanding when I had to work late, when I had to work
weekends, when I had to write my thesis and could therefore not do any chores. She was always proud of me and always made me feel like I was doing well even if I wasn’t sure of that myself. She was always there to love me, care for me, and support me. She always got me through the toughest times during the PhD. This thesis certainly would not have been completed without her support. Regardless of what happens after I leave Penn, I know
xii
ABSTRACT
Surface Chemistry Mediated Assembly of Polymer-Grafted Nanorods in Solution and Polymer Matrices
Robert Charles Ferrier, Jr. Russell J. Composto
xiii
xiv
TABLE OF CONTENTS
ACKNOWLEDGMENT ... IV
ABSTRACT ... XII
TABLE OF CONTENTS... XIV
LIST OF TABLES ... XVIII
LIST OF ILLUSTRATIONS ... XIX
CHAPTER 1 INTRODUCTION ... 1
1.1 Gold Nanorod Synthesis ... 2
1.2 Optical Properties ... 6
1.3 Gold Nanorod Assembly ... 13
1.3.1 The Role of CTAB ... 13
1.3.2 Solution Assembly ... 15
1.3.3 Polymer Matrix Assembly ... 23
1.4 Dissertation Outline ... 28
CHAPTER 2 GOLD NANOROD LINKING TO CONTROL PLASMONIC PROPERTIES IN SOLUTION AND POLYMER NANOCOMPOSITES ... 30
2.1 Abstract ... 31
2.2 Introduction ... 32
2.3 Experimental Section ... 34
2.3.1 Linked B-NR Preparation ... 34
2.3.2 Thin Film Preparation ... 35
2.3.3 QCM-D Experiments ... 36
2.3.4 DDA Calculations ... 37
2.4 Results and Discussion ... 38
2.4.1 Functionalization and Assembly of B-NRs in Solution and Polymer Matrices ... 38
2.4.2 Inter-rod Spacing, B-NR Chain Length, and Optical Properties ... 47
xv
2.5 Conclusions ... 57
CHAPTER 3 DNA-GOLD NANOROD POLYMERS ... 59
3.1 Abstract ... 60
3.2 Introduction ... 61
3.3 Experimental Procedure ... 64
3.3.1 DNA-NR Preparation ... 64
3.3.2 DNA-NR “Polymerization” Preparation ... 65
3.3.3 Finite-Difference Time Domain (FDTD) Calculations ... 65
3.4 Results and Discussion ... 65
3.5 Conclusions ... 74
CHAPTER 4 DIRECTED REVERSIBLE LINKING OF GOLD NANORODS VIA A COMPUTATIONALLY DESIGNED, METAL-BINDING PEPTIDE ... 76
4.1 Abstract ... 77
4.2 Introduction ... 78
4.3 Results and Discussion ... 80
4.4 Conclusions ... 89
CHAPTER 5 TUNING OPTICAL PROPERTIES OF FUNCTIONALIZED GOLD NANORODS THROUGH CONTROLLED INTERACTIONS WITH ORGANIC SEMICONDUCTORS ... 90
5.1 Abstract ... 91
5.2 Introduction ... 92
5.3 Experimental Methods ... 94
5.3.1 NR Synthesis and Functionalization ... 94
5.3.2 UV-Vis Absorbance Studies ... 96
5.3.3 Photoluminescence (PL) Studies ... 96
5.4 Results and Discussion ... 97
5.4.1 5,6-Carboxyfluoroscein and Nanorods ... 97
5.4.2 Rhodamine-B and Nanorods ... 108
5.4.3 Cyanine3 and DNA-NRs ... 116
xvi
CHAPTER 6 DISPERSION OF PMMA-GRAFTED, MESOSCOPIC
IRON-OXIDE RODS IN POLYMER THIN FILMS ... 120
6.1 Abstract ... 121
6.2 Introduction ... 122
6.3 Results and Discussion ... 124
6.4 Conclusions ... 135
CHAPTER 7 ENGINEERING THE ASSEMBLY OF GOLD NANORODS IN POLYMER MATRICES ... 137
7.1 Abstract ... 138
7.2 Introduction ... 139
7.3 Computational Methods ... 143
7.3.1 Model Details ... 143
7.3.2 Potential of Mean Force Curves ... 146
7.3.3 Brush Profiles ... 147
7.4 Experimental Methods ... 148
7.4.1 AuNR Synthesis and Functionalization... 148
7.4.2 Thin Film Preparation ... 149
7.4.3 Thin Film Characterization ... 149
7.4.4 SEM Image Analysis ... 149
7.5 Experimental Results ... 150
7.5.1 Effect of Brush Type on Dispersion of Polymer Grafted AuNRs in Polymer Thin Films ... 150
7.5.2 Effect of Brush Length on Dispersion of MBNRs in Polymer Thin Films ... 164
7.5.3 Investigation of Dispersion Mechanism with Self-consistent Field Theory ... 171
7.6 Conclusions ... 183
CHAPTER 8 SELF-ASSEMBLY AND ACTUATION OF GOLD NANORODS IN LIQUID CRYSTALS OVER MICROPILLAR ARRAYS FOR TUNABLE PLASMON RESONANCE ... 186
8.1 Abstract ... 187
8.2 Introduction ... 188
8.3 Experimental methods ... 191
8.3.1 Surface functionalization of gold nanorods with polystyrene ... 191
8.3.2 Substrate functionalization ... 192
8.3.3 Assembly of gold nanorods in liquid crystals ... 192
xvii
8.4 Optical properties of gold nanorods ... 193
8.5 Control of liquid crystal surface anchoring ... 194
8.6 Optical response ... 206
8.7 Conclusions ... 213
CHAPTER 9 SUMMARY AND FUTURE WORK ... 215
9.1 Raman ... 216
9.2 DNA ... 216
9.3 Peptide ... 217
9.4 Mesoscopic Rods ... 218
9.5 Mixed Brush Gold Nanorods ... 219
9.6 Nanorods and Liquid Crystals ... 221
9.7 Nanoparticle Type ... 221
9.8 Final Comments ... 223
xviii
LIST OF TABLES
Table 2.1 LSPR Peak Positions of unlinked and linked AuNRs ... 47
Table 6.1 Summary of Samples Prepared. ... 126
Table 7.1 Summary of Dispersion States for Each System Studied... 159
Table 7.2 Summary of LSPR Peak Position for Each System Studied ... 162
Table 7.3 Summary of Dispersion State for M-MBNRs and S-MBNRs ... 169
Table 7.4 Summary of LSPR Peak Position for M-MBNRs and S-MBNRs ... 171
xix
LIST OF ILLUSTRATIONS
Figure 1.1 The Lycurgus cup being lit from behind. The red color is due to the presence of metal nanoparticles within the glass. Image taken from (Freestone, Meeks et al. 2007). ... 3
Figure 1.2 SEM image of as-synthesized gold nanorods cast onto a Si wafer. Cartoon of gold nanorods with blow up of CTAB cationic surfactant layer present on gold nanorods. Note that the CTAB forms a bi-layer in water. ... 6
Figure 1.3 Illustration of surface plasmons in the presence of resonant incident light. Figure taken reproduced (Yasun, Kang et al. 2013). ... 7
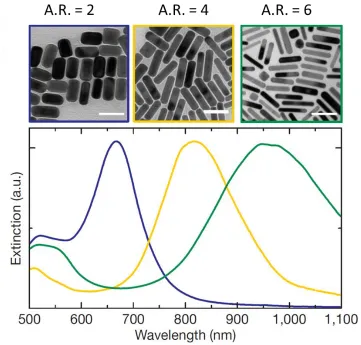
Figure 1.4 SEM image of aspect ratio (A.R.) 2 (blue), 4 (yellow), and 6 (green) and their
respective extinction spectra. As A.R. is increased the LSPR peak undergoes a red-shift. All scale bars are 100 nm. Figure taken reproduced (Alkilany, Thompson et al. 2012)... 8
Figure 1.5 SEM images of gold nanorod chains (a) and their respective scattering (b). As the number of nanorods in a chain is increased the scattering red-shifts. (c) shows the effect of angle between the nanorods. The LSPR peak red-shifts as the angle becomes closer to 180 degrees. Scale bar is 250 nm. Figure reproduced from (Kumar, Wei et al. 2013). ... 10
Figure 1.6 The plot on the left shows how extinction and SERS enhancement changes as a function of number of nanorods per chain. The plot on the right is a heat map of the electric field for chains of 2, 3, and 5 nanorods. Warmer colors indicate larger field strengths. In the gap between nanorods field is significantly enhanced. Scale bars are 40 nm. Figure reproduced from (Lee, Andrade et al. 2011). ... 11
Figure 1.7 Gold nanorods can both enhance and quench fluorescence emission of an analyte depending on the proximity to and position of the analyte relative to the gold nanorod. a. FDTD simulation of the enhanced electric around a gold nanorod with an analyte placed at the tip (red star). B. The fluorescence enhancement of the analyte as a function of separation distance from the nanorod end. c. The fluorescence quenching of a quantum dot as a function of separation distance from the gold nanorod surface. Figures a and b reproduced from (Khatua, Paulo et al. 2014) and c reproduced from (Li, Qian et al. 2009). ... 12
Figure 1.8 a. The absorbance spectra of gold nanorods in the presence of 1,9 nonanedithiol over time. The red shift and broadening of the LSPR peak is consistent with end-to-end linking. b. SEM image of gold nanorods linked end-to-end by dithiol molecules. Figures reproduced from (Shibu Joseph, Ipe et al. 2006). ... 16
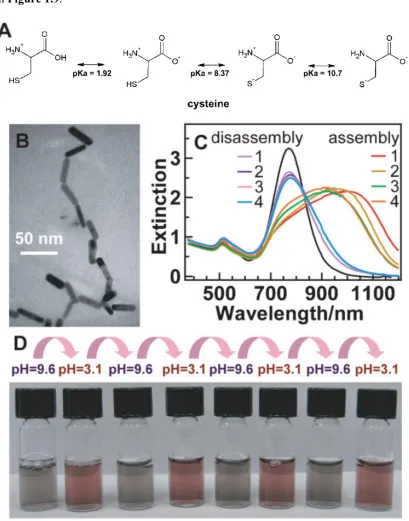
Figure 1.9 a. Cysteine charge group changes as pH is changed. b. SEM image of gold nanorods linked with cysteine. c. Absorbance spectra of gold nanorods linked with cysteine at high pH and unlinked at low pH. The LSPR peak broadens and red-shifts when gold nanorods are linked and blue-shifts when the gold nanorods are unlinked. d. Vials containing linked (purple) and unlinked (red) gold nanorods in the presence of cysteine. The picture emphasizes the stark change in color upon linking. Figure a reproduced from (Sethi, Joung et al. 2009) while the rest were reproduced from (Sun, Ni et al. 2008). ... 18
Figure 1.10 a. TEM image of end-to-end assembled gold nanorods. b. Cartoon depicting PS brush in low (top) and high (bottom) water content. Water is a poor solvent for PS and so collapses the brush driving end-to-end assembly. c. Absorbance spectra of gold nanorods at increasing water content. As water content is increased the LSPR red-shifts indicative of an increasing number of nanorods per chain. Scale bar is 50 nm. Figure reproduced from reference (Nie, Fava et al. 2007)... 21
Figure 1.11 TEM images of gold nanorods in polymer matrices at various brush (N) and matrix (P) index of polymerization. If P>2N the nanorods will aggregate, while if P < 2N the nanorods will remain dispersion. Scale bars are 200 nm. Figure reproduced from reference (Hore,
xx
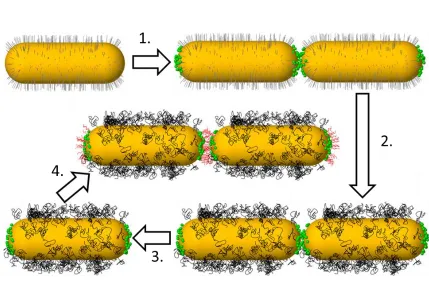
Figure 2.1 Synthesis proceeds clock-wise from the top left. CTAB-coated AuNRs are linked with cysteine (Step 1.). CTAB is replaced with HS-PEO (Step 2.) to facilitate transfer to non-aqueous solvents. A solvent exchange from water to methanol is performed (Step 3.), which de-links the B-NRs and frees up surface binding sites to allow for further end-functionalization. B-NRs are then linked with DT molecules in an organic solvent (e.g. chloroform) (Step 4.) and chains of B-NRs can then be transferred to polymer films via simple techniques such as spin-casting. ... 39
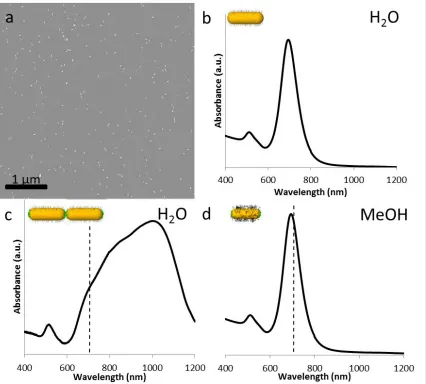
Figure 2.2 (a) Representative scanning electron microscope (SEM) image of AuNRs spin-cast from water onto a silicon substrate. The AuNRs are 39 nm long by 12.5 nm in diameter, which results in an aspect ratio of approximately 3.1. This aspect ratio is consistent with the LSPR peak of 707 nm seen in the UV/Vis spectra (b). Linking with cysteine results in a strong red-shift and broadening in the LSPR band, shifting the peak to 1024 nm as can be seen in spectra (c), where the dotted line shows the unlinked peak position. The spectra returns to the discrete AuNR case after the CTAB on the side of the AuNR is replaced with 5 kg/mol HS-PEO and the solution is solvent exchanged to methanol with a peak position of 694 nm (d), nearly identical to the discrete AuNRs in water. The small blue shift is most likely due to a change in the index between water and methanol (nH2O > nMeOH).(Link, Mohamed et al. 1999, Chen, Kou et al. 2008) ... 40
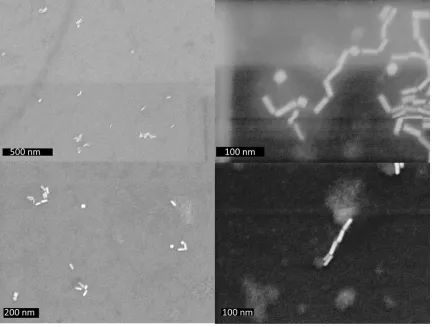
Figure 2.3 Scanning electron micrographs of AuNRs end-linked with cysteine. Samples were drop cast from water. ... 42
Figure 2.4 Absorbance spectra of AuNRs before (blue curve) and after (red curve) replacement of CTAB surfactant layer with 5K HSPEO. A 5nm red shift can be seen after CTAB is replaced with a homogeneous PEO layer. ... 43
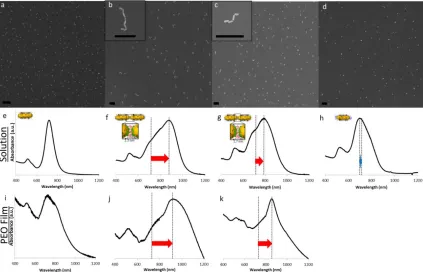
Figure 2.5 Representative SEM images of B-NRs unlinked (a), linked with C6DT (b), linked with C9DT (c), and incubated with 1-octanethiol (d) (all scale bars are 250 nm). B-NRs are well dispersed in the unlinked case (a) and the 1-octanethiol case (d) whereas in the linked cases (b and c) chains of end-linked B-NRs can be clearly seen. UV/Vis spectroscopy was performed on solutions of unlinked B-NRs (e), B-NRs linked with C6DT (f) and C9DT (g), and B-NRs incubated with 1-octanethiol (h). A strong red-shift and LSPR peak broadening is seen for linked B-NRs (f and g) as compared to the discrete case (e), while B-NRs incubated with 1-octanethiol exhibit a small blue-shift. UV/Visible spectroscopy was also performed on PEO films of B-NRs unlinked (i) and linked with C6DT (j) and C9DT (k). Spectra from the films compare favorably with those taken in solution. ... 45
Figure 2.6 (a)DDA calculations for end-linked rods in a polymer matrix. Calculations were performed for pairs of rods at end-to-end separation distances of 100 nm, 10 nm, and 1 nm and for a tetramer of rods at 1 nm. As the distance decreases, the LSPR peak red-shifts and broadens. B-NRs were incubated with C6DT and absorbance spectra were taken at various time points (b). The LSPR peak red-shifts and broadens as a function of time. This solution was cast in a PMMA film at the same time points as the UV/Vis data and chain length was analyzed (c). As incubation time increases, the average number of B-NRs per chain (Xn) also increases. Xn is correlated with LSPR peak shift (d) which is consistent with DDA calculations. Polydispersity in chain size (PDI) also increases with incubation time and this is correlated with the relative broadening of the LSPR peak (e). The trendlines in d and e serve as guides to the eye. ... 48
Figure 2.7 UV/Vis spectra for B-NRs linked with 1,6 hexanedithiol in chloroform at different incubation times. Curves shown are for 0, 5, 10, and 30 minutes incubation, followed by curves every 30 minutes (i.e. 60 minutes, 90 minutes, etc.) up to 6 hours. As time increases, the LSPR peak red-shifts and broadens, consistent with linking. ... 49
xxi
as calculated from the change in frequency of the 7th mode at each step in the QCM-D experiment detailed in scheme (a). Binding events are characterized by an increase in the areal mass. Rinsing steps were done to remove physically bound molecules. Cysteine bound at a density of 1.12 chains/nm2, while C6DT bound at 3.4 chain/nm2. Cysteine-coated gold nanoparticles were calculated to bind at 18.5 NPs/µm2. AFM was performed (c) on the QCM-D crystal and particles with an average feature height of 18.2 +/- 5 nm were bound at an areal density of 7 +/- 3
NPs/µm2. ... 53
Figure 2.9 Traces of (top) fn/n (n= 3, 5, 7) and (bottom) Dn versus time for formation of cysteine sub-monolayer, followed by formation of 1,6 hexanedithiol/cysteine layer and
subsequent nanoparticle grafting. Arrows 1, 2, 3, 4, 5, and 6 represent the exposure of cysteine solution, rinsing with ethanol, the exposure of 1,6 hexanedithiol solution, rinsing with ethanol, the exposure of nano-particle (~16 nm) solution, and rinsing with ethanol, respectively. ... 55
Figure 2.10 Topography AFM image of neat QCM-D crystal showing no features. ... 57
Figure 3.1 Absorbance spectra of BNRs (blue), B-DNA-NRs (red) and A-DNA-NRs (green). There is no change in optical properties after end-grafting of DNA. ... 66
Figure 3.2 Absorbance spectra of DNA-NRs at increasing amounts of B-DNA-NRs added. As the number of B-DNA-NRs is increased, the LSPR peak undergoes a red-shift and broadening consistent with end-to-end linking. ... 67
Figure 3.3 Absorbance spectra of pure B-DNA-NRs after 0 to 3 heating/cooling cycles at 50 C to room temperature. There is little to no change in the LSPR peak as the temperature is cycled indicating no reshaping of the DNA-NRs and no linking of the DNA-NRs... 68
Figure 3.4 The degree of polymerization as a function of B-DNNRs added to a solution of A-DNA-NRs as calculated using Carothers’ equation. ... 70
Figure 3.5 Simulated normalized absorption cross section versus wavelength for monomer, dimer, trimer, and tetramer DNA-NRs with a separation distance of 3 nm. The NRs are end-to-end aligned linearly. As the degree of polymerization increases, the LSPR absorption peak also increases (i.e. red-shifts). ... 71
Figure 3.6 LSPR peak position versus degree of polymerization for simulated and experimental DNA-NR polymers. The separation distance for dimers, trimers, and tetramers was varied from 2 nm to 6 nm, and the data is denoted with circles. The data in red squares is from experiments. The plot shows that the DNA-NRs most closely follow the simulated DNA-NRs with separation distance of between 2 nm and 3 nm. Trend-lines are added to guide the eyes. ... 72
Figure 3.7 SEM images of DNA-NRs with 5% of B-DNA-NRs (a) and 37.5% B-DNA-NRs (b). The degree of polymerization increases significantly as the amount of B-DNA-NRs is increased. ... 73
Figure 3.8 Cluster analysis performed on SEM images of 5% (orange), 12.5% (gray), and 37.5% (blue) B-DNA-NRs. The percent of individual DNA-NRs significantly decreases when larger amounts of B-DNA-NRs are present. ... 73
Figure 3.9 Calculated (orange) and experimental (blue) degree of polymerization values. The experimental values are close but slightly lower than the theoretically determined values probably due to a lack of full conversion of B-DNA-NRs at higher r. ... 74
Figure 4.1 (a) The absorbance spectrum of as-synthesized AuNRs in DI H2O. The LSPR peak position is found to be at 760 nm. (b) A representative SEM image of the as-synthesized AuNRs. Analysis of SEM images reveals AuNRs that are 35 nm in length by 12 nm in diameter. The scale bar is 100 nm. ... 81
xxii
Figure 4.3 Normalized absorbance spectra and corresponding SEM image of PNRs before addition of Zn2+ (a,b), after addition of 250 µM Zn2+ (c,d), and after addition of 250 µM EDTA (e,f). Before the addition of Zn2+, the PNRs are well dispersed with LSPR peak at 766 nm. Adding Zn2+ causes the PNRs to link, which causes the LSPR to undergo a broadening and bathochromic shift to 960 nm. Adding EDTA causes the PNRs to revert to their dispersed state which is characterized by a hypsochromic shift in the LSPR to 764 nm. The line on the
absorbance spectra (a,c,e) indicates the peak position of the dispersed PNR LSPR peak (e.g. 766 nm). ... 84
Figure 4.4 Still images from a movie, which can be viewed in supplemental, that shows the speed and ease with which the PNRs are de-linked. (a) Still of the juxtaposition of the dispersed (left cuvette) and linked (right cuvette) PNR solutions. The linked PNR solution is noticeably bluer than the unlinked PNR solution which is red-wine in color. (b) EDTA is added to linked PNR solution via pipette. (c) Cuvette containing EDTA / linked PNR solution is shaken for a few seconds. (d) Juxtaposition of the previously unlinked (left cuvette) and previously linked (right cuvette) after addition of EDTA and shaking. ... 86
Figure 4.5 Absorbance spectra of PNRs with 250 µM EDTA (blue), 250 µM Ca2+ (orange), and 250 µM of Ca2+ and 250 µM of EDTA (gray). None of the combinations of additives causes the PNRs to link which is evident by the LSPR peak staying constant at 764 nm, consistent with well-dispersed PNRs. ... 87
Figure 4.6 (a) Selected absorbance spectra of PNRs incubated with 0, 50, 75, 125, and 225 µM of Zn2+. As the Zn2+ concentration is increased, the LSPR peak strength at 760 nm significantly decreases as the LSPR peak undergoes a broadening and bathochromic shift. The shift at high Zn2+ concentration is captured in (b) which is the LSPR peak position at each Zn2+ concentration. The LSPR peak begins to shift after 50 µM of Zn2+ is added and continues shifting roughly linearly until 175 µM of Zn2+ is added, after which the peak position plateaus at 976 nm. ... 88
Figure 5.1 Chemical structure of CF in DI water (a). Absorbance spectra (b) and emission spectra (c) of CF. Both absorbance and emission increase at increasing concentration of CF. ... 98
Figure 5.2 Cartoon of the different proposed AuNR surface chemistries investigated ... 100
Figure 5.3 Steady-state absorbance near the AuNR TSPR for CTAB-NRs (a), Cys-NRs (b), and Bi-NRs (c). The absorbance due to CF was subtracted out for clarity. Absorbance spectra near the AuNR LSPR for CTAB-NRs (d), Cys-NRs (e), and Bi-NRs (f) at 0 to 250 μL of CF added. Steady-State absorbance near the TSPR band increases at increased concentrations of CF for CTAB-NRs (a) and Cys-NRS (b). The absorption band for Bi-NRs (c) undergoes an
hypsochromic shift of ~18 nm and increases with increasing CF concentration, but less strongly than CTAB-NRs and Cys-NRs. The absorbance of the LSPR band decreases, in all cases, by approximately 50%. No shift was seen in CTAB-NRs spectra (d), a small hypsochromic shift of 6 nm is seen in Cys-NRs spectra (e), and an hypsochromic shift of ca. 25 nm was seen in Bi-NRs spectra (f) at increased CF concentration. ... 100
Figure 5.4 Steady-state PL emission spectra for CTAB-NRs (a), Cys-NRs (b), Bi-NRs (c), and CTAB (d) at increasing volume of CF. Bi-NRs (c) and CTAB (d) show no quenching compared to neat CF (c.f. figure 1b). CTAB-NRs (a) and Cys-NRs (b) show significant quenching of 70% and 70-90%, respectively, compared to neat CF. Cys-NRs show additional quenching after 100 μL of CF was added. ... 102
xxiii
Figure 5.6 Normalized absorbance spectra of pure CF and CF with free CTAB. The maximum of the absorbance band undergoes a bathochromic shift from 478 nm to 488 nm upon addition of CTAB. ... 105
Figure 5.7 Peak absorbance intensity (a) and peak fluorescence intensity (b) for CF, CTAB-NRs, and Cys-NRs. ... 106
Figure 5.8 Cartoon illustrating concentration and surface chemistry effect of CF binding to NRs. ... 108
Figure 5.9 Chemical structure of RhB in DI water (a). Absorbance spectra (b) and PL emission spectra (c) of RhB. Absorbance increases as a function of RhB volume added. Fluorescence initially increases as a function of RhB volume added and then decreases and undergoes a bathochromic shift. The inset in (c) is the peak fluorescence intensity as a function of RhB volume, which clearly shows the increase and subsequent decrease in intensity at higher RhB volumes. ... 109
Figure 5.10 Absorbance spectra near the AuNR TSPR for CTAB-NRs (a) and Bi-NRs (b) at 0 to 250 μL of RhB added. The absorbance due to Rh-B was subtracted out for clarity. The
absorbance peak for CTAB-NRs undergoes a 30 nm bathochromic shift and increases as a function of Rh-B volume added. The absorbance band for Bi-NRs undergoes no change at increased RhB volume. Absorbance spectra near the AuNR LSPR for CTAB-NRs (c), and Bi-NRs (d) at 0 to 250 μL of Rh-B added. The absorbance bands for CTAB-Bi-NRs and Bi-Bi-NRs decrease as function of Rh-B volume added. Bi-NR absorbance and LSPR absorbance peak also undergoes a small hypsochromic shift of 10 nm. ... 111
Figure 5.11 PL emission spectra of CTAB-NRs (a), Bi-NRs (b), and CTAB (c) at increasing volumes of RhB. For all samples, the PL emission band increases monotonically until 38 μL (a, c) or 50 μL (b) is added and then decreases as a function of Rh-B volume added. The PL emission band also undergoes a bathochromic shift in all cases. The PL emission is slightly quenched in both the CTAB-NRs and Bi-NRs case compared to neat Rh-B. The PL is enhanced in the CTAB case due to free CTAB protecting the Rh-B from aggregating and self-quenching. ... 112
Figure 5.12 Normalized absorbance spectra for RhB. The shoulder at 512 nm increases in
relative intensity as a function of RhB volume added, which is indicative of RhB aggregation. 114
Figure 5.13 Normalized absorbance spectra for CTAB-NRs. The shoulder at 512 nm is
suppressed as a function of RhB volume added, indicating RhB is well-dispersed. ... 114
Figure 5.14 Normalized absorbance spectra for neat RhB, Bi-NRs, and CTAB-NRs at 250 μL of RhB added. The relative intensity of the shoulder at 512 nm is similar in both the neat RhB and Bi-NRs case, but is significantly suppressed in the CTAB-NRs case. ... 116
Figure 5.15 Cartoon depicting RhB interaction with CTAB-NRs and Bi-NRs ... 116
Figure 5.16 (a) Absorbance spectra of DNA-NRs with free Cy3-DNA (black) and Cy3-DNA hybridized to DNA-NR end (red). (b) Emission spectra of free Cy3-DNA (black), free Cy3-DNA + DNA-NRs (blue), and Cy3-DNA hybridized to DNA-NR end (red). ... 118
Figure 6.1 Representative TEM image of FeMRs drop cast from solution onto a TEM grid. This particular image is of the FeMRs with 160 kg/mol PMMA brush. The FeMRs are 181 +/- 16 nm in length with a diameter of 34 +/- 3 nm. ... 125
Figure 6.2 Representative TEM images FeMRs in thin films of PMMA (top row) and PEO (bottom row). The FeMRs with 160 kg/mol brush (a, d) dispersed well in across all matrices and matrix P. The FeMRs with 32 kg/mol brush (b, e) and 3.7 kg/mol brush (c, f) aggregated across all matrices and matrix P. Insets show a close up of the FeMRs. ... 128
xxiv
Figure 6.4 Free energy calculations for FeMRs with grafted polymer brushes the same size as those in our experimental studies (a-c) and brushes between N = 300 and N = 1200 (d) as a function of separation distance. The free energy in figures a and b (N = 37 and N = 320, respectively) are always negative implying that the FeMRs are largely attracted to one another and will tend toward aggregation, which is in agreement with experimental observations. The free energy in c (N=1600) has a primary minima and then a large energy barrier implying that the rods are repulsive. The location of the minima (ca. 40 nm) is roughly consistent with observed
separation distance of the rods (ca. 60 nm). Figure d shows that FeMRs with N > 600 should be dispersed. ... 132
Figure 6.5 Phase map P vs. N of all experimental and calculated samples. The line P=2N is plotted to show the divergence of our data from previous studies.(Hore, Frischknecht et al. 2012) Green markers are aggregated samples, red markers are dispersed samples, squares are FeMRs in a PMMA matrix, circles are FeMRs in a PEO matrix, unfilled markers are the calculated samples. While P does not play a role in the calculations, P was set equal to N to place the calculations on this plot. ... 135
Figure 7.1 FTIR spectra taken from MBNR solution drop-cast onto a silicon wafer. Peaks at wavenumbers 2917, 2848, 1577, and 1492 (shoulder) correspond to polystyrene brush.(Chalmers and Griffiths 2002) Peaks at wavenumbers 2952 (shoulder), 1731, 1452, and 1376 correspond to the PMMA brush.(Duan, Zhang et al. 2008) ... 151
Figure 7.2 Cartoon of AuNRs Studied ... 151
Figure 7.3 Absorbance spectra (a-c) and SEM images (insets) for HNRs (a), BNRs (b) and MBNRs (c) in toluene. HNRs and BNRs each have a LSPR peak at 743 nm, while MBNRs have a LSPR peak at 753 nm. The HNRs and BNRs are each 37.8 +/- 6.2 nm in length by 14.1 +/- 4.6 nm in diameter. The MBNRs are 43.8 +/- 6.6 nm in length and 15.5 +/- 4.4 nm in diameter. Scale bars for SEM images are 500 nm. ... 152
Figure 7.4 SEM images of AuNR systems in various polymer matrices. The left column (a-f) are AuNRs in PS matrices, while the right column (g-l) are AuNRs in PMMA matrices. For each AuNR system, the lowest (1.7 kg/mol for PS, 1.1 kg/mol for PMMA) and highest (270 kg/mol for PS, 336 kg/mol for PMMA) matrix Mn are presented. The images demarcated by green are for the HNRs system, by blue are the BNRs system, and by red are the MBNRs system. In PS matrices, the HNRs and BNRs go from dispersed to aggregated as the matrix Mn is changed from low to high (a to b and c to d, respectively), whereas the MBNRs remain dispersed even at high Mn (compare e and f). In PMMA, all systems behave similarly and aggregate as the matrix Mn is changed from low to high (compare g to h, i to j, and k to l). Inset scale bars are 500 nm. ... 155
Figure 7.5 SEM images of HNRs (a,b, g,h), BNRs (c,d,i,j), and MBNRs (e,f,k,l) in PS (left column) and PMMA (right column). PS Mn = 5.78kg/mol (a,c,e) and 90 kg/mol (b,d,f). PMMA Mn = 17 kg/mol (g,i,k) and 77 kg/mol (h,j,l). ... 157
Figure 7.6 Cluster analysis for PS matrices (top row) containing HNRs (a), BNRs (b), and MBNRs (c) and for PMMA matrices (bottom row) containing HNRs (d), BNRs (e), and MBNRs (f). The HNRs and BNRs behave similarly in PS; at high matrix Mn both AuNR systems
aggregated. However, the MBNRs remain highly dispersed. The BNRs and MBNRs behave similarly in PMMA; at higher matrix Mn the percent of individual AuNRs decreases to ca. 50%. The HNRs strongly aggregate in PMMA with individual AuNRs making up only ca. 20% at higher matrix Mn. ... 158
xxv
Figure 7.8 Absorbance spectra of AuNR systems taken in PS (top row) at Mn 1.7 kg/mol (black) and 270K and in PMMA (bottom row) at Mn 1.1 kg/mol and 336 kg/mol . In PS, the LSPR peak for HNRs (a) and BNRs (b) undergoes a hyspochromic shift as Mn increases from 1.7 kg/mol to 270 kg/mol. No shift is evident in the LSPR peak for MBNRs (c), consistent with good dispersion in both systems. In PMMA, there is a hypsochromic shift in the LSPR for the HNRs (d), BNRs (e), and MBNRs (f) as Mn increases from 1.1 kg/mol to 336 kg/mol, consistent with aggregation. ... 161
Figure 7.9 AuNRs grafted with 15 kg/mol PMMA and 5.3 kg/mol PS in PS (top row) and PMMA matrices (bottom row). In PS Mn = 1.7 kg/mol (a), AuNRs are between dispersed in aggregated, while in PS Mn = 270 kg/mol (b) the AuNRs are aggregated. In both PMMA Mn = 1.1 kg/mol (c) and 336 kg/mol (d) the AuNRs are dispersed. The films in all cases were of poorer quality than the films prepared in the main text due to the necessity of casting them from methyl ethyl ketone. This probably leads to worse dispersion in all cases. ... 163
Figure 7.10 Absorbance spectra (in toluene) and SEM images of M-MBNRs (a) and S-MBNRs (b). The LSPR peak position for the M-MBNRs is 753 nm, while the LSPR peak position for S-MBNRs is 750 nm. Inset scale bars are 200 nm. ... 165
Figure 7.11 SEM images of AuNR systems in various polymer matrices. The left column (a-d) are AuNRs in PS matrices, while the right column (e-h) are AuNRs in PMMA matrices. For each AuNR system, the lowest (1.7 kg/mol for PS, 1.1 kg/mol for PMMA) and highest (270 kg/mol for PS, 336 kg/mol for PMMA) matrix Mn are presented. The images demarcated by orange are for the M-MBNRs system and by purple are the S-MBNRs system. In PS matrices, the M-MBNRs remain relatively dispersed between the 1.7 kg/mol (a) and 270 kg/mol (b) PS matrices, while the S-MBNRs show poor dispersion in both the 1.7 kg/mol (c) and 270 kg/mol (d) PS matrices. In PMMA matrices, the M-MBNRs go from dispersed in 1.1 kg/mol (e) to aggregated in 336 kg/mol PMMA, while the S-MBNRs remain poorly dispersed in both 1.1 kg/mol (g) and 336 kg/mol (h) PMMA. Inset scale-bars are 200 nm. ... 167
Figure 7.12 Cluster analysis in PS (top row) and PMMA (bottom row) matrices for M-MBNRs (a,c) and S-MBNRs (b,d). The MMBNRs show similar dispersion across all PS (a) matrix Mn, while in PMMA (c) they aggregate at higher PMMA Mn. The SMBNRs display poor dispersion in both PS (b) and PMMA (d), where the percent of individual S-MBNRs decreases
monotonically as Mn is increased. ... 168
Figure 7.13 Absorbance spectra of M-MBNRs (a, c) and S-MBNRs (b,d) in PS (top row) and PMMA (bottom row). The LSPR peak does not shift at higher PS matrix Mn for M-MBNRs (a), consistent with good dispersion, but does undergo a hypsochromic shift at higher PMMA matrix Mn (c), consistent with aggregation. The LSPR peak does not shift for S-MBNRs in either PS (b) or PMMA (d), but does broaden significantly suggesting the S-MBNRs begin poorly dispersed and aggregate more as matrix Mn is increased, resulting in broadening. ... 170
xxvi
BNRs and MBNRs, which have an energetic nadir of -5 and -4 kT per unit length, respectively. ... 174
Figure 7.15 Brush profiles for HNRs (a,d), BNRs (b,e) and MBNRs (c,f) in PS (top row) and PMMA (bottom row). Each plot contains the brush profiles at two different P, namely P = 1.7 kg/mol (black) and 90 kg/mol (red) for the PS matrix and P = 1.1 kg/mol (black) and 77 kg/mol (red) for the PMMA matrix. For the HNRs, N = 11.5 kg/mol PS while for the BNRs and MBNRs, the long brush (solid) has a N = 11.5 kg/mol PS while the short brush (dashed) has a N = 5.3 kg/mol PS (BNRs) or N = 5 kg/mol (MBNRs). For HNRs, the brush is extended in P = 1.7 kg/mol PS, but is compressed in P = 90 kg/mol, while in PMMA P = 1.1 kg/mol the brush is more compressed than PS P = 1.7 kg/mol and is extremely compressed when PMMA P = 77 kg/mol. The BNRs and MBNRs display similar brush behavior except that the short brush for MBNRs is significantly more compressed than the short brush for the BNRs, which is coupled with a slight extension of the long brush of the MBNRs compared to the BNRs. ... 176
Figure 7.16 Free energy per unit length vs. separation distance plots for m-MBNRs (a,c) and s-MBNRs (b,d) in PS (top row) and PMMA (bottom row). The m-s-MBNRs have a PS N = 5.3 kg/mol while the s-MBNRs have a PS N = 3 kg/mol. In all cases, the PMMA N = 5 kg/mol. Each curve on each plot corresponds to a different matrix chain size (P), namely P = 1.7 kg/mol (black), 5.8 kg/mol (red), and 90 kg/mol (blue) for the PS matrix calculations while P = 1.1 kg/mol (black), 17 kg/mol (red), and 77 kg/mol (blue). m-MBNRs in PS (a) display a well depth inversely correlated to P; at high P the system achieves maximum well depth of nearly ca. -1.5 kT per unit length. The trend is the same in PMMA (c), but the well is a bit shallower at -1.0 kT per unit length. Similarly for s-MBNRs, in PS (b) and PMMA (d) the well depth increases with increasing P. The depth of the well at high P is approximately -0.5 kT per unit length in both PS and PMMA matrices. ... 178
Figure 7.17 Brush profiles for m-MBNRs (a,c) and s-MBNRs (b,d) in PS (top row) and PMMA (bottom row). The m-MBNRs have a PS N = 5.3 kg/mol while the s-MBNRs have a PS N = 3 kg/mol. In all cases, the PMMA N = 5 kg/mol. The black curves represent either the case of P = 1.7 kg/mol (PS matrix) or 1.1 kg.mol (PMMA matrix) while the red curves represent the case of P = 90 kg/mol (PS matrix) or 77 kg/mol (PMMA matrix). ... 180
Figure 7.18 Effect of Chi on (a) total brush profile, (b) individual brush profiles, and (c) PMF calculations. P = 90 kg/mol PS while the longer graft chains have an N = 11.5 kg/mol PS and the short graft chains have an N = 5.3 kg/mol PS (χ, = 0) or N = 5 kg/mol PMMA (χ > 0). ... 181
Figure 7.19 Effect of grafting density (σ) at χ of 0 (a-c) and 0.15 (d-f) on (a, d) total brush profiles, (b, e) individual brush profiles, and (c, f) PMF calculations. P = 90 kg/mol PS while the longer graft chains have an N = 11.5 kg/mol PS and the short graft chains have an N = 5.3 kg/mol PS (a-c) or N = 5 kg/mol PMMA (d-f). ... 182
Figure 7.20 Effect of ratio of long to short chains (fa) at different chi on (a, d, g) total brush profiles, (b, e, h) individual brush profiles, and (c, f, i) PMF calculations. fa was chosen to be 0.2 (a-c), 0.4 (d-f), and 0.6 (g-i). P = 90 kg/mol PS while the longer graft chains have an N = 11.5 kg/mol PS and the short graft chains have an N = 5.3 kg/mol PS (χ = 0) or N = 5 kg/mol PMMA (χ = 0.15). ... 183
Figure 8.1 (a) Schematic detailing the functionalization of AuNRs with polystyrene brushes. (b-c) Extinction spectra of (b) AuNRs in water and (b) PS-AuNRs in chloroform. (d) SEM image of PS-AuNRs. ... 194
Figure 8.2 Schematic of the substrate functionalization. ... 195
Figure 8.3 Polarized optical microscopy images of PS-AuNRs in 8CB with homeotropic
xxvii
Figure 8.4 Schematic of the director field lines of 8CB in the nematic phase between two pillars. (a) Uniform escaping of the director field and (b) bulk disclination lines with +1/2 and (c) -1/2 winding number. X indicates the defect location. ... 197
Figure 8.5 Polarized optical microscopy images of PS-AuNRs in 8CB with homeotropic
anchoring epoxy pillar arrays and cover slips. Pillar dimensions are diameter = 10 µm, spacing = 10 µm, and AR = 0.9 (a), 1.3 (b), and 1.6 (c). The temperature (°C) is indicated in the bottom center of each image. Scale bars: 20 μm. ... 199
Figure 8.6 Radius of the outer defect as a function of the temperature below the nematic-to-isotropic transition temperature. ... 200
Figure 8.7 Schematic of the proposed minimum energy surfaces of 8CB in the smectic phase between micropillars (a, c, e) overlaid with the corresponding POM images (b, d, f). Pillar dimensions are diameter = 10 µm, spacing = 10 µm, and AR = 0.9 (a-b), 1.3 (c-d), and 1.6 (e-f). (a) Surfaces constructed by intersecting concentric cylindrical smectic layers wrapped around a lattice of intersecting line defects. Reproduced with permission from reference (DiDonna and Kamien 2003). (b) POM image overlaid with the top-down view of the intersecting cylinders and line defects. Red and green rectangles indicate cylinders. Black lines indicate the line defects. Blue lines indicate where the cylinders intersect, i.e. where the smectic layers bend. (c) An FCD formed by confining smectic layers within a cylinder of planar anchoring on the sides and homeotropic anchoring at the top and bottom surfaces. Copyrighted image from reference (Honglawan, Beller et al. 2013). (d) POM image overlaid with the top-down view of the confining cylinders (blue circles). Red dots indicate the disclination lines perpendicular to the viewing plane. (e) Parallel smectic layers confined by homeotropic anchoring at all interfaces with bending of the layers at the side interfaces. (f) POM image overlaid with red circles
indicating the micropillars and a blue line indicating the cross-sectional view of the smectic layers shown in (e). ... 203
Figure 8.8 Polarized optical microscopy images of PS-AuNRs in 8CB over planar anchoring epoxy pillar arrays. Pillar dimensions are diameter = 10 µm, spacing = 10 µm, and AR= 0.9 (a-b), 1.3 (c-d), and 1.6 (e-f). The temperature is 35°C (nematic, a, c, e) and 30°C (smectic, b, d, f). Scale bars: 20 μm. ... 205
Figure 8.9 (a) Extinction spectra of PS-AuNRs in 8CB over homeotropic epoxy pillars. The extinction is offset for clarity. Red, blue, and black colors indicate isotropic, nematic, and smectic phase, respectively. (b) The defect radius of the LC and transverse localized surface plasmonic resonance wavelength of the PS-AuNRs over epoxy pillars as a function of temperature. ... 207
Figure 8.10 (a) Extinction spectra of PS-AuNRs in 8CB over planar epoxy pillars. The extinction is offset for clarity. Red, blue, and black colors indicate isotropic, nematic, and smectic phase, respectively. (b) The transverse and longitudinal localized surface plasmonic resonance peak position as a function of temperature for both homeotropic and planar cells. ... 209
Figure 8.11 (a) Extinction spectra of PS-AuNRs in 8CB sandwiched between two glass slides with homeotropic anchoring. The extinction is offset for clarity. Red, blue, and black colors indicate isotropic, nematic, and smectic phase, respectively. (b-e) POM images of PS-AuNRs in 8CB in a homeotropic flat cell; the sample is transitioning from the nematic to the smectic phase from b to e. ... 210
xxviii
1
Chapter 1
Introduction
Mastery over the assembly of nanoparticles is of the utmost importance for the
fabrication of novel devices for sensing, energy harvesting, cloaking, as well as a host of
others. A large range of parameters will have major implications in the final properties
achieved upon the assembly of the particles. Material type grants access to optical (e.g. Au,
CdSe), magnetic (e.g. Fe3O4), and thermoelectric (e.g. Si), properties, to name a few.
Physical characteristics, such as size and shape, dictate the strength and range of these
properties. For instance, Fe3O4 particles will lose their superparamagnetic properties as
their size increases. As another example, gold nanorods will have vastly different optical
properties from their spherical cousins. Finally, separation distance between assembled
particles will influence total properties of the assembly, where this effect is intertwined
with the material type and size. For example, when gold spheres plasmonically couple, the
strength of the coupling decays exponentially as separation increases. Therefore, control
over the material, shape, size, and separation of the particles is paramount to tune the
properties of the assembly.
Extant nanoparticle chemistry dictates the possible range of parameters that can be tuned
simultaneously. While isotropic particles (e.g., spheres) of a vast array of materials are well
studied, more exotic shapes (e.g., rods, wires, pyramids, cubes) have only recently been
synthesized with the ease and reproducibility to allow scientists beyond those inorganic
chemists to study them. As such, anisotropic particles have opened up new realms of
2
to their inherent anisotropy, these particles allow for facile surface chemistry control at
individual facets, which, in turn, allows for unique nanostructures to be formed by
bottom-up type assembly. Of course, surface chemistry dictates 1) dispersion state in various
solvents / matrices, 2) type of assembly (e.g., end-to-end or side-by-side), and 3) separation
distance between particles, which all significantly affect final properties. In this section, I
will discuss the synthesis routes for gold nanoparticles and nanorods, surface modification
techniques, how to achieve property control, and how to assemble particles in solution and
solid matrices, with a particular focus on gold nanorods.
1.1Gold Nanorod Synthesis
Spherical metal-nanoparticles have been utilized for centuries to create beautiful hues
in decorative pieces, particularly stained glass. The Lycurgus cup
Figure 1.1 ), the oldest such decorative piece, contains a small amount of gold and silver
nanoparticles probably formed by finely grinding gold and silver dust.(Freestone, Meeks
et al. 2007) At this time, the 4th century anno domini, the ancient artificers crafting this
piece had no real control over the size and shape of the minute particles used. As such, the
remaining pieces from this era display wildly different properties than the Lycurgus cup.
However, the process of making this stained glass developed over time such that repeatable
3
Figure 1.1 The Lycurgus cup being lit from behind. The red color is due to the presence of metal nanoparticles within the glass. Image taken from (Freestone, Meeks et al. 2007).
Centuries later, chemists have gained adroit control of not only the size, but also of the
shape of nanoparticles of a wide variety of materials. Spherical nanoparticles made of iron
oxide(Ozaki and Matijević 1985), silica(Stöber, Fink et al. 1968), cadmium sulfide(Petit,
Lixon et al. 1990), and gold(Faraday 1857) have been synthesized for decades. As
synthesis processes became better, control over the size became more exact and
reproducible such that monodisperse spherical particles are easily achievable for each of
these materials. From these synthesis studies came the ability to create new shapes of
nanoparticles; moving away from spheres to more anisotropic and/or exotic shapes such as
rods(Jana, Gearheart et al. 2001, Peng, Dong et al. 2002, Liu and Zeng 2003),
4
pyramids(Guha, Kar et al. 2004, Herring, AbouZeid et al. 2011), plates(Zhang, Li et al.
2011), and stars(Pandian Senthil, Isabel et al. 2008). Contemporaneously, the synthesis
processes for these shapes is being improved such that the ease of control of the syntheses
becomes similar to spherical synthesis. Gold nanoparticles, in particular, have received
significant attention due to their unique optical properties.
The modern synthesis of colloidal gold is relatively old. In 1857, Michael Faraday
described the dispersion of “diffused gold” as a “beautiful ruby fluid.” His description of
the synthesis is telling:(Faraday 1857)
If a pint or two of the weak solution of gold [chloride] before described be
put into a very clean glass bottle, a drop of the solution of phosphorous in
sulphide (sic) of carbon added and the whole well shaken together, it
immediately changes in appearance, becomes red, and being left for six or
twelve hours, forms the ruby fluid required; too much sulphide (sic) and
phosphorous should not be added, for the reduced gold then tends to clot
about the portions.
The method Faraday described some 160 years ago is still used today to produce gold
nanoparticles. For instance, Mirkin and co-workers add trisodium citrate dihydrate
(replacing Faraday’s phosphorus) to a solution of chloroauric acid (“chloride of gold”)
under heavy stirring (“well shaken”) to produce a deep red solution of spherical gold
nanoparticles.(McFarland, Haynes et al. 2004) Many other solution syntheses of gold
nanoparticles have been reported, but all bear striking resemblance to the method described
5
Gold nanoparticles provide the seeds from which gold nanorods blossom. The first
synthesis of gold nanorods was described by Esumi et al. in a 1995 paper.(Esumi,
Matsuhisa et al. 1995) Here, the authors UV irradiated a solution of
hexadecyltrimethylammonium chloride (HTAC), a cationic surfactant, and chloroauric
acid, which produced rod shaped gold nanoparticles. Later, in 1997, Yu et al.(Yu, Chang
et al. 1997) produced gold nanorods via an electrochemical method. In 2001, Jana et
al.(Jana, Gearheart et al. 2001) described the wet chemical synthesis of gold nanorods
using a seed-mediated growth method. First, spherical gold particles (ca. 3.5 nm) (seeds)
are produced by reducing gold chloride with sodium borohydride in the presence of
tri-sodium citrate. Next, gold chloride, cetrimonium bromide (CTAB), a cationic surfactant,
and ascorbic acid are added to the seed solution and gold nanorods are produced with
celerity. Figure 1.2 shows representative SEM image of gold nanorods from the synthesis
described above as well as a cartoon of the surfactant structure. Future syntheses
incorporate silver nitrate into the seed synthesis(Sau and Murphy 2004), an additional
surfactant(Nikoobakht and El-Sayed 2003), and salicylic or benzoic acids(Ye, Jin et al.
6
Figure 1.2 SEM image of as-synthesized gold nanorods cast onto a Si wafer. Cartoon of gold nanorods with blow up of CTAB cationic surfactant layer present on gold nanorods.
Note that the CTAB forms a bi-layer in water.
1.2Optical Properties
Metal nanoparticles have interesting optical properties. In the previous section, I
mentioned that Faraday found the colloidal gold to be a “beautiful ruby” color. The
Lycurgus cup, an opaque green under ambient light, shines a ruby red when illuminated
from the inside. The ruby color of both the solution and the cup are due to the same
phenomenon: localized surface plasmons. Surface plasmons occur when an
electromagnetic field interacts with conduction band electrons leading to the coherent
oscillation of electrons, which results in a strong absorption, the wavelength of which
depends upon the size and shape of the nanoparticle. Figure 1.3 shows a cartoon illustrating the plasmon resonance effect. The plasmon phenomenon is due to the size of
7
Mie(Mie 1908) first described the size-dependent scattering of spherical particles that had
been noted by Faraday.
Figure 1.3 Illustration of surface plasmons in the presence of resonant incident light. Figure reproduced from (Yasun, Kang et al. 2013).
Gold nanorods have two absorbance bands due to plasmon resonance that arise from
their shape.(Sharma, Park et al. 2009) Free electron oscillations can occur on both the long
and short axis of the gold nanorods. The transverse surface plamon resonance peak (TSPR)
is due to the electron oscillations on the diameter of the nanorods while the longitudinal
surface plasmon resonance peak (LSPR) is due to electron oscillations along the length of
the nanorods. The LSPR occurs at a higher wavelength than the TSPR and both peaks are
affected by the physical dimension of the nanorods. As aspect ratio (L/D) increases, the
LSPR peak strongly red-shifts while the TSPR undergoes a slight blue-shift, as can be seen
8
Figure 1.4 SEM image of aspect ratio (A.R.) 2 (blue), 4 (yellow), and 6 (green) and their respective extinction spectra. As A.R. is increased the LSPR peak undergoes a red-shift.
All scale bars are 100 nm. Figure reproduced from (Junxi, Lide et al. 2012).
Gold nanorod absorbance is affected by inter-rod spacing and orientation. A dispersion
of gold nanorods will behave, plasmonically, like an ensemble average of the individual
nanorods that make up the dispersion. However, when the nanorods are brought close
together, the oscillations of the surface electrons of one nanorod impinge upon those of an
adjacent nanorod, which results in a significant change in the absorbance. This
9
studied theoretically and experimentally by El-Sayed(Jain, Eustis et al. 2006),
Link(Slaughter, Wu et al. 2010), Funston and Mulvaney(Funston, Novo et al. 2009), and
Thomas.(Kumar, Wei et al. 2013) The absolute effect of plasmon coupling on the optical
properties depends on the separation distance between the nanorods, the angle between the
nanorods, and the number of nanorods in the assembly. Simply, a red-shift in the LSPR
peak will occur when nanorods are aligned end-to-end (i.e. longer rod), while a blue-shift
in the LSPR peak will occur when nanorods are aligned side-by-side (i.e. thicker rod). The
angle dependence is a bit less straight-forward, but two nanorods at 90 degrees will have a
LSPR peak somewhere between the LSPR peak of two nanorods end-to-end and two
nanorods side-by-side. As the gap between the nanorods decreases, the shift in the LSPR
band will be more dramatic, whether it be a blue or red-shift. Finally, increasing the number
of nanorods in the assembly will enhance the shift even more, but with diminishing returns
at higher rod number. Figure 1.5 shows the scattering of chains of gold nanorods linked
end-to-end as well as scattering when two nanorods are at different angles to each other.
Therefore, the optical properties of a dispersion of gold nanorods can be significantly tuned
10
Figure 1.5 SEM images of gold nanorod chains (a) and their respective scattering (b). As the number of nanorods in a chain is increased the scattering red-shifts. (c) shows the effect
of angle between the nanorods. The LSPR peak red-shifts as the angle becomes closer to
180 degrees. Scale bar is 250 nm. Figure reproduced from (Kumar, Wei et al. 2013).
Gold nanorods excited by light near their SPR peak will display significantly enhanced
electric fields. Liu et al.(Liu, Guyot-Sionnest et al. 2007) studied the field enhancement
around gold particles by finite difference time domain methods of different shapes: spheres,
spheroids, rods, and bipyramids. They found that while spheres enhanced the field six-fold,
gold rods enhanced the field more than 1000-fold with the strongest enhancement around
the ends. This field enhancement is useful for Raman spectroscopy, where the Raman
signal is proportional to the electric field to the power of 4. Raman spectroscopy is used to
detect molecules and, when coupled with surfaces that enhance the signal, is deemed
surface enhanced Raman spectroscopy (SERS). As such, gold nanorods have recently been
utilized in SERS studies. El-Sayed and co-workers(Nikoobakht, Wang et al. 2002) found
that dispersed gold nanorods enhanced the Raman scattering of various analytes by 103
-104-fold. In a later study(Nikoobakht and El-Sayed 2003), they found that aggregated gold
nanorods enhanced the Raman signal even more than dispersed nanorods. The added
enhancement could be explained by plasmon coupling. Just like single nanorods enhance
the electric field at their tips, nanorods that are close enough to plasmon couple enhance
the electric field in the gap between. The enhancement depends upon the orientation and
separation distance, with nanorods assembled end-to-end leading to the highest
11
reported enhancement of the Raman signal of an analyte by linking gold nanorods
end-to-end, as seen in Figure 1.6. They found that the more nanorods in the chain, the more enhanced the signal, due to the increased plasmon coupling.
Figure 1.6 The plot on the left shows how extinction and SERS enhancement changes as a function of number of nanorods per chain. The plot on the right is a heat map of the
electric field for chains of 2, 3, and 5 nanorods. Warmer colors indicate larger field
strengths. In the gap between nanorods field is significantly enhanced. Scale bars are 40
nm. Figure reproduced from (Lee, Andrade et al. 2011).
Gold nanorods can affect the fluorescence of adjacent materials. Fluorescence occurs
when the electron in the excited orbital is paired to the second electron in the ground-state
orbital and the excited electron returns to the ground state through emission of a
photon.(Lakowicz 2007) The fluorescence of a molecule can be quenched or enhanced
depending upon the molecule’s proximity to the gold nanorod surface. Orrit and
co-workers(Khatua, Paulo et al. 2014) studied the fluorescence of crystal violet, a weakly
12
of the crystal violet increased 1000s-fold when the SPR peak was close to the excitation
wavelength, as can be seen in Figure 1.7a and b. The enhancement is due to the SPR effect
and the enhancement of the electric fields surrounding the gold nanorods. Li et al.(Li, Qian
et al. 2009) studied the fluorescence of quantum dots bound to gold nanorods as a function
of separation distance. They found that the emission of the quantum dots was completely
quenched out to a separation distance of 5 nm, as can be seen in Figure 1.7c. The quenching
in this case is due to a Förster resonance energy transfer (FRET) between the quantum dot
and the gold nanorod. Therefore, the adaptability of the gold nanorod for either quenching
or enhancement of emission can be utilized for sensing applications.
Figure 1.7 Gold nanorods can both enhance and quench fluorescence emission of an analyte depending on the proximity to and position of the analyte relative to the gold
nanorod. a. FDTD simulation of the enhanced electric around a gold nanorod with an
analyte placed at the tip (red star). B. The fluorescence enhancement of the analyte as a
function of separation distance from the nanorod end. c. The fluorescence quenching of a
quantum dot as a function of separation distance from the gold nanorod surface. Figures a
and b reproduced from (Khatua, Paulo et al. 2014) and c reproduced from (Li, Qian et al.