Infogain Publication (Infogainpublication.com) ISSN : 2454-1311
RF Based Complex Impedance Measurement
Jyoti Mishra
1, Ritula Thakur
2, Babankumar Bansod
31,2
Department of Electrical Engineering, NITTTRChandigarh, India
3Department of Agrionics, CSIR- CSIOChandigarh, India
Abstract— Quality of food is determined in terms of food texture, taste and appearance butmoisture content (MC) of food is a determination factor of quality & stability of the processed food. Complex impedance measurement has
several advantages over conventional moisture
measurement methods and can be used for portable moisture measurement. This paper presents the Auto Balancing Bridge Circuitry to determine the complex impedance of the grain sample for moisture analysis. The complex impedance measurement has been done using Auto Balancing Bridge method. Experimentation has been done to reduce the losses of internal ABB circuit so that it can provide measurements at high frequency range. At lower radio frequencies, density- independent moisture content determination is achievable with multiple-frequency measurement. Due to operational amplifier’s limitations at higher frequencies, proper design of ABB circuit is very crucial in the proposed circuit. Hence, ABB circuit in was simulated in Multisim& best opamp was selected.
Keywords— Complex impedance measurement, auto balancing bridge method, moisture content.
I. INTRODUCTION
The Food and Agriculture Organization of the United Nations (FAO) gauges that 32 percent of all food delivered on the planet was lost or squandered in 2009. This evaluation is taking into account weight. At the point when changed over into calories, worldwide food misfortune and waste adds up to pretty nearly 24 percent of all nourishment delivered. Basically, on out of each four food calories proposed for individuals is not consumed by them.. Economically, they represent a wasted investment that can reduce farmer’s income and increase consumer’s expenses. Environmentally, food loss and waste inflict a host of impacts, including unnecessary greenhouse gas emissions and inefficient used water and land, which in turn can lead to diminished natural eco systems and the services they provide. Quality of food is determined in terms of food texture, taste and appearance but moisture content of food is the prime determination factor quality & stability of the processed food.
Moisture content of the food material is important to consider whether the food is suitable before its consumption because moisture content affects the physical and chemical aspects of food which relates with the freshness time. Standard methods for determining moisture in grain require oven drying for specific time periods at specific time periods at specified temperatures by prescribed methods. Because such methods are tedious, time consuming, and expensive, they are not suitable for general use in the grain trade, and hence other rapid testing methods have been developed.
Kandala et. Al in [1] have presented a laboratory based electronic instrument that measures the complex impedance of a parallel plate capacitor with a sample of peanut kernels between its plates. The author used the measured values in empirical equation to estimate the moisture content of the sample which were in good agreement with the values obtained through the standard air oven method. For a similar purpose an impedance analyzer has also been designed that too determines the moisture content in peanuts. These values obtained by the presented design in [2] were also in agreement with the standard air oven method. Similar techniques are presented in [3] where the author presents a low cost instrument to measure the impedance and phase angle along with a parallel plate capacitance system to determine the moisture content in yellow corn. This impedance spectroscopy is highly used in real time applications in measuring moisture content in various packaged food product such as cookie dough as in [4], where the author conducted experiments with concentric ring dielectric sensor in frequency range from 10 Hz to 10 KHz. The author calibrated the system with a linear model in which the dependence of capacitance and moisture content is determined. These methods as presented in [2] and [3] are non-destructive methods that provide rapid results and have considerable applications both in drying and storage processes of corn and grain and peanuts products.
Infogain Publication (Infogainpublication.com) ISSN : 2454-1311 develop a digital sustainable and portable grain moisture
meter based on complex impedance measurement.
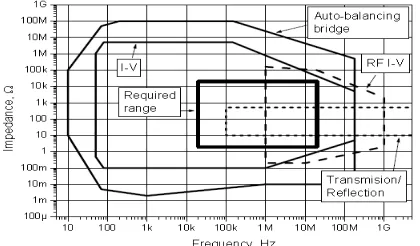
A variety of methods for impedance measurement exists [6]: bridge, resonant, I-V, RF I-V, network anlaysis. The bridge method exhibits high accuracy, but due to the need of balancing this method we consider not suitable for our application. Resonant method is achieving good for our application. Resonant method is achieving good accuracy in quality of inductance measurement, but there is a need for resonance tuning. It can be considered as an option for few measurements as it was done in [7], but it is suitable for low cost automated system. The data analysis indicates that I-V and auto balancing bridge methods look the most promising. We will concentrate on the auto balancing bridge method because of its good and accurate performance among high frequency and impedance ranges.
Fig. 1: Impedance measurement methods characterization
II. METHODOLOGY
2.1.Basic Principle
The basic principle behind the measurement of complex impedance measurement is the measurement of impedance of a circuit which is generally defined as the total opposition a device or circuit provides to the flow of AC current at a given frequency.
Fig. 2:Basic Impedance Measurement
wL fL XL = 2Π =
wC fC X c
1 2
1 = Π =
= =
= + =
θ θ sin cos
Z X
Z R
Z jX R Z
=
+ =
− R X X R Z
1 2 2
tan
θ
Here, we are using ABB for impedance measurement. The ABB method is commonly used in modern LF impedance measurement instruments. Its operational frequency range has been extended up to 110 MHz [10].
2.2.ABB Method
The ABB employs the inverting topology operational amplifier. Basically, in order to measure the complex impedance of the DUT, it is necessary to measure the voltage of the test signal applied to the DUT and the current that flows through it. Accordingly, the complex impedance of the DUT can be measured with a measurement circuit consisting of a signal source, a voltmeter, and an ammeter as shown in figure 3(a). The voltmeter and ammeter measure the vectors (magnitude and phase angle) of the signal voltage and current, respectively.
Fig 3(a):The simplest model of ABB for impedance measurement
Fig 3(b):Impedance measurement using operational amplifier
The test signal current (Ix) flows through the DUT and also
Infogain Publication (Infogainpublication.com) ISSN : 2454-1311 ground. The I-V converter output voltage (Vr) is
represented by the following equation:
. .
r r r x r
V = I R = I R (i)
Ix is determined by the impedance (Zx) of the DUT and the voltage Vx across the DUT as follows:
x x
x
V
I
Z
=
(ii)From the equations (i) and (ii), the equation for impedance (Zx) of the DUT is derived as follows:
.
x x
x r
x x
V V
Z R
I Z
= = (iii)
The vector voltages Vx and Vr are measured with the vector voltmeters as shown in figure 2(b).Since the value of Rr is known, the complex impedance Zx of the DUT can be calculated by using equation (viii). The Rr is called the range resistor and is the key circuit element, which determines the impedance measurement range. The Rr value is determined using the formulae given as follows
= .
( ) !"#$
Where: %&' is the peak voltage of selected output ranges
()*+is the minimum impedance GAIN is the selected gain
%,,is the supply voltage and the DCOFFSET Voltage is the voltage for selected impedance range [8].
In the impedance measurement system the Direct Digital Synthesizer module (AD9958) is being used for generation of power supply frequency which can be load into controller. The DDS gives 2V analog signal at different frequencies, which are applied to ABB circuitry and Gain- Phase detector (AD8302). The op-amp is selected based on simulation result obtained by Multisim. The output of ABB is measured voltage, which is second input of AD8302. The AD8302 directly gives voltage ratio and phase difference of applied signal. From these voltages and phase, the impedance of the sample can be calculated, which gives accurate and non-destructive measurement of complex impedance of sample.
III. RESULTS
We have simulated ABB circuit in multisim as shown in figure, using different operational amplifiers.
Simulation with Op amp AD8001A
Simulation with Op amp AD644KHJ
Simulation with Op amp OPA657
Infogain Publication (Infogainpublication.com) ISSN : 2454-1311
Simulation with Op amp LM12LK
Fig. 4. Schematics of ABB in Multisim
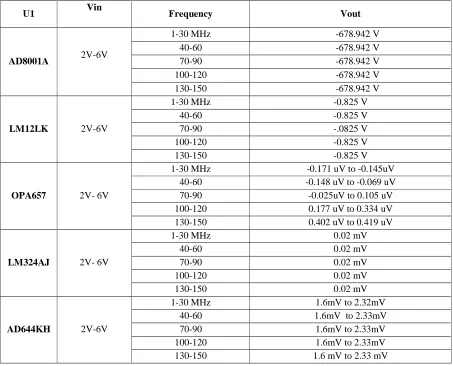
Here we have used power supply in the range 2V to 6V with frequency ranging from 1 MHz to 150 MHz. Here U1 is the operational amplifier. Table 1 shows different output voltages at different frequencies. The best results with more
stability of output voltage is obtained with OPA657 at higher frequency ranges.We have used OPA657 with reference resistor of 5Ω. So, we obtained voltage in terms of V, as per our requirements.
Table 1:Op-amp comparison at different frequencies
U1 Vin Frequency Vout
AD8001A 2V-6V
1-30 MHz -678.942 V
40-60 -678.942 V
70-90 -678.942 V
100-120 -678.942 V
130-150 -678.942 V
LM12LK 2V-6V
1-30 MHz -0.825 V
40-60 -0.825 V
70-90 -.0825 V
100-120 -0.825 V
130-150 -0.825 V
OPA657 2V- 6V
1-30 MHz -0.171 uV to -0.145uV 40-60 -0.148 uV to -0.069 uV 70-90 -0.025uV to 0.105 uV 100-120 0.177 uV to 0.334 uV 130-150 0.402 uV to 0.419 uV
LM324AJ 2V- 6V
1-30 MHz 0.02 mV
40-60 0.02 mV
70-90 0.02 mV
100-120 0.02 mV
130-150 0.02 mV
AD644KH 2V-6V
1-30 MHz 1.6mV to 2.32mV
40-60 1.6mV to 2.33mV
70-90 1.6mV to 2.33mV
100-120 1.6mV to 2.33mV
Infogain Publication (Infogainpublication.com) ISSN : 2454-1311
IV. CONCLUSION
The existence of high correlation between the dielectric properties of grain and amount of water present in the grain at radio frequencies has facilitated the rapid and non- destructive sensing of moisture content. At lower radio frequencies, density-independent moisture content determination is achievable with multi- frequency measurement. Due to the limitations of operational apmplifier at high frequencies ABB circuit is very crucial in the proposed circuit. So, we have to simulate ABB circuit in Multisim& using different operational amplifiers it is found that OPA657 is best suited for our application as it is a low noise, high gain BW product of about 1600 MHz.
ACKNOWLEDGEMENTS
Authors are thankful to Director, CSIR-CSIO, Chandigarh for his support andpermission to carry out this work.
REFERENCES
[1] Chari V. K. Kandala, Chris L. Butts and Stuart O. Nelson, “Capacitance Sensor for Nondestructive Measurement of Moisture Content in Nuts and Grain”, IEEE Transactions on Instrumentation and measurement, Vol. 56, No. 5, October 2007.
[2] Chari V. Kandala and Chris L. Butts, “Design and Performance Of An Impedance Analyzer For Nondestructive Moisture Content Determination Of In-Shell Peanuts”, SAS 2008 – IEEE Sensors Applications Symposium Atlanta, GA, February 12-14, 2008.
[3] Jaya Sundaram and Chari V. Kandala, “Estimating the Moisture Content Of Grain From Impedance And Phase Angle Measurements”, SAS 2009 – IEEE Sensors Applications Symposium New Orleans, LA, USA - February 17-19, 2009.
[4] X. Li, A. S. Zyuzin, and A. V. Mamishev, “Measuring moisture content in cookies using dielectric spectroscopy”, Conference on Electrical Insulation and Dielectric Phenomena, 2003.
[5] V. Dumbrava, L. Svilainis, “ The automated Complex Impedance Measurement System”, Electronics and Electrical Engineering, Vol. 4, No. 76, pp. 59-62, 2007.
[6] Impedance Measurement Handbook, Agilent Technologies Co. Ltd. USA- 2003.
[7] Sheen J., “Study of microwave dielectric properties measurement by various resonance techniques Measurement. 2005. Vol. 37, No. 2. pp. 123-130.
[8] Analog Devices, “AN-1252, Application Note”, Rev. 0, pp. 1-12.
[9] Jianwei Qin, Kuanglin Chao, Moon S. Kim, Renfu Lu and Thomas F. Burks, “Hyperspectral and multispectral imaging for evaluating food safety and quality”, ELSEVIER Journal of Food Engineering, 2013, pp. 157–171.
[10]Di Wu and Da-Wen Sun, “Advanced applications of hyperspectral imaging technology for food quality and safety analysis and assessment: A review — Part I: Fundamentals”, ELSEVIER Innovative Food Science and Emerging Technologies, 1-14, 2013.
[11]Ying Zhou, Hanping Mao and Xiaodong Zhang, “Hyperspectral Imaging Technology for Detection of Moisture Content of Tomato Leaves”, 4th International Congress on Image and Signal Processing, 2011.