Asian J. Med. Biol. Res.2015, 1 (2), 316-335; doi: 10.3329/ajmbr.v1i2.25627
Asian Journal of
Medical and Biological Research
ISSN 2411-4472 (Print) 2412-5571 (Online)www.ebupress.com/journal/ajmbr
Article
Segregation pattern and inbreeding depression in F
2generation of some hybrid
okra varieties
Sonia Akter Laboni1, S.M. Ahsan2, Shepon Chandra Ghosh3, Eftekhar Mahmud4, MostafizurRahman Talukder5, Soleh Akram6,Sayeed Shahriyar7 and Abdulla-Al-Asif8*
1
Department of Genetics and Plant Breeding, Faculty of Agriculture, Patuakhali Science and Technology University, Bangladesh
2
Department of Horticulture, Faculty of Agriculture, Patuakhali Science and Technology University, Bangladesh
3
Department of Crop Botany, Faculty of Agriculture, Bangladesh Agricultural University, Mymensingh-2202, Bangladesh
4
Scientific Officer, Bangladesh Agricultural Research Institute, Gazipur, Bangladesh 5
Principal Scientific Officer, Bangladesh Agricultural Research Institute, Gazipur, Bangladesh 6
Department of Genetics and Plant Breeding, Faculty of Agriculture, Bangladesh Agricultural University, Mymensingh-2202, Bangladesh
7
Department of Biotechnology, Faculty of Agriculture, Bangladesh Agricultural University, Mymensingh-2202, Bangladesh
8
Department of Aquaculture, Faculty of Fisheries, Bangladesh Agricultural University, Mymensingh-2202, Bangladesh
*Corresponding author: Abdulla-Al-Asif, Department of Aquaculture, Faculty of Fisheries, Bangladesh Agricultural University, Mymensingh-2202, Bangladesh. Mobile: +8801716838294; E-mail: [email protected]
Received: 28 July 2015/Accepted: 13 September 2015/Published: 30 September 2015
Abstract: An experiment was conducted in randomized complete block design (RCBD) with three replications in the experimental field of Regional Horticulture Research Station (RHRS), Bangladesh Agriculture Research Institute (BARI), Lebukhali, Patuakhali during April, 2014 to October, 2014 for assessing the inbreeding depression, genetic parameters, gene action and segregation pattern of Okra [Abelmoschusesculentus (L.) Moench]. The experiment was comprised of five commercial hybrid Okra genotypes such as Tara sonali, Bimala, Juboraj, Suvo 1and Noor, their respective F2 progenies along with a check variety named as BARI Dherosh 1. Results of the experiment indicated that there were considerable variability among the F1 and their F2. The yield were in-between 14.81 to 7.92 Kg plot
-1
in case of F1 generation, which deteriorate to 10.32 to 5.32 Kg plot-1 in F2 generation. Broad sense heritability computed through variance component method showed that all the quantitative traits were moderate to highly heritable. The trait yield per plot exhibited 68.83% broad sense heritability coupled with 50.96% genetic advance suggesting the existence of sufficient amount of genetic variability for improvement of this trait and also indicates that the trait is more amenable to selection and could be improved easily. In case of segregation pattern, plant height and pod pubescence content exhibit as polygenic trait. Leaf shape, fruit base shape and branching pattern showed complete dominance and fruit color displayed incomplete dominance. The present investigation thus provide information about the nature and magnitude of genetic variation, segregation pattern and inbreeding depression for yield and its components in okra so as to formulate suitable breeding strategy and isolate potential parents and promising crosses for further breeding program.
1. Introduction
Okra [
Abelmoschusesculentus
(L.)Moench] is a member under Malvaceae Family and is also known as
Lady’s finger. It is an annual vegetable crop grown from seed in tropical and sub-tropical parts of the
world (Tahkur and Arora, 1986). Okra is a nutritious and delicious vegetable, fairly rich in vitamins
and minerals. Per 100 gm. of edible portion of pod have moderate levels of vitamin A (0.01 mg) and C
(18 g), calcium (90 mg), phosphorus and potassium. The content of thiamine (0.07 mg), riboflavin
(0.08 mg) and niacin (0.08 mg) per 100 g edible portion of pod is higher than that of many vegetables
(Rashid, 1990).
Abelmoschus
spp.is predominantly annual. Owing to their floral morphology and the
absence of a self-incompatibility system, they are generally regenerated through selfing. However,
depending on the species or variety, season and location, varying degree of outcrossing (up to 6(%)
occurs in okra. Bees
(Apismellifera
and
A. cerana)
appear to be the main vectors of pollen. Such a level
of out crossing will maintain a considerable amount of heterozygosity and heterogeneity, eventually
resulting in off-type segregants during repeated multiplication cycles. Since okra is an autogamous
crop, the breeding methods suitable for the self-pollinated crops can usefully be employed in this crop
also. The crop offers several features
viz.
adaptability to wide range of climatic conditions, erect
growing habit, short life span, large size flower and monoadelphous and epipetalous nature of stamens
which have a great value to breeder in achieving quick genetic results. Large size flowers and
monoadephours condition of stamens facilitate hand emasculation. Its capsule produces a large number
of seeds which is also a desirable feature for hybrid seed production. Being a short duration crop, it is
possible to grow two generations in a year. Despite these qualities, no systematic studies have been
made to generate information on quantitative traits which may be directly or indirectly related to yield
and further improvement of this crop.Genetic variability in the population is the most important
prerequisite of any breeding program. Variability, only accounts for the observable phenotypic
differences, which may be of genetic and environmental. Higher variability has better chance for
selecting the desirable genotypes. Furthermore, the partitioning of total variability into its heritable and
non-heritable components enables us to know the effectiveness of selection. Heritability, which
indicates the transmissibility of the character from parent to offspring, is a useful measure for
considering the ratio of genetic variance to the total variance. It may be based on total genetic variance
and additive genetic variance, where latter is more important in selection breeding. Heritability
indicates the possibility and extent to which improvement can be brought about through selection and
it may be of broad and narrow senses.However, heritability alone does not provide the true picture of
genetic improvement to be made in subsequent generations. It is the genetic advance which predicts
speed of genetic improvement for a particular intensity of selection. Heritability coupled with genetic
advance is more useful, and as heritability and phenotypic variation increases, the genetic advance also
increases. Thus, the primary requirement of a plant breeder is to have information on the genetic
advance and direct and indirect influences of the plant characters on yield. The nature and degree of
association between yield and its attributes claims distinct importance which assist the breeder to
ascertain the actual yield components and furnish an effective basis of phenotypic selection.Inbreeding
depression defines to decrease in fitness and vigor due to inbreeding effect. It increases homozygosity
in the genotype by continuous selfing. It results due to fixation of undesirable recessive genes in F
2.
While in case of heterosis, favorable dominant genes of one parent are masking the effect of recessive
genes of other parent. The present investigation was, therefore, undertaken with a set of self-crosses to
elicit information about the nature and magnitude of genetic variation, segregation pattern and
inbreeding depression for yield and its components in okra so as to formulate suitable breeding
strategy and isolate potential parents and promising crosses for further exploitation.
2. Materials and Methods
2.1. Location and description of the experimental site
2.2. Experimental materials
A total of eleven materials were used in this experiment. Among the materials, five were commercial F1 okra varieties; five were their F2 generations and one check variety. The okra variety used in the experiment was Tara Sonali, Bimala, Noor, Suvo-1 and Juboraj and their F2 derivatives with the cheak variety BARI Dherosh 1.F2 seeds were collected from Regional Horticulture Research Station (RHRS), Lebukhali, Dumki, Patuakhali and F1’s were collected from different seed retailers of Barisal.
2.3. Layout and design of experiment
The experiment was laid out in RCBD with three replications. The whole field was divided into three blocks and each block consisted of eleven (11) plots. The replications were separated from one another by 1 m. The distance between plots was 50 cm. The treatment was randomly assigned to each of the block. However, Each F1 and its respective F2 were planted side by side. Plot size for F1’s and checks variety was 1m x 4m.
2.4. Collection of data
Morphological data were collected from five randomly selected plants for each accession based on International Board for Plant Genetic Resources (IBPGR) recommended descriptor procedures for Okra (Charrier, 1984). Data were collected as specified. These are:
2.4.1. Days to 50% flowering
Recorded as days from sowing to flowering when 50% of the plant of each plot flowered.
2.4.2. First harvesting date
Recorded as days from sowing to 1st harvesting when fruit become edible.
2.4.3. Node order of 1st flowering
Node order of 1st fruiting of ten randomly selected plants was counted at fruit setting from the 1st node of the plant to the 1stfruiting node.
2.4.4. No of fruit per plant
Mean number of green pods of selected plants from each plot was recorded.
2.4.5. Fruit weight
Mean weight of ten randomly selected green fruit from each plot were measured in gram (g).
2.4.5. Plant height
Plant height is measured in centimeter (cm) by a meter scale at harvest from the point of attachment of the leaf to the ground level up to the tip. It was classified into 6 classes namely; 60-90 cm, 90-120 cm, 120-150 cm, 150-180 cm, 150-180-210cm and 210-240 cm. Number of plant per class were counted and recorded.
2.4.6. Fruit Length
Ten randomly selected pods from each plot were taken and length was recorded by a meter scale in cm and finally mean was calculated.
2.4.7. Fruit Diameter
Mean diameter of 10 randomly selected pods from each plot were measured in cm with the help of slide calipers.
2.4.8. Yield per plot
The weight of individual fruit was recorded during each fruit harvesting and was continued up to final harvesting. Thus, total weight was calculated to get fruit weight per plot and expressed in kilogram.
2.4.9.Internodal length
2.5. Statistical analysis
Analysis of variance was done for all the characters under study using the mean values (Singh and Chaudhury, 1985). Duncan's Multiple Range test (DMRT) was performed for all the characters to test the difference between the means of the genotypes following Steel and Torrie (1960).
i) Estimation of genotypic and phenotypic variances
Genotypic and phenotypic variances were estimated according to the formula given by Johnson et al. (1955).
Genotypic variance Where,
GMS = Genotypic mean square EMS = Error mean square r = Number of replication
Phenotypic variance Where,
= genotypic variance EMS = Error mean square
ii) Estimation of genotypic co-efficient of variation (GCV) and phenotypic co-efficient of variation (PCV) : Genotypic and phenotypic co-efficient of variation were estimated according to Burton, 1952; Singh and Chaudhury, 1985.
Where
Genotypic variance Population mean Similarly,
Where,
Phenotypic variance Population mean
iii) Estimation of heritability
Heritability in broad sense was estimated using the formula suggested by Johnson el al. (1955) and Hanson, et al. (1956).
Where
Genotypic variance Phenotypic variance
iv) Estimation of genetic advance
Expected genetic advance under selection was estimated using the formula suggested by Johnson et al. (1955).
Where
Genotypic variance
Phenotypic variance
Phenotypic standard deviation.
v) Estimation of genetic advance in percent of mean
Genetic advance in percent of mean was calculated as proposed by Comstock and Robinson (1952).
Where,
GA = genetic advance X = population mean
2.5.1. Estimation of inbreeding depression
Inbreeding depression was measured using F1 and F2 means values according to the following formula:
2.5.2. Estimation of segregating pattern
The selfing ratio was tested using a chi-square test (Panse and Sukhatme, 1985). The confirmation of ratios obtained in F2 segregating populations was done by the ratios obtained fromF1 generation.
Where,
O = Observed value E = Expected value
When the calculated value of χ2 was less than the table value at (n—1) degree of freedom, the fit was considered to be good or the assumed ratio was correct. Conversely, when the calculated value was more than the table value, the fit was not good and the assumed ratio was not correct. Probability values were recorded for these ratios (Deokar, 1964) for their respective test crosses ratios.
3. Results
3.1. Performance of F1 and F2 progenies
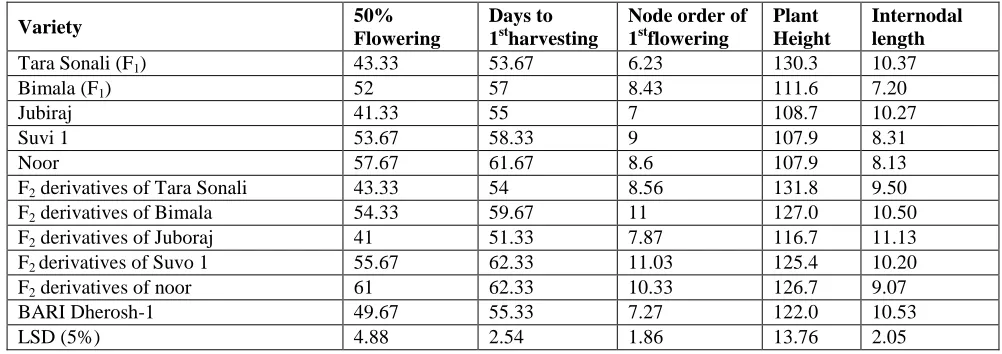
Days to 50 % flowering were ranged from 39.00 days after sowing to 62.00 days after sowing with mean value 50.27. Maximum days required for 50% flowering in F2 generation of Noor which was followed by Noor (F1) itself. Minimum days for 50% flowering were obtained in F2 progeny of Juboraj (41 DAS). In most cases, the F2 progenies took more time for 50% flowering then their respective F1. However, in Juboraj it was almost similar in two generations.
Table 1. Mean performance of 5 okra genotypes and their F2 derivative in respect of days to 50%
flowering, days to 1st harvesting, node order of 1st flowering, plant height and internodal length.
Variety 50%
Flowering
Days to
1stharvesting
Node order of
1stflowering
Plant Height
Internodal length
Tara Sonali (F1) 43.33 53.67 6.23 130.3 10.37
Bimala (F1) 52 57 8.43 111.6 7.20
Jubiraj 41.33 55 7 108.7 10.27
Suvi 1 53.67 58.33 9 107.9 8.31
Noor 57.67 61.67 8.6 107.9 8.13
F2 derivatives of Tara Sonali 43.33 54 8.56 131.8 9.50
F2 derivatives of Bimala 54.33 59.67 11 127.0 10.50
F2 derivatives of Juboraj 41 51.33 7.87 116.7 11.13
F2 derivatives of Suvo 1 55.67 62.33 11.03 125.4 10.20
F2 derivatives of noor 61 62.33 10.33 126.7 9.07
BARI Dherosh-1 49.67 55.33 7.27 122.0 10.53
LSD (5%) 4.88 2.54 1.86 13.76 2.05
Days to 1st harvest ranged from 62.33 DAS to 51.33 DAS with mean value 57.33. Maximum days required for 1st harvesting was in F2 progeny of Suvo 1 and Noor which was 62.33 DAS. Minimum days for 1
st
progenies then their respective F1 progenies but in Juboraj F2 progeny took less time than its F1 for 1stharvesting.Node order for 1st flowering ranged from6.23 to 11.03 and there was significant variation among the genotypes for the characters. 1st flowering was obtained in 11th node in F2progeny of Bimala and Suvo-1, and in Tara sonali (F1), it was found in 6
th
node. Significant variation was observed for the character number of fruit per plant. Number of fruit per plant ranged from 6.93 to 15.37. Maximum fruiting was found in Tara sonali (F1) and minimum in F2 progeny of Noor. In all cases, number of fruit was higher in F1 then their respective F2 progenies.
There was significant variation among the materials for individual fruit weight. Maximum fruit weight was found in Juboraj (F1) (21.23g) which was almost similar in Noor (F1) (21g). Smallest fruit was found in F2 progeny of Suvo-1 (15.53 g). Mean value for this character was 17.86 g. in all cases F1 produced larger fruit then their respective F2 progenies.
Table 2. Mean performance of 5 okra genotypes and their F2 derivative in respect of number of fruit per
plant, fruit weight, fruit length, fruit diameter and yield.
Number of fruit per plant Fruit weight Fruit length Fruit diameter Yield
Tara Sonali (F1) 15.37 15.63 18,78 1.43 12.09
Bimala (F1) 11.43 18.63 14,57 1.40 10.65
Jubiraj 13.9 21.23 16.06 1.70 14.81
Suvi 1 9.23 17.83 15.37 1.49 8.24
Noor 7.53 21 13.30 1.50 7.92
F2 derivatives of Tara Sonali 11.97 17.27 13.77 1.63 10.32
F2 derivatives of Bimala 7.4 16.8 12.99 1.30 6.27
F2 derivatives of Juboraj 10.43 17.77 13.53 1.40 9.32
F2 derivatives of Suvo 1 6.96 15.53 13.96 1.42 5.42
F2 derivatives of noor 6.93 15.27 11.98 1.27 5.32
BARI Dherosh-1 11.23 19.53 12.37 1.31 10.92
LSD (5%) 3.02 2.37 1.93 0.21 3.14
Plant height ranged from 107.9 cm to 131.8 cm and variation for this character was highly significant. Maximum plant height was found in F2 progeny of tarasonali (131.8 cm and minimum was found in Noor (F1) and Suvo-1 (F1) (107.9 cm).in all cases, F1 produced smaller plant than their respective F2 progenies.
Significant variation was obtained for intermodal length. This value ranged from 7.20 cm to 11.13 cm. Maximum node length was found in F2 progeny of Juboraj (11.13 cm) and minimum in Bimala (F1) (7.20 cm). in Tara sonali, internodal length decreased in F2. But in all other cases, this value increased in F2 than their respective F1.
Table 3. Analysis of variance (mean squares) for different characters.
Source d.f 50%
flowering
1st
harvestin g date
Node
order of 1st
flowering
No of
fruit per plant Fruit weight plant height internod al length Fruit Lengt h Fruit Diam eter Yield
Replication 2 27.36 7.48 1.27 11.65 7.39 250.57 0.61 3.73 0.01 20.73
Treatment 5 147.72** 43.60** 7.59** 24.95 12.97** 254.56** 4.58* 11.13* 0.05* 26.00**
Error 10 8.23 2.22 1.19 3.14 1.94 65.28 1.45 1.29 0.02 3.40
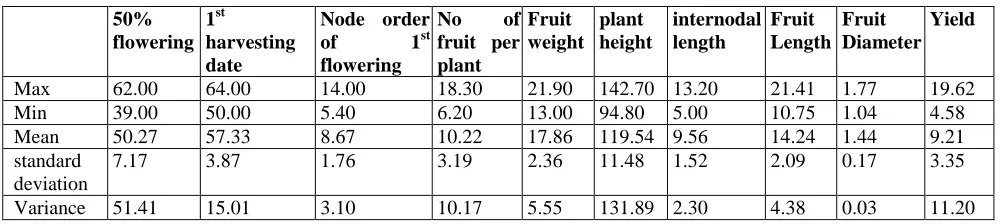
Table 4. Maximum, minimum, mean and standard deviation.
50% flowering
1st
harvesting date
Node order
of 1st
flowering
No of
fruit per plant Fruit weight plant height internodal length Fruit Length Fruit Diameter Yield
Max 62.00 64.00 14.00 18.30 21.90 142.70 13.20 21.41 1.77 19.62
Min 39.00 50.00 5.40 6.20 13.00 94.80 5.00 10.75 1.04 4.58
Mean 50.27 57.33 8.67 10.22 17.86 119.54 9.56 14.24 1.44 9.21
standard deviation
7.17 3.87 1.76 3.19 2.36 11.48 1.52 2.09 0.17 3.35
Fruit length showed significant variation among the materials. This value ranged from 11.98 cm to 18.78 cm. longest fruit was obtained in Tara sonali (F1) (18.78 cm) and shortest fruit was found in F2 progeny of Noor (11.98 cm). Fruit length was decreased in F2 progenies then their respective F1’s.
There was significant variation for fruit diameter. Fruit diameter ranged from 1.27 cm to 1.70 cm. maximum fruit diameter was found in Juboraj (F1) and minimum in F2 progeny of Noor. In Tara sonali, fruit diameter increased in F2 progeny but for other cases it was reduced in F2. Significant variation was obtained for yield per plot. Yield ranged from 5.32 kg per plot to 14.81 kg per plot. Maximum yield was obtained from Juboraj (F1) (14.81 kg) and minimum yield was found in F2 progeny of Noor (5.32 kg). Yield reduced in F2 progenies than their respective F1’s.
3.2. Heritability, genetic advance and genetic advance in percentage of mean
The genotypic, phenotypic and environmental variance, genotypic co-efficient of variation (GCV), phenotypic co-efficient of variation (PCV), heritability in broad sense (h²b %), genetic advance (GA) and genetic advance in percent of mean (GA %) for all the quantitative characters under study are presented in table 6 respectively. The phenotypic co-efficient of variation (PCV) were higher than their corresponding genotypic co-efficient of variation (GCV) for all the characters studied indicating that they all interacted with the environment to some intent. Genetic parameters in respect of all characters are presented below:
3.2.1. 50% flowering
In case of first filial generation, genotypic (13.56%) and phenotypic (14.72%) co-efficient of variation was moderate for days to 50% flowering in the present study. Days to 50% flowering exhibited low heritability (25.75%) in broad sense (h2b) coupled with moderate genetic advance in percentage of mean (12.95).
3.2.2. Days to 1st harvesting
Genotypic (6.48%) and phenotypic (6.98 %) co-efficient of variation was low for days to 1st harvesting in the present study. Days to 1st harvesting exhibited low heritability (12.39 %) in broad sense (h2b) coupled with low genetic advance in percentage of mean (7.10).
3.2.3. Node order of 1st flowering
Genotypic (16.86%) and phenotypic (21.03%) co-efficient of variation was moderate for node order of 1st flowering in the present study. Node order of 1st flowering exhibited low heritability (27.83%) in broad sense (h2b) coupled with low genetic advance in percentage of mean (2.41).
3.2.4. Number of fruit per plant
Genotypic (26.38%) and phenotypic (31.58%) co-efficient of variation was high for number of fruit per plant. Number of fruit per plant exhibited moderate heritability (45.40%) in broad sense (h2b) coupled with low genetic advance in percentage of mean (4.64).
Table 5.Variance, co-variance, heritability, genetic advance and genetic advance in percentage of mean.
S²G S²E S²P PCV GCV GA % GA h² (Broad Scene) 50% flowering 46.50 8.23 54.73 14.72 13.56 0.85 12.95 25.75
1st harvesting date 13.79 2.22 16.01 6.98 6.48 0.86 7.10 12.39 Node order of 1st flowering 2.13 1.19 3.32 21.03 16.86 0.64 2.41 27.83 No of fruit per plant 7.27 3.14 10.41 31.58 26.38 0.70 4.64 45.40 Fruit weight 3.67 1.94 5.62 13.27 10.73 0.65 3.19 17.88 plant height 63.09 65.28 128.37 9.48 6.64 0.49 11.47 9.60 internodal length 1.05 1.45 2.49 16.51 10.69 0.42 1.36 14.26 Fruit Length 3.28 1.29 4.57 15.01 12.72 0.72 3.16 22.21 Fruit Diameter 0.01 0.02 0.03 11.85 7.84 0.44 0.15 10.68 Yield per plot 7.53 3.40 10.94 35.92 29.81 0.69 4.69 50.96
3.2.5. Fruit weight
3.2.6. Plant height
Genotypic (6.64%) and phenotypic (9.48%) co-efficient of variation was low for plant height. Plant height exhibited low heritability (9.60%) in broad sense (h2b) coupled with moderate genetic advance in percentage of mean (11.47) (Table 5).
3.2.7. Internodal length
Genotypic (10.69%) and phenotypic (16.51%) co-efficient of variation was moderate for internodal length in the present study. Internodal length exhibited low heritability (14.26%) in broad sense (h2b) coupled with low genetic advance in percentage of mean (1.36) (Table 5).
3.2.8. Fruit length
Genotypic (12.72%) and phenotypic (15.01%) co-efficient of variation was moderate for fruit length. Fruit Length exhibited low heritability (22.21%) in broad sense (h2b) coupled with low genetic advance in percentage of mean (3.16) (Table 5).
3.2.9. Fruit diameter
Genotypic (7.84%) and phenotypic (11.85%) co-efficient of variation was low for fruit diameter in the present study. Fruit diameter exhibited low heritability (10.68%) in broad sense (h2b) coupled with low genetic advance in percentage of mean (0.15) (Table 5).
3.2.10. Yield
Genotypic (29.81%) and phenotypic (35.92%) co-efficient of variation was high for yield per plot. Yield per plot exhibited moderate heritability (50.96%) in broad sense (h2b) coupled with low genetic advance in percentage of mean (4.69) (Table 5).
3.3. Inbreeding depression
Inbreeding is a system of mating that leads to an increase in homozygosity, decline in vigor and the reduction in productivity. Inbreeding depression may be defined as the reduction or loss in vigour and fertility as a result of inbreeding. The character wise results of inbreeding depression in F2 generation are given as under.
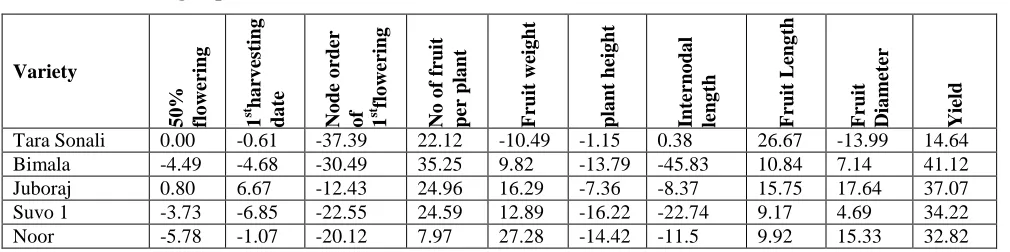
Table 6. Inbreeding depression (%) for different characters.
Variety 5 0 % flo wer ing 1 st ha rv esting da te No de o rder o f 1 st flo wer ing No o f fruit per pla nt F ruit weig ht pla nt heig ht Inte rno da l leng th F ruit L eng th F ruit Dia met er Yield
Tara Sonali 0.00 -0.61 -37.39 22.12 -10.49 -1.15 0.38 26.67 -13.99 14.64
Bimala -4.49 -4.68 -30.49 35.25 9.82 -13.79 -45.83 10.84 7.14 41.12
Juboraj 0.80 6.67 -12.43 24.96 16.29 -7.36 -8.37 15.75 17.64 37.07
Suvo 1 -3.73 -6.85 -22.55 24.59 12.89 -16.22 -22.74 9.17 4.69 34.22
Noor -5.78 -1.07 -20.12 7.97 27.28 -14.42 -11.5 9.92 15.33 32.82
3.3.1. 50% Flowering
There were no changes in days to 50% flowering in Tara sonali. Days to 50% flowering was increased in bimola, suvo-1 and noor are 4.49%, 3.73% and 5.78% respectively. However, it was slightly decreased in Juboraj (0.8%).
3.3.2. Days to 1st harvesting
Days to 1st harvesting decreased 6.67% in Juboraj. It was increased by 0.61%, 4.68%, 6.85% and 1.07% in Tara sonali, Bimala, suvo-1 and Noor respectively.
3.3.3. Node order of 1st flowering
3.3.4. Number of fruit per plant
There was a sharp decrease in number of fruit by 22.12%, 35.25%, 24.96%, 24.59% and 7.97% in Tara sonali, bimala, Juboraj , Suvo-1 and Noor respectively.
3.3.5. Fruit weight
Individual fruit weight was also decreased in Bimala, juboraj, Suvo-1 and Noor by 9.82%, 16.29%, 12.89% and 27.28% respectively. Though it increased in Tara sonali by 10.49%.
3.3.6 Plant height
Plant height increased in F2 generation in all the hybrids. The increase was 1.15%, 13.79%, 7.36%, 16.22% and 14.42% in Tara sonali, Bimala, Juboraj, Suvo-1 and Noor respectively.
3.3.7. Internodal length
There was slight decrease in internodal length in Tara sonali (0.38%) where it increased by 45.83%, 8.37%, 22.74% and 11.5% in Bimala, Juboraj, Suvo-1 and Noor respectively.
3.3.8. Fruit length
Fruit length decreased in all the F2 in relation to their respective F1’s. It was 26.67%, 10.84%, 15.75%, 9.17% and 9.92% in Tara sonali, Bimala, Juboraj, suvo-1 and Noor respectively.
3.3.9. Fruit diameter
Fruit diameter increased in Tara sonali by 13.99%. But it decreased by 7.14%, 17.64%, 4.69% and 15.33% in Bimala, Juboraj, Suvo-1 and Noor respectively.
3.3.10. Yield
The results of inbreeding depression for the character Yield per plot are presented in Table 7. Inbreeding depression was very prominent in all the varieties for yield. It was 14.64%, 41.12%, 37.07%, 34.22% and 32.82% respectively in Tara sonali, Bimala, Juboraj, Suvo-1 and Noor respectively.
3.4. Segregation pattern 3.4.1. Plant height
Segregation pattern of plant height of Okra were studied in five selfed F2 progenies. In Figure 1, it is clear that plant height of Okra cannot be classified into distinct categories. It is probably, due to multiple genes controlling this character.
3.4.2. Leaf shape
It is easy to explain from the Figure 2 that the leaf shape segregated into two major different types of shapes. Almost one fourth number of plants studied exhibited alternate palmately lobed leaf types, while a large number of plants exhibited heart shape leaf in F2 generation. The dominant and the recessive character for leaf shape: heart shape and alternate palmately lobed leaf types were easily distinguishable (Figure 2). All of the varieties showed fair to very good goodness of fit, which support the expected ratio 3:1.
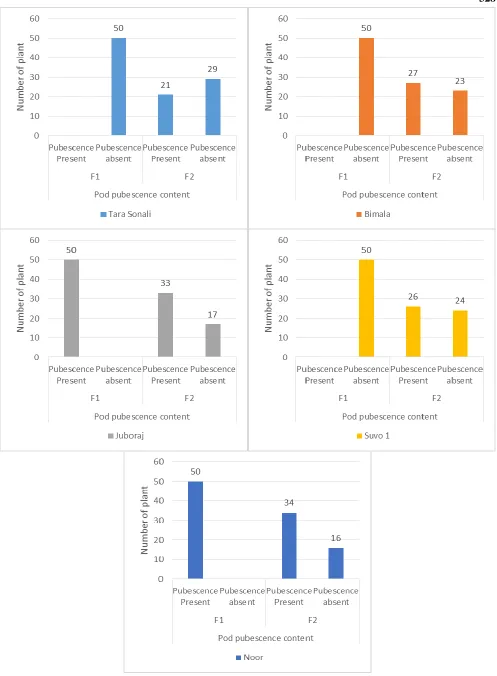
3.4.3. Pod pubescence content
The pods of Juboraj F1 and Noor F1 have pubescence while Tara SonaliF1, Bimala F1 and Suvo 1F1 does not have pubescence. Segregation took place in the F2 plants giving two phenotypic classes for both types of parents. The ratio of the classes in F2offspring of Juboraj and Noor is very close to 3:1 ratio. The P value of χ2 is (P = 0.10-0.25 and 0.25-0.50) indicating that the deviation from the expected frequencies is not significant i.e. there is a good fit to a 3:1 ratio. But the ratio of the classes in F2 offspring of Tara Sonali, Bimala and Suvo-1is far from3:1 ratio. This is probably due to presence of polygenic gene for this trait.
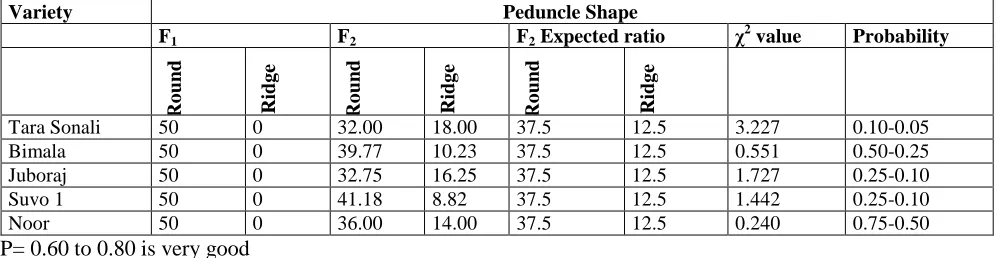
3.4.4. Fruit base shape
Table 7. Chi-Squared values and probabilities of goodness of fit of segregation ratios of F2 in the study of
inheritance of okra leaf shape.
Leaf shape
Variety F1 F2 Observed value F2 Expected value χ
2
value Probability
hea rt sha pe o rbic ula te hea rt sha pe o rbic ula te hea rt sha pe o rbic ula te
Tara Sonali 50 0 38.26 11.74 37.5 12.5 0.093 0.90-0.75
Bimala 50 0 33.62 16.38 37.5 12.5 2.412 0.25-0.10
Juboraj 50 0 34.36 15.64 37.5 12.5 1.579 0.25-0.10
Suvo 1 50 0 36.67 13.33 37.5 12.5 0.111 0.75-0.50
Noor 50 0 37.78 12.22 37.5 12.5 0.012 0.95-0.90
P= 0.60 to 0.80 is very good P= 0.40 to 0.60 is good P= 0.20 to 0.40 is fair
P= 0.05 to 0.20 is subjected to further trial/ reject the hypothesis.
Table 8. Chi-Squared values and probabilities of goodness of fit of segregation ratios of F2 in the study of
inheritance of okra pod pubescence content.
Variety Pubescence Content
F1 F2 F2 Expected ratio χ2 value Probability
P
ub
esce
nce Pre
sent
P
ub
esce
nce abs
ent
P
ub
esce
nce Pre
sent
P
ub
esce
nce abs
ent
P
ub
esce
nce Pre
sent
P
ub
esce
nce abs
ent
Tara Sonali 0 50 21 29 37.5 12.5 29.04 <0.005
Bimala 0 50 27 23 37.5 12.5 11.76 <0.005
Juboraj 50 0 33 17 37.5 12.5 2.16 0.10-0.25
Suvo 1 0 50 26 24 37.5 12.5 14.11 <0.005
Noor 50 0 34 16 37.5 12.5 1.31 0.25-0.50
P= 0.60 to 0.80 is very good P= 0.40 to 0.60 is good P= 0.20 to 0.40 is fair
P= 0.05 to 0.20 is subjected to further trial/ reject the hypothesis.
Table 9. Chi-Squared values and probabilities of goodness of fit of segregation ratios of F2 in the study of
inheritance of fruit base shape.
Variety Peduncle Shape
F1 F2 F2 Expected ratio χ2 value Probability
Ro un d Ridg e Ro un d Ridg e Ro un d Ridg e
Tara Sonali 50 0 32.00 18.00 37.5 12.5 3.227 0.10-0.05
Bimala 50 0 39.77 10.23 37.5 12.5 0.551 0.50-0.25
Juboraj 50 0 32.75 16.25 37.5 12.5 1.727 0.25-0.10
Suvo 1 50 0 41.18 8.82 37.5 12.5 1.442 0.25-0.10
Noor 50 0 36.00 14.00 37.5 12.5 0.240 0.75-0.50
P= 0.60 to 0.80 is very good P= 0.40 to 0.60 is good P= 0.20 to 0.40 is fair
3.4.5. Branching pattern
The branching pattern of all varieties of F1 was branched. Segregation took place in the F2 plants giving two phenotypic classes namely, unbranched and branched. The ratio of the classes in F2 offspring is very close to 3:1 ratio. The P value of χ2 is indicating that the deviation from the expected frequencies is not significant i.e. there is a good fit to a 3:1 ratio.
Table 10. Chi-Squared values and probabilities of goodness of fit of segregation ratios of F2 in the study of
inheritance of branching type.
Variety Branching Type
Observed value Expected value χ2 value Probability
F1 F2 F2
Unbra nche d B ra nched Unbra nche d B ra nched Unbra nche d B ra nched
Tara Sonali 50 18.00 32.00 12.5 37.5 3.227 0.10-0.05
Bimala 50 23.96 26.04 12.5 37.5 14.005 <.005
Juboraj 50 11.22 38.78 12.5 37.5 0.174 0.75-0.50
Suvo 1 50 14.13 35.87 12.5 37.5 0.284 0.75-0.50
Noor 50 16.25 33.75 12.5 37.5 1.500 0.25-0.10
P= 0.60 to 0.80 is very good P= 0.40 to 0.60 is good P= 0.20 to 0.40 is fair
P= 0.05 to 0.20 is subjected to further trial/ reject the hypothesis.
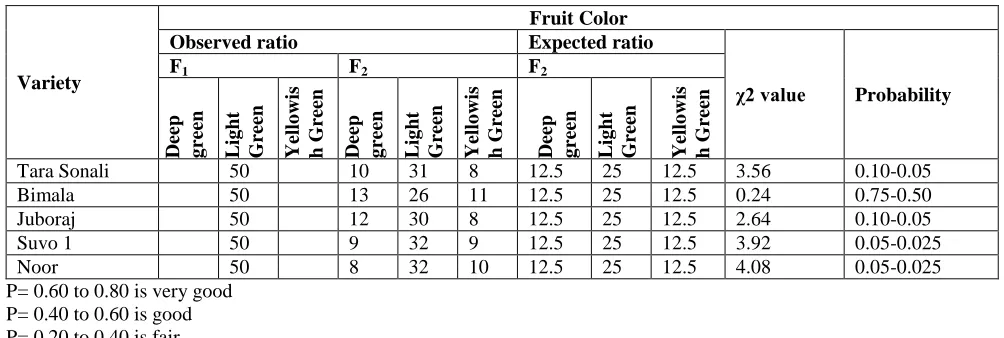
3.4.6. Fruit color
Inheritance studies for fruit color were studied in five selfed F2 varieties. It is easy to explain from the Fig. that the fruit color segregated into three major different colors. Almost an equal number of plants studied exhibited deep green and yellowish green color, while a large number of plants exhibited light green color in the F2 generation. The two homozygous extremes for fruit color: dark and yellowish green were easily distinguishable. Non significant chi-squared values were observed for the segregating ratios in F2 generation. Observations of 1 dark green: 2 light green: 1 yellowish green, fruit color was observed in the F2 populations. The segregation of the fruit color in F2 generation into three classes: dark green, light green and yellowish green fitting into the theoretical 1:2:1 monohybrid ratio of incomplete dominance.
Table 11. Chi-Squared values and probabilities of goodness of fit of segregation ratios of F2 in the study of
inheritance of fruit color.
Variety
Fruit Color
Observed ratio Expected ratio
χ2 value Probability
F1 F2 F2
Dee p g re en L ig ht G re en Yello wis h G re en Dee p g re en L ig ht G re en Yello wis h G re en Dee p g re en L ig ht G re en Yello wis h G re en
Tara Sonali 50 10 31 8 12.5 25 12.5 3.56 0.10-0.05
Bimala 50 13 26 11 12.5 25 12.5 0.24 0.75-0.50
Juboraj 50 12 30 8 12.5 25 12.5 2.64 0.10-0.05
Suvo 1 50 9 32 9 12.5 25 12.5 3.92 0.05-0.025
Noor 50 8 32 10 12.5 25 12.5 4.08 0.05-0.025
P= 0.60 to 0.80 is very good P= 0.40 to 0.60 is good P= 0.20 to 0.40 is fair
Figure 6. Segregation in F2 generation for fruit color in five genotype of Okra.
4. Discussion
4.1. Analysis of variance
The analysis of variance indicate that experimental hybrids and their F2 progenies highly differed for 50% flowering, days to 1st harvesting, node order of 1st flowering, plant height, Internodal length, number of fruit per plant, Fruit weight, Fruit Length and Fruit Diameter and yield. This shows the presence of considerable genetic variability among the hybrids and their F2 progenies for further evaluation and use.
4.2. Performance study
All hybrids performed best than their F2 progenies in respect of yield. Quality likes fruit weight, fruit length fruit diameter also deteriorated in F2 generation. On the other side, days to harvesting, days to flowering, days to harvest, node order of fruiting, plant height and internodal length was increased in F2 generation which clearly shows the negative effect of inbreeding.
4.3. Heritability, genetic advance and genetic advance in percentage of mean
Here h2 (b.s) is a convenient expression of phenotypic value which serves as a guide for the breeding value of any parent. For improvement of desirable characters, heritability estimate is very essential to assess the relative effect of genotype and environment on a character in order to predict the extent of possible improvement. Therefore, heritability is one of the major indicators of response to selection for a successful breeding program. The heritability estimates above 60% are considered as high, 30% to 60% are moderate and below 30% as poor. Estimation of selection parameters (Table 3) revealed that there was a wide range of genotypic and phenotypic variances. Genotypic variance ranged from 63.09 (Plant height) to 0.01 (fruit diameter) and phenotypic variance ranged from 65.28 (Plant height) to 0.02 (fruit diameter). Comstock and Moll (1963) reported that the more diverse the environmental population the smaller the estimates of genetic variance which supports the present results of low estimates of genetic variance. The knowledge of the genotypic and phenotypic variances for each character is necessary to construct a definite selection index (Sprague, 1966). As for as the broad sense heritability estimates are concerned, Number of fruit per plant and Yield were moderately heritable, whereas, 50% flowering, days to 1st harvest, Node order of 1st flowering, Fruit weight, Plant height, Internodal length, Fruit length and Fruit diameter were low in heritability. The presence of non-allelic interaction played a major role in decreasing h2 estimates for these traits. Furthermore plant height and sympodia are polygenically controlled. Cumulative environmental effects on each of these polygenes gave poor heritabilities for these traits.
4.4. Inbreeding depression
Inbreeding is a system of mating that leads to an increase in homozygosity, decline in vigor and the reduction in productivity. The degree of inbreeding in any generation is equal to the degree of homozygosity in that generation (Singh et al.,, 1990). The results for inbreeding depression for all the quantitative traits presented in Tables 6, which demonstrated that F2 progenies suffered considerable amount of inbreeding depression. The observed depression varied from-108 to 55.19, the wide range of inbreeding depression could be explained by two factors, linkage disequilibrium and epistasis interaction. Gardner et al., (1953), Gardner (1963) and Balochet al., (1991) reported that repulsion phase linkages can cause upward or positive biases in the estimation of dominance variance in F2 population where linkage effects are expected to be maximum. Comstock and Robinson (1948) and Soomro (2000) suggested that if multigenic epistasis were present, the epistasis of dominance will be biased down wards; ultimately the expected inbreeding depression will also go up than is observed. Inbreeding depression in polyploids has been found to exceed than what is expected by the coefficient of inbreeding. Aycock and Wilsic (1968) reported that in alfalfa, an autotetraploid, the yield decreased twice as much as predicted. This response according to them has been attributed to a decrease in favorable interactions among multiple alleles due to inbreeding and abnormal segregation at meiosis due to higher ploidy level.
In present studies, however, maximum positive values for inbreeding depression were observed for yield, where F2 values less than F1 means. These results further suggested that in such intercultivar crosses the maximum accumulation of genes resulted in increased fertility in F2 population, consequently resulted in the higher yield (Paul et al., 1987).
4.5. Segregation pattern
5. Conclusions
The experiments were conducted to observe the genetic variability, inbreeding depression and segregation pattern of Okra among five commercial hybrid varieties along with a local check based on their performance, heritability and inheritance study among the varieties for improvement of yield of Okra. The experiments were carried out at the experimental farm of RHRS, Lebukhali, Patuakhali, during the period of May, 2014 to September, 2014. The results of the studies have been summarized as follows: There was significant variation among the F1’s, their F2 progenies and the check variety. However, all the F1’s performed better than their respective F2 progenies for yield and other yield contributing characters. F1 and F2 both generations showed low to moderate level of heritability. No of fruit per plant and Yield were moderately heritable, whereas, days to 50% flowering, days to 1st harvesting, node order of first flowering, Fruit weight, Plant height, Internodal length, Fruit length and Fruit diameter were poor in heritability. Due to selfing the progenies become more homozygous and decline in vigor and the reduction in productivity. In case of segregation pattern plant height, leaf shape, pod pubescence content, peduncle shape, branching pattern and fruit color were subjected to study. Plant height and pod pubescence content are found to be polygenic trait. Fruit color showed incomplete dominance and other character expressed as Mendelian ratio.
Conflict of interest None to declare.
References
Abdelmageed AHA, 2010. Mode of inheritance of pod spineness in okra (Abelmoschusesculentus(L.) Moench). Tropical and Subtropical Agro ecosystems, 12: 405 – 409.
Aycock MK and CP Wilsic, 1968.Inbreeding Medicago sativa L. bysib mating. II. Agronomic traits. Crop Sci., 8: 481-485.
Baloch MJ, GH Tunio and AR Lakho, 1991.Expression ofheterosis in F1 and its deterioration in intra-hirsutumF2hybrids.Pakphyton, 3: 95-106.
Burton GM, 1952.Quantitative inheritance in Grass pea. Proc. of 6th Int. Grassland Cong. 1: 277-283. Charrier A, 1984.Genetic resources of Abelmoschus (okra).IBPGR. Rome, Italy. pp.61.
Comstock RE and HF Robinson, 1952.Genetic parameters their estimation and significance. Proc. of 6th Int. Grassland Cong. 1: 128-291.
Comstock RE and HF Robinson, 1948.The components of geneticvariance in populations of biparental progenies and their use inestimating the average degree of dominance. Biometrics, 4: 254-266.
Comstock RE and RH Moll, 1963. Genotype-environment interactions.. In: W.D. Hansen and H.F. Robinson (ed) Statistical geneticsand Plant Breeding. National Acad. Sci. Washington, D.C. pp. 164-196
Deokar AB, 1964. Back cross ratio involving two to three pairs of genes. Poona Agricultural College Magazine., 54: 32 – 34.
Gardner CO, 1963. Estimates of genetic parameters in crossfertilizing plant and their implication in Plant Breeding. In: Statisticalgenetics and Plant Breeding (ed) W.D. Hanson and H.F. Robinson. pp.225-252. Gardner CO, PH Harvey, RE Comstock and HF Robinson, 1953.Dominance of genes controlling quantitative
characters in maize.Agron. J., 51: 524-528.
Johnson KF, HF Robinson and RE Comstock, 1955.Genotypic and phenotypic correlation in soybeans and their implication in selection.Agron. J., 47: 477-483.
Kerur V, 2009. Generation mean analysis for yield and yield traits in okra [Abelmoschusesculentus(L.)Moench] Karnataka J. Agric. Sci.,22: 148 – 156.
Paul, NK, TD Johnson and CF Eagles, 1987.Heterosisandinbreeding depression in forage rape (Brassica napusL). Euphitica, 36:345-349.
Panse VG and PV Sukhatme, 1985.Statistical methods for agricultural workers, ICAR,New Delhi, India.
Rashid, 1990.Effect of nitrogen and phosphorus levels on seed production of okra (Abelmoschusesculentus L. Moench). Haryana J. Hort. Sci., 9:3-4.
Singh M, TH Singh, GS Chahal and LS Rawandha, 1990.Geneticanalysis for lint yield and its components in cotton. Crop Imp, 17: 64-67.
Singh RK and BD Chaudhury 1985.Biometrical Methods in Quantitative Genetic Analysis (rev. edition).Kalyani Publisher, New Delhi, India.
Soomro ZA, 2000. Genetic architecture of quantitative and qualitativetraits in GossypiumhirsutumL.M.Phl. Thesis submitted through theDepartment of Plant Breeding & Genetics to the Sindh Agri. Univ.Tandojam. Sprague GF, 1966. Quantitative genetics in plant improvement. In Kenneth J. Fray (ed) Plant Breeding. Iowa
State University Press. Ames. pp. 325-347.
Steel RGD and JH Torrie 1960.Principles and Procedures of Statistics. McGraw Hill Book Co. Inc. New York. pp. 107-109.
Thakur MR and SK Arora, 1986.Okra. In: Vegetable Crops in India, ed. TK Bose and MG Som, NayaProkash, Calcutta. pp. 606.