Analysis of Users Web Browsing Behavior Using
Markov chain Model
Diwakar Shukla
Department of Mathematics and Statistics, Sagar University, Sagar M.P. 470003, India. e-mail: [email protected]
Rahul Singhai
International Institute of Professional Studies, D.A.V.V. Indore, (M.P.), India. e-mail: [email protected]
---ABSTRACT--- In present days of growing information technology, many browsers available for surfing and web mining. A user has option to use any of them at a time to mine out the desired website. Every browser has pre-defined level of popularity and reputation in the market. This paper considers the setup of only two browsers in a computer system and a user prefers to any one, if fails, switches to the other one .The behavior of user is modeled through Markov chain procedure and transition probabilities are calculated. The quitting to browsing is treated as a parameter of variation over the popularity. Graphical study is performed to explain the inter relationship between user behavior parameters and browser market popularity parameters. If rate of a company is lowest in terms of browser failure and lowest in terms of quitting probability then company enjoys better popularity and larger user proportion.
Keywords -Markov Chains (MC), Transition Probability Matrix (TPM), Quality of Service (QOS), Browser Failure (BF).
--- Date of Submission: 24 May 2010 Revised: 02 December 2010 Date of Acceptance: 12 December 2010 ---
I. INTRODUCTION
A
browser has many salient features like user friendliness, portability, hardware freedom, efficiency, legal precedence, low cost, data privacy etc. One of the efficiency parameter relates to quick and speedy connectivity of web sites. When connectivity fails with certain probability it is termed as browser failure (BF). Features for attractiveness of a browser in the market is termed as quality of service (QOS).Stochastic modeling approach to a computer system is due to Naldi (2002), Shukla and Gadewar (2007), Shukla et al. (2007). In contribution Shukla and Jain (2007) stochastically modeled multilevel queue scheduling and one more similar extended by Shukla et al. (2010 d & g ) in the data model setup. Catledge and Pitkow (1995) examinied browsing stratigies by a method of characterization. A Markov model application is adopted by Deshpande and Karpis (2004) over web page access for computing and prediction purpose. A usefull contribution in similar lines is due to Pirolli (1996). In web mining area, Pitkow (1997) presented a search procedure in the scenario of World Wide Web. Detailed description over different data mining techniques is due to Han and Kamber (2001) and over the topic of stochastic process is due to Medhi (1991).
Application of Markov Chain model on ready queue processing time estimation presented by Shukla et al. (2010
b & c). Srivastav, Despande and Tan (2000) discussed basic concepts on discovery and applications of usage pattern for web mining. Shukla et al. (2010 g) applied the Markov Chain model approach on message flow probability computations and Shukla et al. (2009 a, b, c) have similar application over the study of Internet share distribution. Motivation derived from these to model the user browsing behavior for web-site of Internet. This paper presents a simple stochastic model when two browser owner companies are in competition for more and more popularity and attractiveness in the market. We define browser failure as the failure of opening web site, non-compatibility to operating system, lack of appropriate software and its complexity. The general behavior of a user is to choose one browser out of two which is most popular among people and provides lowest failure rate (or blocking). Objectives of this content are:
1. To examine the effect of Quality of Service (QOS) on browser popularity in public;
2. To study the effect of browser failure on browser sharing.
Let {Xn , n ≥ 0} be a Markov chain with state space {C, Q, B1, B2 , S} where
State C: represents connecting state. State Q: user quitting from the process.
Fig. 2.1 [Transition Diagram of user browsing]
Table: 2.1 [Transition Probability Matrix]
B1
1-b1 1-b2
b1
b2Pq
C
(1-P)(1-Pc) P (1-Pc)
Pc b1Pq
b2
B2 S
Q
State S:success for connectivity and surfing.
The Xn denotes the position of random variable X in the state space at the nth connectivity attempt made by the user.
II. ASSUMPTIONS FOR USER BROWSING BEHAVIOR
(1) The user attempts for dial up connection to use internet. If the connection is not established, user quits with the probability Pc.
(2) When connection is made user chooses any one of browsers B1, B2 with the probability P and 1–P respectively.
(3) User navigates to any one browser at a time when successfully opened.
(4) Bi (i=1,2) failure occurs due to non-opening of any site through Bi .Then user either quits (with probability Pq ) or switches to the next browser.
(5) Switching between browsers are on attempt by attempt basis (n=1,2,3….).
(6) Initial preference is based on quality of services and variety of facility features contained in both browsers. (7) Failure probability of a browser B1 is b1 and of B2 is
b2.
(8) Transition probability of surfing through B1, being completed in a single attempt is (1 – b1).
(9) Absorbing state (transition from a state to itself) probability is 1. No transition from this state occurs.
Under these assumptions user’s browsing behavior is discussed by a Markov Chain Model (see fig.2.1) in which the transition probabilities are on the arcs connecting the circles and representing the chain states.
The initial conditions n=0, (state probability before the first surf attempt) are:
[
]
[
]
[
]
[
]
[
]
= =
= =
= =
= =
= =
0 0 0 0
1
) 0 (
) 0 (
2 ) 0 (
1 ) 0 (
) 0 (
Q X P
S X P
B X P
B X P
C X P
The unit-step transition probability matrix is:
(
) (
)
(
)
(
)
(
1
) (
1
)(
1
)
0
0
0
1
0
0
0
0
0
1
0
0
0
1
0
1
0
1
1
0
2 2 1
2 2
1 1 1
1 1
2 1
c c
c
q q
q
P
P
P
P
P
C
Q
S
P
b
b
P
b
B
P
b
b
b
b
B
C
Q
S
B
B
−
−
−
−
−
−
−
Transition probabilities over multiple attempts are: For n=1,
[
1]
) 1 (
B
X
P
=
[
] [
]
)
1
.(
|
(0) 1 ) 1 ( )0 (
c
P
P
C
X
B
X
P
C
X
P
−
=
=
=
=
=
[
X
(1)B
2]
P
=
[
] [
]
)
1
)(
1
(
|
(0)2 ) 1 ( )
0 (
c
P
P
C
X
B
X
P
C
X
P
−
−
=
=
=
=
=
[
X
Q
]
P
(1)=
[
] [
]
c
P
C
X
Q
X
P
C
X
P
=
=
=
=
=
(0) (1)|
(0)For n=2,
[
1]
) 2 (
B
X
P
=
[
] [
2]
) 1 ( 1 ) 2 ( 2 ) 1
(
|
B
X
B
X
P
B
X
P
=
=
=
=
[
] [
.
|
(0)][
.
2(
1
)
]
2 ) 1 ( )
0 (
q
P
b
C
X
B
X
P
C
X
P
=
=
=
−
=
[
(
1
)(
1
)
]
(
1
)
.
1
−
p
−
p
cb
2−
p
q=
[
b
2(
1
−
P
)(
1
−
P
c)(
1
−
P
q)
]
=
For n=3,
…(2.1)
…(2.2)
[
1]
) 3 (B
X
P
=
[
] [
2]
) 2 ( 1 ) 3 ( 2 ) 2 (
|
B
X
B
X
P
B
X
P
=
=
=
=
[
X
B
] [
P
X
B
X
B
]
[
b
(
P
q)
]
P
=
=
=
−
=
.
|
(1) 1 21
2 ) 2 ( 1 ) 1 (
(
)
[
P
−
P
c]
b
(
−
P
q) (
[
b
−
P
q)
]
=
1
11
21
(
)
(
)
22
1
b
P
1
P
c1
P
qb
−
−
=
Similarly, for browser B2
( )
[
2]
2
B
X
P
n=
(
1
)
(
1
)
(2 1);
0
1 2
1
−
−
>
=
b
b
−P
P
P
n−n
q C n
n
When n is odd ( )
[
2]
1 2
B
X
P
n+=
( )
(
1
)(
1
)
(
1
)
2;
0
2
1
−
−
−
>
=
b
b
nP
P
CP
q nn
III. CATEGORIZATION OF USER:
Based on blocking in web surfing user categories are (1) Faithful Browser User: - who sticks with any
one browser chosen in first attempt (the user who is not interested to toggle in between browsers).
(2) Impatient Browser User: - who frequently
switches between two available browsers. He does not stick surff with any one browser.
If B1 selected, it’s browser failure probability is b1 and if
B2 selected, blocking probability is b2. Average blocking
probability for faithful users (when n > 1) is
(
)
21
1
P
b
Pb
B
f=
+
−
For Impatient user the browser failure probability depends on number of attempts. At the nth attempt this is (when n >
1) ( )
]
[
]
[
].
[
].
[
2 ) 1 ( 1 ) 1 ( 2 2 ) 1 ( 1 1 ) 1 (B
X
P
B
X
P
b
B
X
P
b
B
X
P
B
n nn n
n
i
=
+
=
=
+
=
=
− − −−Since the state probability for B1& B2 at the nth attempt
depends whether n is even or odd, we can have two expressions.
(
)
−
−
+
−
−
−
−
−
=
− − − − − 1 2 2 1 1 2 2 1 2 1 even)
1
)(
1
(
)
1
(
)
1
)(
1
(
)
1
)(
1
(
n q c n n n n n n q c n iP
P
b
b
P
Pq
b
b
Pc
P
b
P
P
B
2 1 2 1)
1
(
P
b
Pb
b
b
−
+
=
( )
−
−
−
+
−
−
−
−
−
+
−
−
=
− − − − − − − 1 1 2 1 1 1 2 1 2 1 2 1 1 1 1 2 1 odd)
1
)(
1
(
)
(
)
1
(
)
1
)(
1
(
)
(
)
1
)(
1
(
)
(
)
1
(
.
)
1
)(
1
(
)
(
n q c n n q c n q c n n q c n n iP
P
b
b
P
P
P
b
b
P
b
P
P
b
b
P
b
P
P
b
b
P
B
1 2
[
1(
1
)
2]
)
1
(
)
1
(
b
P
Pb
P
P
Pb
Pb
−
+
=
−
+
−
+
=
With equations (3.1) & (3.4) the average blocking (congestion) probabilities of faithful user (Bƒ) are equal. Since the geometric mean of the blocking probabilities b1
and b2 is smaller than their weighted sum (if
b
1≠
b
2) i. e. 21 2
1
b
Pb
(
1
P
)
b
b
<
+
−
⇒
P
(
b
1−
b
2)
>
b
1b
2−
b
2(
)
(
)
<
−
−
<
⇒
>
−
−
>
⇒
2 1 2 1 2 2 1 2 1 2 1 2 2 1if
)
(
if
)
(
b
b
b
b
b
b
b
P
b
b
b
b
b
b
b
P
The equations (3.3) and (3.4) are similar to Naldi (2002).The strategy adopted by the impatient user is in fig. 3.1, 3.2 and 3.3 shown in the regions of (b1, P) plane where
the impatient user’s behavior is favored when the B2’s
blocking probability is 0.02, 0.04 and 0.08 respectively. ( )
[
]
( )
1 2(
1
)
(
1
)
2;
0
1 1 2
>
−
−
=
=
+n
P
P
P
b
b
B
X
P
n q C n n …(2.8) …(2.7) …(2.9) …(2.10) …(2.11) …(3.5) …(3.1) …(3.2) …(3.3) …(3.4) ( )[
]
(
1)(
1)
(
1)
2 1; 02 1 1 1 2 > − − − = = −
−b P P P n
Fig. 3.1 Favoured strategies (when b2 = 0.02)
Fig. 3.2 Favoured strategies (when b2 = 0.04)
Fig. 3.3 Favoured strategies when (b2 = 0.08)
The browser failure probability is inversely proportional to initial choice of user (see fig 3.1 to 3.3), but when blocking due to other browser is high the share of first browser increases. We can express that
2 1
1
b
P
and
b
P
∝
∝
For B1The competitor browser failure if high, produces gain in user’s proportion for that browser.
IV. BROWSER SHARING:
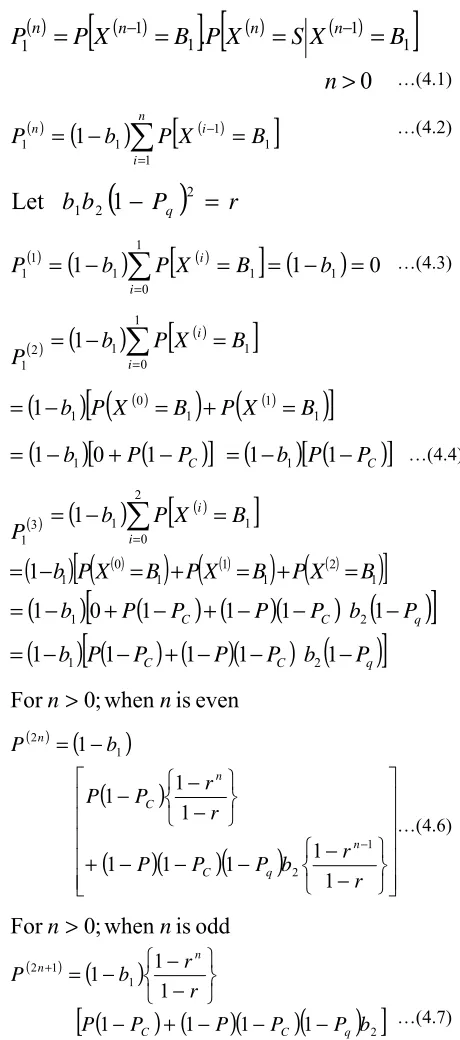
The probability that navigation successfully starts with browsers B1 at the nth attempt is:
( )
[
( )
]
[
( )
( )
]
0
.
1 11 1 1
>
=
=
=
=
− −n
B
X
S
X
P
B
X
P
P
n n n n
( )
(
)
∑
[
( )]
=
−
=
−
=
ni
i n
B
X
P
b
P
1
1 1 1
1
1
(
P
)
r
b
b
1 21
−
q 2=
Let
( )
(
1
)
[
( )]
(
1
)
0
1 1
0
1 1
1
1
=
−
∑
=
=
−
=
=
b
B
X
P
b
P
i
i
( )2 1
P
(
)
( )
[
]
∑
==
−
=
10
1 1
1
ii
B
X
P
b
(
)
[
(
( ))
(
( ))
]
1 1 1
0 1
1
−
b
P
X
=
B
+
P
X
=
B
=
(
−
b
)
[
+
P
(
−
P
C)
]
=
1
10
1
=
(
1
−
b
1) (
[
P
1
−
P
C)
]
( )3 1
P
(
)
( )
[
]
∑
==
−
=
20
1 1
1
ii
B
X
P
b
( )
[
(
( ))
(
( ))
(
( ))
]
1 2 1
1 1 0 1
1
−
b
P
X
=
B
+
P
X
=
B
+
P
X
=
B
=
(
−
b
)
[
+
P
(
−
P
C) (
+
−
P
)(
−
P
C)
b
(
−
P
q)
]
=
1
10
1
1
1
21
(
−
b
) (
[
P
−
P
C) (
+
−
P
)(
−
P
C)
b
( )
−
P
q]
=
1
11
1
1
21
even
is
when
;
0
For
n
>
n
( )
(
)
(
)
(
)(
)
(
)
− − −
− − +
− − −
− =
−
r r b P P P
r r P P
b P
n
q C
n
C n
1 1 1
1 1
1 1 1
1
1
2 1
2
odd
is
when
;
0
For
n
>
n
( )
(
)
(
) (
)(
)(
)
[
2]
1 1
2
1 1 1 1
1 1 1
b P P P P
P
r r b P
q C C
n n
− − − + −
− − − =
+
These two equations exhibit the overall probability of sharing two browsers by user in a web environment. These two proportions also reflect how the sharing of two different browsers changes with respect to the initial preference.
0 0.2 0.4 0.6 0.8 1
0 0.1 0.3 0.4 0.5 0.6 0.7 0.8 0.9
b1 (Blocking Probability of B1)
Initial shar
e P
0 0.2 0.4 0.6 0.8 1
0 0.1 0.3 0.4 0.5 0.6 0.7 0.8 0.9
b1 (Blocking Probability of B1)
Init
ia
l share P
0 0.2 0.4 0.6 0.8 1
0 0.1 0.3 0.4 0.5 0.6 0.7 0.8
b1 (Blocking Probability of B1)
In
it
ial
share P
…(4.6)
…(4.7) …(4.1) …(4.2)
The limiting cumulative probabilities of successfully surfing through the two browsers can be obtained by taking the limit of expression (4.6) & (4.7) over infinite attempts i.e. when the number of attempts are infinitely large. When n is even
( )
(
)(
)
−
−
−
−
+
−
−
=
=
∞ →
2 2
1
2 1
2 1 1
)
1
(
1
)
1
)(
1
(
1
1
lim
q q C
n
n
P
b
b
b
P
P
P
P
b
P
P
When n is odd ( )
(
)(
)
−
−
−
−
+
−
−
=
=
+∞ →
2 2
1
2 1
1 2 1 1
)
1
(
1
)
1
)(
1
(
1
1
lim
q q C
n
n
P
b
b
b
P
P
P
P
b
P
P
These expression are independent of parameter n. Browser
sharing depends on P, Pq, b1, b2 and Pc. Both expressions
(4.8) and (4.9) are same.
V. ISO-SHARE CURVES:
If we fix the final browsing share of user proportions then what shall be initial share to maintain the same ? This could be obtained by following equation.
{
}
[
]
[
]
−
−
−
+
−
−
−
−
−
−
−
−
+
−
+
−
+
−
=
)
1
)(
1
(
1
}
1
)
1
(
{
)
1
(
)
1
(
)
1
(
1
1
2
1
2 2 1
1 2
1
1 1 1
2 1
c q
q c
c c q
C q q
P
P
b
P
b
b
P
b
P
P
P
b
P
P
P
P
P
P
P
b
b
P
The initial share P is a function of final share P1 with many
other parameters. Iso-share curve indicates for what initial share of user proportion required if the final share level is fixed for both.
VI. GRAPHICAL STUDY:
From fig 5.1 to 5.3, increasing label of browser failure leads to loss of final browser user group share. If probability PC is high, the fall in browser user proportion
rate is also high. Moreover, if b2 is high this loss is
relatively lower.
0 0.05 0.1 0.15 0.2 0.25 0.3 0.35 0.4 0.45
0.1 0.2 0.3 0.4 0.5 0.6 0.7 0.8
T
raf
fic Sh
ar
e
(p
1)
pc=0.2 pc=0.4 pc=0.6
Failure Probability of B1(b1) Fig 5.1 (P=0.5, b2=0.3, Pq=0.5)
0 0.1 0.2 0.3 0.4 0.5
0.1 0.2 0.3 0.4 0.5 0.6 0.7 0.8
T
raff
ic Sh
a
re
(P
1)
Pc=0.2 Pc=0.4 Pc=0.6
Failure Probability of B1(b1) Fig 5.2 (P=0.5,b2=0.5,Pq=0.5)
0 0.1 0.2 0.3 0.4 0.5
0.1 0.2 0.3 0.4 0.5 0.6 0.7 0.8
T
raf
fic Sh
ar
e
(P
1)
Pc=0.2 Pc=0.4 Pc=0.6
Failure Probability of B1(b1) Fig 5.3 (P=0.5, b2=0.8, Pq=0.5)
0 0.1 0.2 0.3 0.4 0.5 0.6 0.7 0.8 0.9 1
0.1 0.2 0.3 0.4 0.5 0.6 0.7 0.8
In
it
ia
l Sh
are
(P
)
P1=0.3 P1=0.5 P1=0.8
Failure Probability of B1(b1) Fig 5.4 (Pc=0.5,b2=0.2,Pq=0.5)
…(4.8)
…(4.9)
0 0.1 0.2 0.3 0.4 0.5 0.6 0.7 0.8 0.9 1
0.1 0.2 0.3 0.4 0.5 0.6 0.7 0.8
In
it
ia
l Sh
are
(P
)
P1=0.3 P1=0.5 P1=0.8
Failure Probability of B1(b1) Fig 5.5 (Pc=0.5,b2=0.5,Pq=0.5)
0 0.1 0.2 0.3 0.4 0.5 0.6 0.7 0.8 0.9 1
0.1 0.2 0.3 0.4 0.5 0.6 0.7 0.8
In
it
ia
l Sh
are
(P
)
P1=0.3 P1=0.5 P1=0.8
Failure Probability of B1(b1) Fig 5.6 (Pc=0.5,b2=0.8,Pq=0.5)
The iso-share analysis (see fig 5.4 to 5.7) indicates that if final share is 30% and browser failure is 20% then the initial share must be around 30%. If browser failure is high then correspondingly the initial share should also be high. When competitor browser failure rate is high then the low initial share of user proportion is accomodable. More and more user’s will opt that browser having the lower failure rate.
0 0.1 0.2 0.3 0.4 0.5 0.6 0.7 0.8 0.9 1
0.1 0.2 0.3 0.4 0.5 0.6 0.7 0.8
In
it
ia
l Sh
are (
P
)
P1=0.3 P1=0.5 P1=0.8
Quiting Probability (Pc) Fig 5.7 (Pq=0.5,b1=0.5,b2=0.5)
The Pc which is quitting probability of from attempt
process has adverse effect on initial traffic share. With the increase of Pc browser sharing proportion of user falls
down. Moreover if a browser owner company keeps final user proportion high, then with increasing Pc probability,
the fall in initial share proportion user is very high.
VII. CONCLUDING REMARK:
The browser failure probability affects to the user proportion in the market and having inversely proportional relation. However, between two the other competeting browser failure rate increases the user proportion of the earlier. If the quitting probability Pc is high then fall in proportion of browser user rate is also high. If the browser owner company wants to maintain a certain standard of user share proportion then company has to maintain a certain level of initial proportion. More and more user’s will opt that browser having the lower failure rate. The quitting probability Pc affects the proportions of initial browser share, and with the increase of Pc this proportion falls down.
It is recommended for browser owner competitors to reduce their quitting probability Pc as much as possible in order to maintain their customer proportion. However companies are advised to have a watch on browser failure rate of other competeting companies.
If a rate of a company is lowest in terms of browser failure and lowest in terms of quitting probability Pc then the company can enjoy relatively a large number of browser user proportion in the market.
REFERENCES
[1] Catledge, L. D. and Pitkow J. E. (1995): “Characterizing browsing strategies in the World-Wide Web”, Computer Networks and ISDN Systems,26 (6),pp 1065.
[2] Deshpande, M. and Karypis G.(2004): “Selective Markov Models for Predicting Web-Page Accesses”, ACM Transactions on Internet Technology, Vol 4, No.2, May 2004,pp.168-184.
[3] Han, J. and Kamber, M.(2001): “Data Mining- Concept & Techniques”, Academic Press, San Diego.. [4] Medhi, J. (1991): “Stochastic processes”, Ed 4, Wiley
Eastern Limited (Fourth reprint), New Delhi.
[5] Naldi, M. (2002): ‘Internet access traffic sharing in a multi operator environment”, Computer Network, vol. 38, pp. 809-824.
[6] Pirolli, P., J. Pitkow, and R. Rao (1996): “Silk from a sow's ear: Extracting usable structures from the web”, Conference on Human Factors in Computing Systems, CHI '96, Vancouver, Canada.
[7] Pitkow, J. E. (1997): “In Search of Reliable Usage Data on the WWW”, Sixth International World Wide Web Conference, Santa Clara, CA.
[9] Shukla, D. and Singhai, R. (2010 a ): “Traffic analysis of message flow in three crossbar archicture space-division switches”, Journal of Computer Science (JCS), Coimbatore, Vol. 4, No.3, pp. 1560.
[10] Shukla, D., Gadewar, S. and Pathak, R.K. (2007): “A Stochastic model for space-division switches in computer networks”, Applied Mathematics and Computation (Elsevier Journal), Vol. 184, Issue 2, pp. 235-269.
[11] Shukla, D., Gadewar, S. and Pathak, R. K. (2007) :A Stochastic model for space division switches in computer network, Applied Mathematics and Computation, Vol. 184, pp. 235-269.
[12] Shukla, D., jain, A. and Choudhary, A. (2010 b ): “Estimation of ready queue processing time under SL- Scheduling scheme in multiprocessors environment”, International Journal of Computer Science and Security (IJCSS), Vol. 4, No. 1, pp. 74-81.
[13] Shukla, D., jain, A. and Choudhary, A. (2010 c ): “Estimation of ready queue processing time under usual group lottery Scheduling (GLS) in multiprocessors environment ”, Journal of Computer Applications, Vol. 8, No. 4, pp. 39-45.
[14] Shukla, D., Jain, S. and Ojha, S. (2010 d ): “Effect of data model approach in state probability analysis of multilevel queue scheduling”, Journal of Advanced Networking & Applications (IJANA), Vol. 02, No. 1, pp. 419-427.
[15] Shukla, D., Jain, S., Singhai, R. and Agarwal, R. K.(2009 a ): “A Markov chain model for the analysis of round-robin scheduling scheme”, journal of Advanced Networking & Applications (IJANA), Vol. 01, No. 1, pp. 1-7.
[16] Shukla, D., Jain, S. and Ojha, S. (2010 e ): “Data Model based analysis of multi level queue scheduling using Markov Chain Model, International Journal of Applied Computer Science and Mathematics, Vol. 8, No. 4, pp. 50-56.
[17] Shukla, D., Ojha, S. and Jain, S. (2010 f ): “Performance evalution of a general class of multi-level queue scheduling scheme, Computer Science and Telecommunications (GEST), Vol. 3, No. 26, pp. 99-121.
[18] Shukla, D., Singhai, R., Gadewar, S.K., Jain, S., Ojha, S. and Mishra, P.P. (2010 g ): “A Stochastic model approach for reaching probabilities of message flow in Space Division Switches”, International Journal of Computer Network (IJCN), Vol. 2, No. 2, pp.140-150. [19] Shukla, D., Tiwari, V., and Kareem, A. (2009 b): “All comparision analysis of internet traffic sharing using Markov Chain Model in Computer Network”, Georgian Electronic Scientific Journal: Computer Science and Telecommunications (GESJ), Vol. 06, No. 23, pp. 108-115.
[20] Shukla, D., Tiwari, V., Thakur, S. and Deshmukh, A.K. (2009 c ): “Share loss analysis of Internet traffic distribution in computer network”, International Journal of Computer Science and Security (IJCSS), Vol. 3, No. 4, pp. 414-427.
[21] Shukla, D., Tiwari, V., Thakur, S. and Deshmukh, A.K. (2010 h ): “ Two call based analysis of internet traffic sharing, Vol. 1, No. 1, pp. 14-24.
[22] Srivastava J., Cooley R., Deshpande M. and Tan P.(2000): “Web Usage Mining: Discovery and Applications of Usage Patterns from Web Data”, ACM SIGKDD, Jan. 2000.
Author’s Biography
Dr. Diwakar Shukla is working as an
Associate Professor in the Department of Mathematics and Statistics, Sagar University, Sagar, M.P. and having over 21 years experience of teaching to U.G. and P.G. classes. He obtained M.Sc.(Stat.) Ph.D.(Stat.), degrees from Banaras Hindu University, Varanasi and served the Devi Ahilya University, Indore, M.P. as a Lecturer over nine years obtained the degree of M. Tech. (Computer Science) from there. During Ph.D., he was junior and senior research fellow of CSIR, New Delhi qualifying through Fellowship Examination (NET) of 1983. Till now, he has published more than 80 research papers in national and international journals and participated in more than 35 seminars / conferences at national level. He also worked as a selected Professor to the Lucknow University, Lucknow, U.P., for one year and visited abroad to Sydney (Australia) and Shanghai (China) for conference participation. He has supervised eleven Ph.D. theses in Statistics and Computer Science both; and six students are presently enrolled for their doctoral degree under his supervision. He is member of 10 learned bodies of Statistics and Computer Science both at national level. The area of research he works for are Sampling Theory, Graph Theory, Stochastic Modelling, Computer Network and Operating Systems.
Mr. Rahul Singhai has obtained M.C.A.
![Fig. 2.1 [Transition Diagram of user browsing]](https://thumb-us.123doks.com/thumbv2/123dok_us/1296478.1636574/2.612.82.264.410.613/fig-transition-diagram-user-browsing.webp)