International Journal of Advanced Engineering, Management and Science (IJAEMS) [Vol-2, Issue-8, Aug- 2016] Infogain Publication (Infogainpublication.com) ISSN : 2454-1311
www.ijaems.com Page | 1402
Region of Interest Extraction in 3D Face Using
Local Shape Descriptor
Sawsen A. Mahmood
1, Rana F. Ghani
2, Abdulameer A. Kerim
3, Yaseen N. Jurn
41Department of Computer Science, AL Mustansiriyah University, Baghdad, Iraq
2,3
Department of Computer Science, University of Technology, Baghdad, Iraq
4Ministory of Science and Technology, Baghdad, Iraq
Abstract— Recently, numerous efforts were focused on
3D face models due to its geometrical information and its reliability against pose estimation and identification problems. The major objective of this work is to reduce the massive amount of information contained the entire 3D face image into a distinctive and informative subset interested regions based 3D face analysis systems. The interested regions are represented by nose and eyes regions of frontal and profile 3D images. These regions are detected based on distance to local plan descriptor only which is copes well with profile views of 3D images. The statistical distribution of distance to local plane descriptor is predicted using Gaussian distribution. The framework of the proposed approach involves two modes: training mode and testing mode. In the training mode, a learning process for local shape descriptor related to the interested regions is carried out. The interested regions (nose and eyes) are extracted automatically in the testing mode. The performance evaluation of the proposed approach has been conducted using 3D images taken from GAVADB 3D face database which consists of both frontal and profile views. The proposed approach achieved high detection rate of interested regions for both frontal and profile views.
Keywords— 3D face recognition, local descriptors, keypoints.
I. INTRODUCTION
In fact, biometric methods based 3D face analysis allowing accurate face recognition in real world application [1]. The 3D face recognition approaches offered a significant accuracy and resilience in dealing with facial expressions, illumination and pose variations, compared to 2D approaches [2]. In the recent decades, most of interested regions extraction methods based 3D face recognition system were concentrated on fully and semi frontal facial scans within controlled acquiring environment. In this case, probe faces that obtained in uncontrolled environment may contains missing regions (profile poses) or self-occlusion like hair, scarves and glasses, which may leads to incorrect identification.
A set of radial curves emanating from the nose tip is based in [3] to represent the facial surface. Facial
matching is implemented by comparing their
Infogain Publication (Infogainpublication.com) ISSN : 2454-1311
www.ijaems.com Page | 1403 DLP. In the testing mode, an automatic detection for
regions of interest ROI is achieved using a reasonable ROI extractor.
II. WORKFLOWSTATEMENT
The intrinsic issue of this work is to resolve ROI detection problem with presence wide pose variation (up
to 60ᵒ around yaw axis) on the 3D images. The 3D images
used in this work are mesh format. The framework of the proposed approach composes of two main mods; training and testing modes. In the training mode, the 3D image is subjected to the following processes:
• Preprocess the 3D training image.
• Detect the required ROIs manually on these
images. In this work the interested regions are; nose tip landmark, left and right eyes regions.
• Compute DLP descriptor for the interested
region vertices, which are previously detected in the step 2
• Generate Gaussian distribution map through
computing (probability density function) for ROIs in order to formulate the shape model for each interested region ROI based on its local shape descriptor values.
• Build feature vector for each interested region
ROI, which is composed of (Minval, Maxval, and IDLval), where Minval represents the minimum value of DLP within ROI, Maxval represents the maximum value of DLP within ROI and IDLval represents the ideal value of DLP descriptor within ROI. According to Gaussian distribution, the ideal value of ROI is related with its mean value of DLP descriptor.
• Estimate the relative rules based keypoints
detector work. Essentially, these rules are based on the raw feature vector of ROI illustrated at the previous step.
The testing mode of the proposed approach is composed of the three main steps:
• Detecting keypoints of the entire testing 3D
image using specific rules (estimated and constructed in the training mode).
• Extract ROI (nose and eyes) regions based on a new proposed method of landmarks detection method.
• Finally, an implicit detection of face region in the testing 3D image has been achieved.
A. Preprocessing Data Points
In this work, the data points of the available 3D images are triangular mesh format. These meshes are preprocessed over three main stages; first, remove spikes using common and simple noise removal method Median
Cut Filter [9]. The principle concept of this filter is represented by inspecting each neighborhood point, and replaces the z-value of this point by the median value of
neighborhood z-values. Second initial step in
preprocessing operations is represented by determining vertex Neighborhood. One ring neighbor is based using the connectivity information of each vertex in the mesh and have knowledge about point localization relative to the other points within its local neighborhood. Each determined neighborhood is extremely generic and includes three main elements;
• The vertices that formulates the neighborhood.
• The faces that contains neighborhood vertices.
• The threshold value used for defining the
neighborhood border.
The third step in preprocessing operations is calculating Normal Vector for each vertex according to the presented method in [9].
B. Local Shape Descriptor
Local shape descriptors play a decisive role in 3D face analysis domain and the embedded features extraction phase respectively [10]. Distance to Local Plan Descriptor DLP [11] is used in this work. DLP descriptor is considered as good measure of convexity/concavity at each 3D mesh vertex. It is defined as the Euclidean distance between the current vertex xi and the plane that best fits its local neighboring vertices. DLP descriptor can be calculated according to equation (1).
( - ) (1) DLPi = Np⋅ xi x
Where Np is the surface normal and is the average of neighboring points.
C. Keypoints Detector
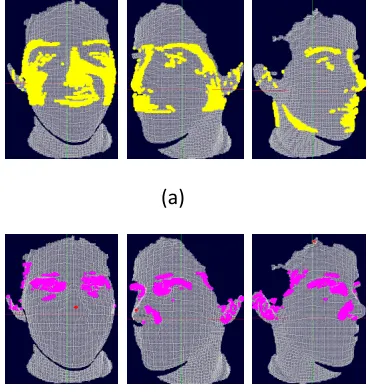
The proposed keypoints detector is based on the hypothesis that the best keypoints detector should be able to detect and assign repeatable interest points across different individuals. Therefore, the proposed keypoints detector aims firstly to detect common coarse-features across all faces such as nose tip region (patch), instead of detecting singular and fine points. Secondly, the extraction of interest regions is compatible with locating the local neighbors of each vertex to provide an informative shape area instead of singular vertex coordinates. The detection process is based mainly on specific rules estimated and constrained in the training mode. Regarding to the keypoints of nose region, the construction of these rules relies on high range values of DLP descriptor which are contribute in detecting the convex regions on the 3D image as shown in Fig. 1-a. We construct these rules according to the following conditions:
• If Th1 ≤ DLP ≤ Th2 then Convex Region
International Journal of Advanced Engineering, Management and Science (IJAEMS) [Vol-2, Issue-8, Aug- 2016] Infogain Publication (Infogainpublication.com) ISSN : 2454-1311
www.ijaems.com Page | 1404 Where Th1 is 0.6, Th2 is 1.0, Th3 is 0.0 and Th4 is 0.2.
These Thresholds values were determined in the training mode. Generally, the convex regions have greater likelihood being the desired nose region. The keypoints of eye regions are detected based on low value of DLP descriptor that indicates to concave regions in the 3D images as shown in Fig. 1-b.
D. Region of Interest Extraction
Obviously, in the keypoints detection process, more than one candidate region were detected, which include the desired region (ROI). Therefore, we need further operations to extract the desired region from the 3D image. The starting point of ROI extraction process is inspired from the detection of most salience part in the human face (nose tip landmark). The accurate detection of nose tip landmark on the 3D image will offer an implicit detection of the 3D face, as well as its advantageous influence on detecting eyes regions. The standard rule that is adopted in such approaches is that; nose tip landmark is the nearest point to the camera, which is determined easily by minimum z-value constraint. This classic rule will often fail with presence of different variations such as hair, scarf and profile facial scans. The local shape descriptor DLP has been adopted in the proposed ROI extraction method due to its robustness and invariance against rigid transformations (rotation, scaling and
translation). Practically, convex regions can be
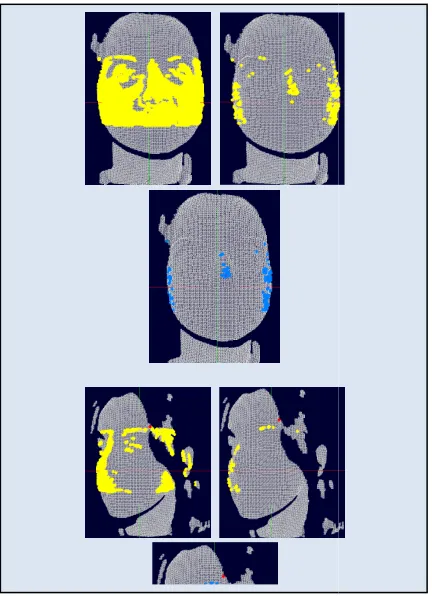
determined by utilizing reasonable and predefined thresholds TDLP of DLP descriptor. The detailed description of nose tip detection procedure that operates over each preprocessed 3D image can be illustrated via the following steps and showed in Fig. 3:
• Select the vertices that have one-ring neighbors
more than or equal to three vertices.
• DLP local shape descriptor is calculated for the
selected vertices.
• Detect the convex regions on the data points by
selecting the vertices that have DLP values more than threshold Th1 as shown in Fig. 3-a.
• Select the vertices that are likely to have DLP
value similar to (DLP ideal value) of nose tip landmark (learned previously in the training mode) as shown in Fig. 3-b. A simple Gaussian distribution can be more expressive about the variation of DLP descriptors values. The Gaussian distribution function is used to compute the probability density function (pdf) for DLP descriptor of vertex xi according to equation. (2).
2
( )
-2 2
1
( , , ) (2)
2
di
pdf d
i e
µ σ
µ σ σ π
−
=
Where di is the DLP descriptor of xi vertex, μ is the mean
of DLP values for the interested region, σ is the standard
deviation of DLP values for the interested region over all the training meshes. The x-axis of the graph plotted in Fig. 2 represents the mean range values for DLP descriptor related nose tip landmark. The y-axis represents the corresponding probability density function value of DLP descriptor.
• Finally, surrounding the survive vertices by a
sphere centered at the origin (0, 0, 0) of 3D image as shown in Fig. 3-c. The radius of this sphere is determined by computing the distance between each survive vertex and the origin (0, 0, 0). Then we select the maximum distance to identify the radius of the first sphere. Thus, select the vertex that lies on the surface of the first sphere as the desired nose tip landmark.
(a)
(b)
Fig 1: Keypoints Detection on frontal and profile views for same person, a) nose region detection, b) eye region detection.
DLP
Fig 2: Statistical Distributions of local shape descriptor DLP for nose tip Landmark.
0 0.1 0.2 0.3 0.4 0.5 0.6 0.7 0.8 0.9 1 0
Infogain Publication (Infogainpublication.com
www.ijaems.com • In order to detect the nose region, we collect all
the vertices that lie within a second
centered at the detected nose tip to formulate the nose region. The radius of the second sphere has been defined previously in the training mode. Not: In Fig. 3, the vertex with red color is referred to nose tip detection based on the classic meth
z value).
The eye regions are determined according to the first four steps stated in nose tip detection method, then collecting the vertices which are lie above nose tip landmark coordinates. Consequently, we select the vertices on the left side of nose tip landmark coordinates to extract left eye region. The right eye region is extracted through selecting vertices on the right side of nose tip landmark coordinates.
III. EXPERIMENTALRESULTS
In this section, detailed description about GAVADB 3D database is presented as well as the performance evaluation of the proposed approach. In doing so, the 3D images used in the training and testing modes are subjected to preprocessing operations.
A. Gava Database
GAVADB database offer systematic variations over the pose and facial expression for each individual.
Fig 3: nose tip detection method, from top to bottom; frontal scan, profile view (left), profile view (right). a) convex region detection, b) gaussian distribution, c) survive candidate verticies
Infogainpublication.com)
In order to detect the nose region, we collect all
the vertices that lie within a second sphere centered at the detected nose tip to formulate the nose region. The radius of the second sphere has been defined previously in the training mode. Not: In Fig. 3, the vertex with red color is referred to nose tip detection based on the classic method (minimum
The eye regions are determined according to the first four steps stated in nose tip detection method, then collecting the vertices which are lie above nose tip landmark Consequently, we select the vertices on the left side of nose tip landmark coordinates to extract left eye region. The right eye region is extracted through selecting vertices on the right side of nose tip landmark
RESULTS
is section, detailed description about GAVADB 3D database is presented as well as the performance evaluation of the proposed approach. In doing so, the 3D images used in the training and testing modes are
GAVADB database offer systematic variations over the pose and facial expression for each individual.
Additionally, the captured images; noisy (has spikes) and the holes were filled. Its construction based on the triangular meshes representation of shapes
mesh representation is the most common and based 3D data representation and arises by constructing polygons from neighboring points. This database consists of 549 3D facial surface scans corresponding to 61 individuals (45 males and 16 females) acquired by Minolta Vivid 700 scanner. The distance from the scanner is ranging from 0.5 m to 1.5 m. Most 3D images contains spikes and non facial parts such as, shoulder, hair, shirt collar, neck, etc.. Each individual has nine captures, two frontal ca with natural expression, two pose capture around pitch axis( up and down), two profile poses (right and left), and three frontal captures with different facial expressions. The performance of the proposed approach is evaluated based on GAVADB 3D dat
same subject from GAVADB are shown in Fig. 4. In the training mode, the ground truth set constituted from one of the two neutral frontal scans of each individual. In order to formulate and design the main rules required for ROI process, we have been used 20 natural frontal facial scans taken from GAVADB database. The testing images were comprised of 100 facial scans with different poses.
Desired region
Success Rate of Frontal Views
%
Success Rate of Profile Views
Frontal view
Left view from(
Left Eye Region
94
Right
Eye 94
Fig 3: nose tip detection method, from top to bottom; frontal scan, profile view (left), profile view detection, b) gaussian distribution, c) survive candidate verticies
Fig 4: Examples of face modeles for same subject taken from GAVADB 3D dataset.
Table I. Results of the obtained success rates.
ISSN : 2454-1311
Page | 1405 Additionally, the captured images; noisy (has spikes) and the holes were filled. Its construction based on the triangular meshes representation of shapes [4], where mesh representation is the most common and based 3D data representation and arises by constructing polygons from neighboring points. This database consists of 549 3D facial surface scans corresponding to 61 individuals acquired by Minolta Vivid 700 scanner. The distance from the scanner is ranging from 0.5 m to 1.5 m. Most 3D images contains spikes and non-facial parts such as, shoulder, hair, shirt collar, neck, etc.. Each individual has nine captures, two frontal captures with natural expression, two pose capture around pitch axis( up and down), two profile poses (right and left), and three frontal captures with different facial expressions. The performance of the proposed approach is evaluated based on GAVADB 3D database. Some examples of same subject from GAVADB are shown in Fig. 4. In the training mode, the ground truth set constituted from one of the two neutral frontal scans of each individual. In order to formulate and design the main rules required for cess, we have been used 20 natural frontal facial scans taken from GAVADB database. The testing images were comprised of 100 facial scans with different poses.
Success Rate of Profile Views %
Left view from(10 to
-60)
Right view from (+10 to
+60)
86 83
89 81
Fig 4: Examples of face modeles for same GAVADB 3D dataset.
International Journal of Advanced Engineering, Management and Science (IJAEMS) [Vol-2, Issue-8, Aug- 2016] Infogain Publication (Infogainpublication.com) ISSN : 2454-1311
www.ijaems.com Page | 1406 Region
Nose
Region 93 88.7 87
B. Performance Evaluation
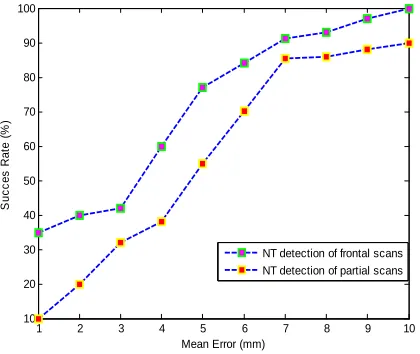
In this work, the 3D testing images are categorized into two sets: images with frontal pose and images with profile pose (include missing parts). In order to obtain the performance evaluation of the proposed approach, an experiment has been conducted to analyze nose tip detection method tolerance against pose variation and evaluate the success rate of this method. The reported results of this experiment were focused on calculate the physical distance between the automatically detected nose tip and the ground truth location of nose tip for same person image. These ground truth locations are detected manually in the training mode. The success rate of nose tip localization method for both types of 3D images (frontal and profile) is related with predefined distance threshold less than or equal to 7 mm. Nose tip detection method achieved detection rate 90 % for frontal images and 88% for profile images, as shown in Fig. 5.
The accurate detection of interested nose region is correlated tightly with detection of nose tip landmark. The success rate of eye region detection is related with the emergence of the desired region (eye region) within the candidate vertices. The reported results have exhibited high detection rate for left and right eye regions as well as nose region with frontal and profile 3D images as shown in Table I.
IV. CONCLUSION
A simple and effective approach has been proposed to extract ROI from 3D images using local shape descriptor. Framework of this approach requires a training process
for ROI in 3D images (nose and eyes) that are extracted in manually manner. Hence, a construction of shape model for interested region has been carried out based on local shape descriptor values of this region.
The testing mode included an employment of DLP descriptor in keypoints detection process. We proved that DLP descriptor offers high discriminative representation of interested regions on 3D shape data. Regarding to nose region, the main objective of the proposed detector is to locate the most salient regions in the 3D image. Meanwhile, the eyes regions were detected through locating concave regions on 3D images. The main contribution of ROI extractor is; decreasing the processing time needed for interested regions detection due to adaptive one local shape descriptor. In addition, there is no need to rotate the entire 3D face model to the frontal (canonical) pose to specify pose normalization. The experimental results of the proposed approach were evaluated using GAVADB 3D face database, which includes realistic facial scans with presence pose variation. The proposed approach achieved high detection rate for frontal and profile views.
REFERENCES
[1] R. Cipolla, S. Battiato, G. M. Farinella, “Registration
and recognition in Iamges and Videios” Springer Science, Sep. 2013.
[2] I.A. Kakadiaris, G. Passalis, G. Toderici, E. Efraty, P.
Perakis, D. Chu, S. Shah, and T. Theoharis, “Handbook of Face Recognition,” Second Edition, Springer, ch.17, 2011.
[3] H. Drira, B. Ben Amor, M. Daoudi, A. Srivastava,
“Pose and Expression-Invariant 3D Face Recognition using Elastic Radial Curves,” British Machine Vision Conference, pp. 90.1-90.11. BMVA Press, Sep. 2010.
[4] GAVADB database web site.
[5] D. Huang, M. Ardabilian, Y. Wang and L. Chen,
“3-D Face Recognition Using ELBP-Based Facial Description and Local Feature Hybrid Matching,” IEEE Trans. Inf. Forensics Security, vol. 7, no. 5, pp. 1551–1564, Oct. 2012.
[6] P. Jonathon Phillips, P. J. Flynn, T. Scruggs, K. W.
Bowyer, J. Chang, K. Hoffman, J. Marques, J. Min and W. Worek, ”Overview of the Face Recognition Grand Challenge,” IEEE CVPR, vol.1, pp. 947–954, 2005.
[7] P. Nair and A. Cavallaro, “3D Face Detection
Landmark Localization, and Registration Using a Point Distribution Model,” IEEE Trans. on Multimedia, vol. 11, no. 4, pp. 611–623, Jun.., 2009.
[8] J. Knopp, M. Prasad, G. Willems1, R. Timofte and L.
Van, “Hough Transforms and 3D SURF for robust
1 2 3 4 5 6 7 8 9 10
10 20 30 40 50 60 70 80 90 100
Mean Error (mm)
S
u
c
c
e
s
R
a
te
(
%
)
NT detection of frontal scans NT detection of partial scans
Infogain Publication (Infogainpublication.com) ISSN : 2454-1311
www.ijaems.com Page | 1407 three dimensional classification”, In computer
vision-ECCV Springer, 2010.
[9] J. Toriwaki and H. Yoshida, “Fundamentals of Three
Dimensional Digital Image Processing”, Springer Book, 2009.
[10]H. Dibeklioglu, A. Ali and L. Akarun, “3D Facial Landmarking Under Expression, Pose, and Occlusion Variations,”Proc. IEEE Int. Conf. Biometrics:Theory, Appl. Syst., Arlington, VA, Sep. 29–Oct., pp. 1–6, 2008.
[11]N. Pear, T. Heseltine and M. Romero, “From 3D