Temperature Compensated Electronic Nose for Fruit
Ripeness Determination Using Component Correction
Principal Component Analysis
John Victor M. Lim
1*, Noel B. Linsangan
1, Febus Reidj G. Cruz
1,2, Wen-Yaw Chung
21 Mapua Institute of Technology, Manila, Philippines.
2 Chung Yuan Christian University, Chungli, Taiwan R.O.C.
* Corresponding author. Email: [email protected] Manuscript submitted August 9, 2015; accepted December 24, 2015. doi: 10.17706/ijcce.2016.5.5.331-340
Abstract: The study integrates a component correction algorithm on the electronic nose, intended for fruit ripeness determination, to counteract the tendency of the electrochemical metal oxide sensors to drift. The drift is any unwanted deviation of the chemoreceptor response from the true value leading to erroneous and inconsistent results. The study utilizes CCPCA — Component Correction Principal Component Analysis to approximate and remove the temperature drift component. In using this algorithm, the study theorizes that the drift acquired from the simulation of temperature drift without any sample (clean air) could generalize the drift pattern or structure in sampling Lacatan aroma samples. The PCA or Principal Component Analysis is utilized for ‘dimensioanlity reduction’ and ‘data mining’ that uncovers patterns unobserved on the multidimensional data structure. The cluster Silhouette is computed to quantitatively validate the intracluster cohesion and intercluster separation. Using PCA, the electronic nose distinguished 630 Lacatan aroma samples on the PCA Loadings — PC1 (94.65%) and PC2 (3%) and significantly improved the clustering upon removal of temperature drift. The cluster Silhouette is improved from 0.7903 to 0.8571 (unripe), 0.5358 to 0.6080 (ripe), and 0.7784 to 0.8357 (overripe).
Key words: Counteracting temperature drift, Lacatan banana, improved clustering, enhanced ripeness determination, silhouette index.
1.
Introduction
The electronic nose or e–nose is one among todays emergent technology that mimics the human smell through an array of chemo–receptors and a pattern–recognition algorithm; this has been embraced in various industrial, agricultural, medical, and smart home functions. In comparison with its human counterpart, it has: 1) the epithelium that is comprised of the sensory neurons transducing and transmitting the chemicals in its immediate environment into patterns of elect rical signals to the brain; and 2) the brains pattern–recognition ability. Although numerous studies had delved into analysis of fruit volatiles with e–noses for ripeness determination: apple, bananas, blueberry, grape, peach, tomato, and mandarin [1]-[7]. This study intends at enhancing stability by building a temperature insensitive e–nose gearing towards the mechanisms portability.
realized.
A drift is the tendency of the metal oxide electro–chemical sensors to yield inconsistent readings due to 1) poisoning or aging of the sensor, and 2) change in environment humidity and temperature. In any system, inconsistency is not preferred as this may result to erroneous output and may demand periodic recalibration of the system to suit the current state or condition. Numerous mathematical algorithms had been developed to counteract the drift and one is a PCA based component correction algorithm CCPCA. In utilizing CCPCA for drift counteraction, this study assumes that the temperature drift approximated from sampling a clean air can be used to generalize the drift structure that is existent in sampling a fruit sample thus is deemed as the calibration group for CCPCA.
The intent of the study is counteract the temperature drift through a component correction algorithm based on PCA deemed as CCPCA. This study, in particular, aims at 1) building an electronic nose that captures the distinction of aromas from an unripe, ripe, and overripe Lacatan banana samples; 2) simulate the occurrence of the temperature drift; and 3) validate the clustering through the Silhouette indices.
The study’s importance lies on the integration of drift–correction algorithm on the electronic nose, eliminating system’s need for recurring calibration to suit the environment temperature; furthermore, the system homogenizes the “ripeness determination” through analysis of Volatiles emitted by a ripening fruit.
The study integrates metal oxide chemoreceptors: 10 MQ from the Winsen Electronics and 2 TGS from the Figaro Engineering Inc. though numerous forms of the sensor exist as 1) SAW — Surface Acoustic Wave, 2) QCM — Quartz Crystal Microbalance, 3) Optical, and 4) MEMS — Microelectromechanical Systems. The study centers on the Lacatan banana cultivar that is amongst the country’s lead fruit exports and does not include the fruit handling prior the sampling. The drift, due to the temperature, is simulated from 32oC to
38oC and is removed via the component correction algorithm CCPCA.
2.
Methodology
2.1.
Electronic Nose Hardware
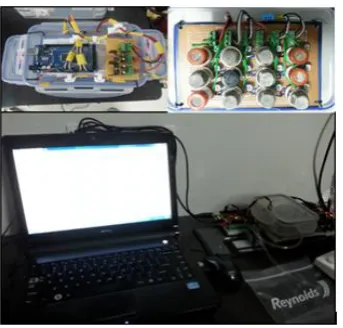
Fig. 1. Electronic nose hardware setup.
2.2.
Principal Component Analysis
The PCA — principal component analysis is a multivariate data–mining and dimensionality–reduction tool that lies common among regression and clustering functions. The tool uncovers any pattern/s that is unseen or unobserved on a multidimensional space through the projection of the n–points onto k orthogonal features or principal components that span the direction of maximum variance. The PCA, done on an m–by–n matrix (m and n denote the number of samples and dimensions accordingly), X, implies the computation of the eigenvalues and eigenvectors of its n–dimensional square Covariance matrix. The eigenvalues quantify the amount of information spanned on the direction of the nth feature or principal component and is normally arranged in ascending order. The PCA involves the following:
1) Mean subtraction — centering the mean
𝑋̅𝑖 =∑𝑚𝑗=1𝑋𝑗𝑖
𝑚 (1)
𝑋Mean_Centered = 𝑋 − 𝑋̅ (2)
2) Computation of the covariance matrix
Let k and i in Pk and Pi denote the kth and ith dimension on the m–by–n matrix X. Variance and the
n–dimensional square covariance matrix equates to (3), (4), and (5)
( ) =∑𝑚𝑗=1(𝑋𝑗𝑘 𝑋̅𝑘)
𝑚 (3)
( 𝑖) =
∑𝑚𝑗=1(𝑋𝑗𝑘 𝑋̅𝑘)(𝑋𝑗𝑖 𝑋̅𝑖)
𝑚 (4)
Matr = [
( ) ( )
( ) ( ) ] (5)
3) Computation of the eigenvalues (λ) and eigenvectors (V) 4) Feature selection — principal components (P)
Numerous methods were implemented with PCA to determine ‘What’ and ‘How many’ of the n
2.3.
Component Correction Principal Component Analysis
The component correction algorithm, introduced by Artursson et al., is a multivariate tool that eliminates unwanted occurrences of the chemoreceptor drift. The prime assumption of this algorithm lies on the thought that the exposure of the chemoreceptors to the same substance should result to uniform and consistent responses. This, furthermore, requires a reference group generalizing the drift structure or pattern in all other clusters. In using CCPCA, this study assumes that the temperature drift approximated from stimulating drift occurrence on sampling a clean air is also existent upon sampling banana samples. Thus is deemed as the reference cluster in the drift approximation and removal. CCPCA is given by (9) where VCal pertains to the eigenvectors (V) of the calibration group — the cluster that generalizes the drift
pattern or structure.
𝑋C rre ted= 𝑋 − (𝑋 ) (9)
2.4.
Silhouette Index
A Silhouette is a measure of intra–cluster cohesion and inter–cluster separation that computes the Squared Euclidean distances of the kth point to the others and designates an equivalent Silhouette Index. An
index near (+)1 implies that the kth point belongs to the correct cluster. If k is index of the kth point on the
PCA bi–plot, let a(k) be the mean dissimilarity of k from all other points of the same cluster and b(k) the mean dissimilarity of k from all other points on the neighboring cluster. The Silhouette index of the kth point
is computed through the (10).
( ) = a * ( ) ( )+ ( ) ( ) (10)
Table 1. Interpretation of the Silhouette Index of the kth Sample
s(k) Interpretation
s(k) close to 1 The kth sample lies within assigned cluster
s(k) is near 0 The kth sample lies on the border of 2 adjacent clusters
s(k) < 0 The kth sample lies within neighboring clusters
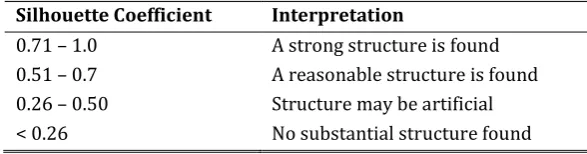
Table 2. Interpretation of the Mean Silhouette Coefficient of the Cluster
Silhouette Coefficient Interpretation
0.71 – 1.0 A strong structure is found
0.51 – 0.7 A reasonable structure is found
0.26 – 0.50 Structure may be artificial
2.5.
Experimentation
All Lacatan aroma sampling are done within a cold environment (air–conditioned) to attain a minimum temperature drop of 28oC, the sampling extends from 20 to 25 minutes until the temperature read by the
DHT11 equates to 38oC. Lacatan banana sample is then introduced at 28oC and accumulates within the
chamber for an extent of 5 minutes. At this instant, the temperature read by the DHT11 amounts to 32oC.
The fruit aroma sampling begins at 32oC, the point the aroma is assumed to have saturated the entire
volume of the container and ends at 38oC. A Matlab function extracts and returns the chemoreceptor
responses at the temperatures 32oC, 33oC, 34oC, 35oC, 36oC, 37oC, and 38oC. Prior sampling, all 12 MQ and
TGS are subjected to the environment air for an extent of 5 minutes to guarantee the full recovery of the chemoreceptors. This, furthermore, promotes consistency in the sampling of 90 Lacatan banana samples. The aroma sampling begins at 32oC since it is learnt that at this point, the aroma had saturated the entire
volume demonstrated by the saturation and the continuous, linear, yet gradual build-up in the chemoreceptor responses. This continuous linear build–up is then accounted to the temperature drift.
Fig. 2. (a) The temperature drift in chemoreceptor readings, and (b) the temperature — MQ/TGS sensor plot.
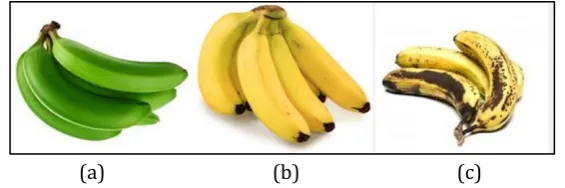
A total of ninety (90) Lacatan banana samples are involved in the experiment; of the ninety (90), a third or thirty (30) are brought into the chamber unripe, another thirty (30) are sampled ripe, and the remaining thirty (30) overripe. The distinction between an unripe, a ripe, and an overripe Lacatan banana samples is observed in Fig. 3.
(a) (b) (c)
Fig.3. (a) Unripe, (b) Ripe, and (c) Overripe Lacatan banana samples.
3.
Results and Discussion
3.1.
Evaluating e–Nose Function for Fruit Ripeness Determination
Fig.4. PCA bi–plot (Scores) of Lacatan aroma scores acquired at 32 degrees Celsius sampling temperature.
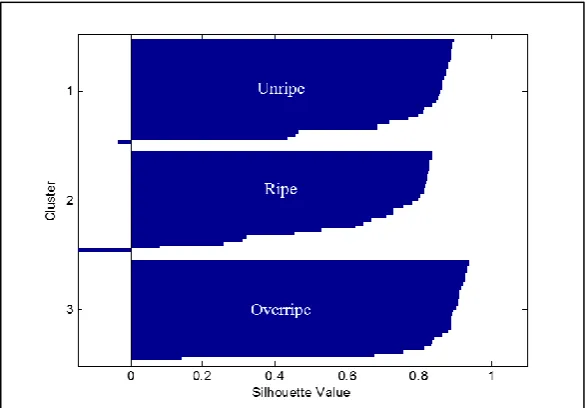
The silhouette indices of the 90 Lacatan aroma scores and the mean silhouette index of the 3 distinct fruit clusters are computed to evaluate the clustering. The computed indices and mean index are interpreted via Table 1 and Table 2. The unripe cluster has a mean silhouette index of 0.8156, ripe cluster has 0.6762, and overripe 0.8822. The silhouette plot is demonstrated on Fig. 5.
Fig.5. Silhouette of the 90 Lacatan aroma scores acquired at 32 degree Celsius sampling temperature.
3.2.
Simulation, Approximation, and Removal of Temperature Drift
from Fig. 2. that the MQ/TGS chemoreceptor values don’t converge to explicit values and continues to build–up with temperature. The direction and approximate magnitude of the same temperature drift could be exhibited on a 2 dimensional plane: PC1 (94.65%) and PC2 (3%) through PCA. The matrix of Lacatan aromas, with temperature drift, is 630–by–12 in dimension. The scores of 630 Lacatan aromas on the PCA plane is demonstrated on Fig. 6 and Fig. 7. The temperature drift’s direction is superimposed on the plot.
Fig.6. PCA bi–plot (Scores) of 630 Lacatan aromas under drift simulation.
(a) (b) (c)
Fig.7. PCA bi–plot (Scores) of (a) unripe, (b) ripe, and (c) overripe Lacatan aromas with drift direction superimposed on the plot.
The Lacatan aroma scores (on Fig. 6), bounded by the -300th and -200th index on PC1, do not belong to distinct fruit aroma cluster and may be mixed–up to unripe or ripe cluster. Thus, it is conclusive that occurrences of the temperature drift results to poor clustering on the PCA features — PC1 and PC2. Quantitatively, through the scores silhouette, the clustering of the 630 points evaluated and interpreted through Table 1 and Table 2. This Scores silhouette, furthermore, becomes the benchmark that is to be compared upon removal of drift component. The Unripe cluster has 0.7903 silhouette index, Ripe has 0.5358, and Overripe has 0.7784. The measure of cluster cohesion, demonstrated by the silhouette plot, and the mean silhouette indices of the 3 distinct fruit clusters, is demonstrated in Fig. 8.
Component correction–removal of unwanted temperature drift, is done by sampling clean environment air from 32oC to 38oC and their projection on 2 orthogonal features of maximum variance. Since from the
32nd to the 38th sampling temperature, the clean air continuously flow underneath the chemoreceptors, it is
Fig.8. The (a) clusters’ Silhouette and (b) mean Silhouette indices of Lacatan aroma scores under drift simulation.
Fig.9. PCA bi–plot (Scores) of Lacatan aromas (a) with the temperature drift prior CCPCA and (b) with the removal of temperature drift.
Apparently, on Fig. 9, the bi–plot of the Lacatan aroma scores with the temperature drift removed is more condensed than the bi–plot with the unwanted drift component. This is indicated on the scores silhouette as the 1st cluster (unripe) is improved from 0.7903 to 0.8571, the 2nd cluster (ripe) from 0.5358 to 0.6080, and the 3rd (overripe) from 0.7784 to 0.8357. The enhancement brought by removal of drift can be observed by a side-by-side comparison of the silhouette and mean silhouette indices of measurements taken prior and after CCPCA, this is demonstrated in Fig. 10 (Silhouette plot) and Fig. 11 (Mean silhouette indices).
Fig.11. Mean Silhouette indices of unripe, ripe, and overripe clusters (a) with the temperature drift and (b) without temperature drift.
4.
Conclusion
An electrochemical metal oxide chemoreceptor drifts upon exposure of the system to distinct range of temperature values resulting to recurring need for recalibration to suit the current environment condition. The system, along with the 10 MQ and 2 TGS chemoreceptors, could distinguish an unripe, ripe, and overripe Lacatan aroma samples through their projection on the 2 eigenvectors through PCA–PC1 (94%) and PC2 (3%) with the cluster Silhouettes of 0.8156, 0.6762, and 0.8822 accordingly. Introducing the drift through a gradual increase in sampling temperature from 32oC to 38oC influence the Lacatan aroma scores
on the principal components–PC1 (94.65%) and PC2 (3%) resulting to a reduced value of cluster Silhouettes of 0.7903, 0.5358, and 0.7784 accordingly. In removing temperature drift through CCPCA, the system used the drift acquired in the drift simulation for clean air from 32oC to 38oC as the ‘calibration’
group the generalizes the drift pattern in sampling Lacatan aroma scores. The effectivity of this method is quantified by the improvement of the cluster Silhouettes from 0.7903 to 0.8571 (unripe), 0.5358 to 0.6080 (ripe), and 0.7784 to 0.8357 (overripe).
Acknowledgment
The authors recognize the significant contributions of all the people and government organization who had been involved in the completion of this study. The authors thank the DOST–ERDT (Department of Science and Technology’s Engineering Research and Development for Technology) for the funding of this research.
References
[6] Gomez, A. H., Hu, G. X., Wang, J., & Pereira, A. G. (2006). Evaluation of tomato maturity by electronic nose. Computers and Electronics in Agriculture, 54(1), 44-52.
[7] Gomez, A. H., Wang, J., & Pereira, A. G. (2007). Mandarin ripeness monitoring and quality attribute evaluation using an electronic nose technique. Trans. ASABE, 50(6), 2137-2142.
[8] Zhang, F., et al. (2013). Advances in fruit aroma volatile research. Molecules, 18, 8200-8229.
[9] Malevski, Y., Gomez-Brito, L., Peleg, M., & Silberg, M. (1977). External color as maturity index of mango.
J. Food Sci., 42, 1316-1318.
[10] Jha, S. N., Kingsly, A. R. P., & Chopra, S. (2006). Non-destructive determination of firmness and yellowness of mango during growth and storage using visual spectroscopy. Biosystems Engineering,
94(3), 397-402.
[11] Chen, P., McCarthy, M. J., & Kauten, R. (1989). NMR for internal quality evaluation of fruits and vegetables. Trans. ASAE., 32, 1747–1753.
[12] Santulli, C., & Jeronimidis, G. (2006). Development of a method for nondestructive testing of fruits using scanning laser virometry (SLV). From http://www.ndt.net/article/v11n10/santulli.pdf
John Victor M. Lim was born in October 1992 in Manila, Philippines. He took up a bachelor degree of science in computer engineering (BS CpE) majored in microelectronics at the Mapua Institute of Technology, Manila, Philippines. He also took master of science in computer engineering (MS CpE) as a joint BS–MS program offered in the mentioned technological institution under the Department of Science and Technology
— Engineering Research and Development for Technology scholarship program. He completed both degrees in March 2015.