Identification of reference genes for RT-qPCR
analysis in peach genotypes with contrasting
chilling requirements
N. Marini1, C.B. Bevilacqua2, M.V. Büttow3, M.C.B. Raseira4 and S. Bonow4
1Laboratório de Fisiologia e Tecnologia de Pós-Colheita,
Embrapa Uva e Vinho, Bento Gonçalves, RS, Brasil
2Departamento de Defesa Fitossanitária,
Universidade Federal de Santa Maria, Santa Maria, RS, Brasil
3Centro de Pesquisa Celeste Gobbato, DPPA, Secretaria de Agricultura,
Pecuária e Irrigação, Distrito de Fazenda Souza, Caxias do Sul, RS, Brasil
4Embrapa Clima Temperado, Pelotas, RS, Brasil
Corresponding author: C.B. Bevilacqua E-mail: [email protected]
Genet. Mol. Res. 16 (2): gmr16029666 Received March 14, 2017
Accepted April 10, 2017 Published May 25, 2017
DOI http://dx.doi.org/10.4238/gmr16029666
Copyright © 2017 The Authors. This is an open-access article distributed under the terms of the Creative Commons Attribution ShareAlike (CC BY-SA) 4.0 License.
as reference genes are Act and UBQ10. This study is the first survey of the stability of reference genes in peaches under chilling stress and provides guidelines for more accurate RT-qPCR results.
Key words:Prunus persica; Housekeeping genes; Gene expression; RT-qPCR
INTRODUCTION
The peach (Prunus persica L. Batsch), one of the most important temperate fruit tree species, preceded only by apple and pear, is the species with the best genetic characterization, within the Rosaceae family.
The peach is a model fruit tree because it is economically interesting and has distinct advantages as its auto-compatible system and a short juvenile period (2 to 3 years). Moreover, this species is diploid (n = 8) and has a small genome (300 Mbp), estimated to be 0.61 pg (DNA/diploid nucleon) (Arús et al., 2012). The complete genome sequencing on the peach was finished in 2010 (Arús et al., 2012), and the significant amount expressed sequence tags has enabled genome and transcriptome studies in Prunus. Some studies assessing the expression of candidate genes involved in different metabolic pathways have determined which genes have important agronomic traits (Tittarelli et al., 2009; Vizoso et al., 2009). However, most of the studies about gene expression in peaches have been concerned with fruit quality and storage. In Brazil, there have been no reports of research involving gene expression in peaches.
Studies at the molecular level for low-chill requirement cultivars adapted to mild winter regions are still underexplored by peach breeding programs of Brazil. These assessments have been mostly based on the phenology of the plant (Raseira et al., 2008; Byrne, 2010). Studies of the genes involved in the chill requirement may provide genetic tools to, more rapidly, access their trait for genetic breeding (Leida et al., 2012). The validation of these genes and the gene expression profile in cultivars from the Embrapa’s gene bank and the Embrapa peach breeding program may contribute to a better understanding of the mechanisms involved with overcoming flower bud dormancy in new cultivars.
Reverse transcriptase quantitative real-time polymerase chain reaction (RT-qPCR) is a powerful technique for measuring gene expression levels of interesting genes (Ginzinger, 2002; Bustin, 2002) due to accuracy and reproducibility (Garson et al., 2005), which allows a straightforward comparison within different RNA abundance.
Many experimental variations compromise accurately to assess gene expression levels, such as the quality and amount of starting material, the presence of inhibitors in different sample materials, the primer design, and the RNA extraction and retrotranscription efficiencies (Andersen et al., 2004). The first step for gene expression studies performed by RT-qPCR is to select reference genes capable of normalizing different levels of expression of the target genes. The use of one or more reference genes has been applied to approach RT-qPCR data (Hamalainen et al., 2001; Chen et al., 2011).
of being analyzed (Cappelli et al., 2008). Reference genes are constitutively and universally expressed, and their products are necessary for cytoarchitecture or basic metabolism (Bustin, 2002; Xu et al., 2011). However, traditional reference genes, such as Act, Tubulin, EF1-α, and GAPDH, are not always universally expressed in different cases (Glare et al., 2002; Everaert et al., 2011; Migocka and Papierniak, 2011).
Therefore, the selection of the most stable gene or combined genes as internal controls is a critical step to control the variability between samples for quantitative relative gene expression studies, and it should be experimentally determined; otherwise it lead to erroneous gene expression profiles (Dheda et al., 2004; Tatsumi et al., 2008; Bustin et al., 2009). A single reference gene is not universal for all experiments (Nicot et al., 2005; Borowski et al., 2014; Galli et al., 2015).
Recently, a growing number of published articles have reflected the importance of reference genes and the need to validate them for each particular experimental model. Most of these studies have been done with plants, such as wheat (Paolacci et al., 2009), barley (Burton et al., 2004), rice (Kim et al., 2003; Ding et al., 2004; Jain et al., 2006), potato (Nicot et al., 2005), soybean (Jian et al., 2008), grape (Reid et al., 2006), poplar (Brunner et al., 2004), tomato (Coker and Davies, 2003; Expósito-Rodríguez et al., 2008), coffee (Barsalobres-Cavallari et al., 2009), Arabidopsis thaliana (Czechowski et al., 2005; Remans et al., 2008), sugarcane (Iskandar et al., 2004), Eremosparton songoricum (Li et al., 2012), Lolium perenne (Lee et al., 2010), lettuce (Borowski et al., 2014), strawberry (Galli et al., 2015), and Salicornia europaea (Xiao et al., 2015).
In peaches, a study was performed with tissue samples, including root, leaf, stem, flower, and fruit samples at different developmental stages, which is the only one study of reference genes performed. The genes TEF2, UBQ10, and RPII were carried out as the most suitable reference genes (Tong et al., 2009).
Accordingly, there are no reports on the suitability of reference genes for RT-qPCR studies of the differential expression of genes under low-chill conditions in flower buds of peach cultivars. Therefore, the present study was conducted to evaluate and select the stability of five reference genes for the purpose of normalization in studying gene expression of Prunus persica cultivars with different chilling requirements.
MATERIAL AND METHODS
Plant materials
For this experiment, nine peach genotypes from Embrapa’s peach breeding program were selected. These genotypes were classified according to the chill requirement as follows: high-chill requirement cultivars (Planalto, Della Nona, Chiripá, Maria Bianca, Flor da King); intermediate-chill requirement cultivars (Esmeralda); low-chill requirement cultivars (Libra, Bonão, Aurora).
Tissue harvested
chilling hours, according to the model of Weinberger (1950), were obtained from the Embrapa Temperate Climate - Agrometeorology Station (Pelotas city, Rio Grande do Sul State, Brazil). Chilling hours were counted as the number of hours below 7.2°C in the year.
The flower buds sampled were of equal weight (100 mg), frozen in liquid nitrogen, and stored in an ultra-freezer (-80°C) until the RNA isolation step.
Total RNA extraction and cDNA synthesis
The total RNA was isolated using the method described by Tong et al. (2012), with a few modifications. RNA isolation was conducted in triplicate for each biological replicate. The RNA concentration and quality were evaluated by spectrometry using the A260/A280 and A260/A230 ratios in a spectrophotometer Nanovue 4282 (GE Healthcare). The total RNA (1 μg) was digested with 1 U DNase I and DNase 1 x reaction buffer (Invitrogen) before cDNA synthesis. To amplify the protein-coding traditional and novel reference genes, all the digested RNA was reverse-transcribed using the M-MLV enzyme and oligo-dT primers according to the manufacturer’s instructions (Invitrogen).
Selection of peach sequences and validation of the primers
Five candidate reference genes were used in this study (Act, TEF2, RPII, UBQ10, and Tua5); these genes have been reported to be good potential candidates in previously published studies (Table 1). The primer efficiency was tested for each primer pair using a 7500 Fast Real-Time PCR system (Applied Biosystems, Life Technologies) via standard RT-qPCR to check for the size specificity of the amplicon by 2.5% agarose gel electrophoresis.
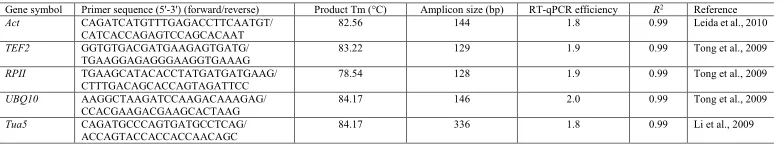
Table 1. Candidate reference gene descriptions and parameters derived from the RT-qPCR analysis.
Gene symbol Primer sequence (5'-3') (forward/reverse) Product Tm (°C) Amplicon size (bp) RT-qPCR efficiency R2 Reference
Act CAGATCATGTTTGAGACCTTCAATGT/
CATCACCAGAGTCCAGCACAAT 82.56 144 1.8 0.99 Leida et al., 2010
TEF2 GGTGTGACGATGAAGAGTGATG/
TGAAGGAGAGGGAAGGTGAAAG 83.22 129 1.9 0.99 Tong et al., 2009
RPII TGAAGCATACACCTATGATGATGAAG/
CTTTGACAGCACCAGTAGATTCC 78.54 128 1.9 0.99 Tong et al., 2009
UBQ10 AAGGCTAAGATCCAAGACAAAGAG/
CCACGAAGACGAAGCACTAAG 84.17 146 2.0 0.99 Tong et al., 2009
Tua5 CAGATGCCCAGTGATGCCTCAG/
ACCAGTACCACCACCAACAGC 84.17 336 1.8 0.99 Li et al., 2009
Melting temperature was calculated by the SDS version 1.1 software in a 7500 Real-Time Fast thermocycler (Applied Biosystems). RT-qPCR efficiency and correlation coefficients (R2) were determined by the LinReg PCR program.
RT-qPCR with Platynum SYBR Green qPCR SuperMix
The RT-qPCR experiments were carried out in triplicate using a7500 Fast Real-Time PCR system (Applied Biosystems, Life Technologies) and a Platynum SYBR Green qPCR SuperMix (Invitrogen, Life Technologies). The PCR volume was 10 µL, containing 1.0 µL diluted cDNA and at a concentration of 0.2 µM for each primer.
reverse-transcription negative control to check for potential genomic DNA contamination. The experiment was carried out in three biological replicates with three technical replicates, and the mean was used for RT-qPCR analysis.
Data analysis
To estimate the expression stability of the five candidate reference genes, all the amplification plots were analyzed with a threshold fluorescence value of 0.1 to obtain the amplification cycle (Cq) values using the SDS software, version 1.1 (Applied Biosystems).
The primer efficiency was determined by the LinReg PCR v7.5 software (Ramakers et al., 2003), and the expression stability was evaluated using the geNorm (version 3.5, Vandesompele et al., 2002) and NormFinder (version 0.953, Andersen et al., 2004) software packages for Microsoft Excel and using the BestKeeper software (version 1.0, Pfaffl et al., 2004). The RT-qPCR data were exported into an Excel data sheet (Microsoft Excel 2010), and the Ct values were calculated with the software.
Therefore, all these approaches measure and rank by different ways the reference genes stability. The geNorm software calculates the average of the pairwise variation for a candidate reference gene with each all of the other genes tested; the result is described as M value (Vandesompele et al., 2002). Genes with high variabilities have high M values, which indicate low expression stabilities (cut-off of 1.5). The geNorm software also calculates a normalization factor for each sample and suggests the optimal number of reference genes necessary to normalize the experiment. The NormFinder software performed by ANOVA-based model considering intra- and inter-group variation of the candidate reference genes to evaluate the expression stability and provide a direct measure of the variation (Andersen et al., 2004).
Validation of reference gene analysis
The validation experiment for primers was based on the specificity of the amplification for the five genes (Act, RPII, TEF2, Tua5, and UBQ10) selected as reference genes. The RT-qPCR amplification conditions were the same as those described above. The relative expression data were calculated according to the 2-∆∆Ct method and were presented as
fold-changes (Livak and Schmittgen, 2001). Samples from plants under control condition (0 h chill time) were used as reference samples.
RESULTS AND DISCUSSION
Description and expression profiling of candidate reference genes
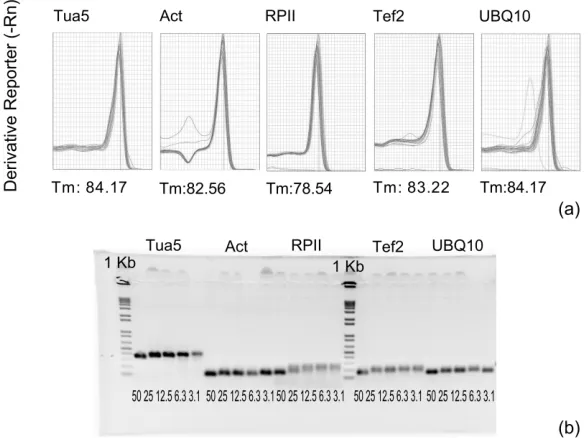
The specificity of the candidate reference genes was confirmed by the existence of a single peak in the melting curves (Figure 1a) and by a single band with the expected size in 2.5% agarose gel electrophoresis (Figure 1b).
Figure 1. Specificity of amplified bands. a. Primer dissociation curves generated for the RT-qPCR system according to the 7500 SDS software program (Applied Biosystems). The y-axis indicates the rate of change in the SYBR Green fluorescence according to the temperature; the x-axis shows the temperature. b. Agarose gel (2%) showing the amplification of a specific band for each primer pair. Each gene was tested with a pool of cDNA samples of five different concentrations.
Within the genes assessed as reference genes, Act and UBQ10 had the most efficient primers and the best primer combination using all of the software packages, as assessed using the 7500 SDS software package (Applied Biosystems) and the LinReg PCR v7.5 software (Ramakers et al., 2003).
Identifying the best reference genes designed for the transcription profiling of the five genes (Act, TEF2, RPII, UBQ10, and Tua5), Tong et al. (2009) showed that the gene expression tested was not stable between different samples of Prunus persica. The most stable genes were TEF2, UBQ10, and RPII for different tissues, genotypes and environmental conditions. Some studies used other genes as reference genes, including Act (Leida et al., 2010, 2012) and Tua5 (Li et al., 2009).
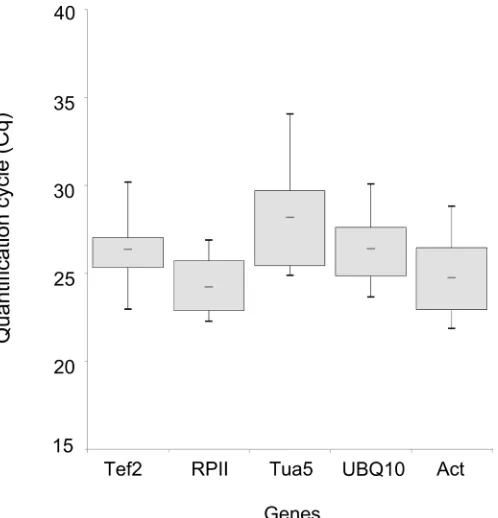
The genes RPII, UBQ10, and Act demonstrated lower Cq variations (less than seven cycles) between the contrasting genotypes tested. This result indicated that there was no single reference gene for all tissues and all experiments in peaches. Therefore, it is extremely important to select a set of reference genes for the normalization expression under particular experimental conditions (Tong et al., 2009).
Expression stability of all candidate reference genes under chilling requirement in peach
The expression stabilities of the candidate reference genes were determined by quantifying the mRNA levels by RT-qPCR. For each gene, we calculated the Cq value, which represents the cycle at which a significant increase of the PCR product occurs. In general, the stability is marked by the middle of the exponential phase of the amplification (Bustin, 2002). Using three different software packages (geNorm, NormFinder, and BestKeeper) to determine the best reference genes for this experiment, the results were very similar, which indicated good accuracy.
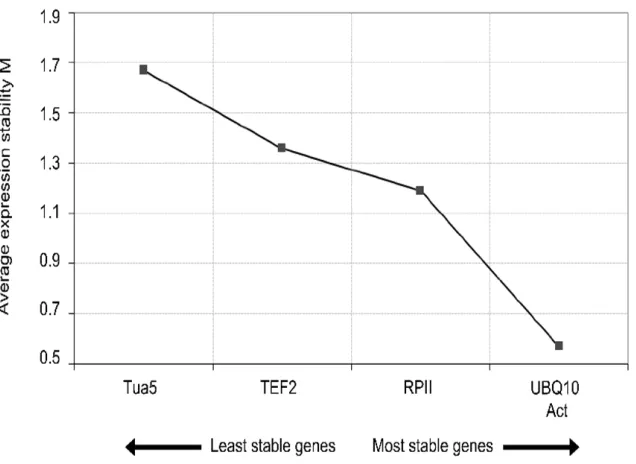
The stability of gene expression (M) in the five reference genes was initially checked by geNorm. The program recommends using reference genes with an M value below the threshold of 1.5 (Vandesompele et al., 2002). According to this criterium, four of the five candidate reference genes tested in this study were considered to be rather stable and presented M values lower than 1.5 (Figure 3).
The geNorm software is a Visual Basic application tool for Microsoft Excel and relies on the principle that the expression ratio of two perfect reference genes should be constant throughout different experimental conditions or cell types. The M value is defined as the average pairwise variation of an individual gene with all the other tested reference genes, whereas the variation between one reference gene and another is determined as the standard deviation of the log2-transformed expression level ratios.
The gene with the lowest M value is considered the most stable, whereas a higher value of M indicates less stable expression. The genes with the lowest M values in this study were UBQ10 and Act (M = 0.49 and 0.60, respectively).
To confirm the geNorm results, we used the NormFinder software, which performs an ANOVA-based mathematical model to estimate the intra- and inter-group variations of the candidate reference genes and, thereby, to evaluate the expression stability and provide a direct measure of variation (Andersen et al., 2004). NormFinder identifies the optimal number of reference genes in a set of genes assessed. More stable gene expression is indicated by lower average expression stability values.
According to this approach, the gene UBQ10 was the most stable, UBQ10 and Act were the best combinations of normalizing genes, with 0.120 and 0.142 stability values, respectively, and Tua5 was the least stable gene, as was previously observed in the geNorm analysis (Figure 2). The differences observed between the geNorm and NormFinder results were expected because the two software programs are based on different statistical algorithms.
for normalizing RT-qPCR expression analysis, which is in agreement with the results observed by Kulcheski et al. (2010). However, it is important to consider that not all of the genes tested were constitutively expressed under different conditions, and the universality of these results needs to be demonstrated in other plants and under other experimental conditions.
The Bestkeeper software calculates paired correlations among all possible reference genes from the Cq values of each gene. Using this software, all genes may be included in the calculation of the BestKeeper index, which can be used to rank the best reference genes because stable reference genes show strong correlations with the BestKeeper index (Pfaffl et al., 2004). In this experiment, the highest correlation was identified between the Act and UBQ10 genes (0.968; P = 0.001), with these two being the most suitable genes for normalization.
Therefore, the Bestkeeper, geNorm, and Normfinder software packages determined that the most stable genes to be used as reference genes, among the candidate reference genes tested, are Act and UBQ10. These two genes combined constitute the best normalization in gene expression studies involving genes of Prunus persica related to a low-chill requirement in peach flower buds.
Conflicts of interest
The authors declare no conflict of interest.
ACKNOWLEDGMENTS
The authors would like to thank the Brazilian agency CNPq/PDJ for financial support.
REFERENCES
Andersen CL, Jensen JL and Ørntoft TF (2004). Normalization of real-time quantitative reverse transcription-PCR data: a model-based variance estimation approach to identify genes suited for normalization, applied to bladder and colon cancer data sets. Cancer Res. 64: 5245-5250. https://doi.org/10.1158/0008-5472.CAN-04-0496
Arús P, Verde I, Sosinski B, Zhebentyayeva T, et al. (2012). The peach genome. Tree Genet. Genomes 8: 531-547. https:// doi.org/10.1007/s11295-012-0493-8
Barsalobres-Cavallari CF, Severino FE, Maluf MP and Maia IG (2009). Identification of suitable internal control genes for expression studies in Coffea arabica under different experimental conditions. BMC Mol. Biol. 10: 1. https://doi. org/10.1186/1471-2199-10-1
Borowski JM, Galli V, Messias RdaS, Perin EC, et al. (2014). Selection of candidate reference genes for real-time PCR studies in lettuce under abiotic stresses. Planta 239: 1187-1200.
Brunner AM, Yakovlev IA and Strauss SH (2004). Validating internal controls for quantitative plant gene expression studies. BMC Plant Biol. 4: 14. https://doi.org/10.1186/1471-2229-4-14
Burton RA, Shirley NJ, King BJ, Harvey AJ, et al. (2004). The Ces A Gene Family of Barley. Quantitative Analysis of Transcripts Reveals Two Groups of Co-Expressed Genes. Plant Physiol. 134: 224-236. https://doi.org/10.1104/ pp.103.032904
Bustin SA (2002). Quantification of mRNA using real-time reverse transcription PCR (RT-PCR): trends and problems. J.
Mol. Endocrinol. 29: 23-39. https://doi.org/10.1677/jme.0.0290023
Bustin SA, Benes V, Garson JA, Hellemans J, et al. (2009). The MIQE guidelines: minimum information for publication of quantitative real-time PCR experiments. Clin. Chem. 55: 611-622. https://doi.org/10.1373/clinchem.2008.112797
Byrne DH (2010). Environment challenges of breeding peaches for low chill regions. Acta Hortic. 129-138. https://doi. org/10.17660/ActaHortic.2010.872.15
Chen L, Zhong HY, Kuang JF, Li JG, et al. (2011). Validation of reference genes for RT-qPCR studies of gene expression in banana fruit under different experimental conditions. Planta 234: 377-390. https://doi.org/10.1007/s00425-011-1410-3
Coker JS and Davies E (2003). Selection of candidate housekeeping controls in tomato plants using EST data. Biotechniques
35: 740-742, 744, 746 passim.
Czechowski T, Stitt M, Altmann T, Udvardi MK, et al. (2005). Genome-wide identification and testing of superior reference genes for transcript normalization in Arabidopsis. Plant Physiol. 139: 5-17. https://doi.org/10.1104/pp.105.063743
Derveaux S, Vandesompele J and Hellemans J (2010). How to do successful gene expression analysis using real-time PCR.
Methods 50: 227-230. https://doi.org/10.1016/j.ymeth.2009.11.001
Dheda K, Huggett JF, Bustin SA, Johnson MA, et al. (2004). Validation of housekeeping genes for normalizing RNA expression in real-time PCR. Biotechniques 37: 112-114, 116, 118-119.
Ding J, Jia J, Yang L, Wen H, et al. (2004). Validation of a rice specific gene, sucrose phosphate synthase, used as the endogenous reference gene for qualitative and real-time quantitative PCR detection of transgenes. J. Agric. Food
Chem. 52: 3372-3377. https://doi.org/10.1021/jf049915d
Everaert BR, Boulet GA, Timmermans JP and Vrints CJ (2011). Importance of suitable reference gene selection for quantitative real-time PCR: special reference to mouse myocardial infarction studies. PLoS One 6: e23793. https:// doi.org/10.1371/journal.pone.0023793
Expósito-Rodríguez M, Borges AA, Borges-Pérez A and Pérez JA (2008). Selection of internal control genes for quantitative real-time RT-PCR studies during tomato development process. BMC Plant Biol. 8: 131. https://doi. org/10.1186/1471-2229-8-131
Galli V, Borowski JM, Perin EC, Messias RdaS, et al. (2015). Validation of reference genes for accurate normalization of gene expression for real time-quantitative PCR in strawberry fruits using different cultivars and osmotic stresses.
Gene 554: 205-214. https://doi.org/10.1016/j.gene.2014.10.049
Garson JA, Grant PR, Ayliffe U, Ferns RB, et al. (2005). Real-time PCR quantitation of hepatitis B virus DNA using automated sample preparation and murine cytomegalovirus internal control. J. Virol. Methods 126: 207-213. https:// doi.org/10.1016/j.jviromet.2005.03.001
Ginzinger DG (2002). Gene quantification using real-time quantitative PCR: an emerging technology hits the mainstream.
Experimental Hematology. 30:503-512.
Glare EM, Divjak M, Bailey MJ and Walters EH (2002). β-Actin and GAPDH housekeeping gene expression in asthmatic airways is variable and not suitable for normalising mRNA levels. Thorax 57: 765-770. https://doi.org/10.1136/ thorax.57.9.765
Hamalainen HK, Tubman JC, Vikman S, Kyrölä T, et al. (2001). Identification and validation of endogenous reference genes for expression profiling of T helper cell differentiation by quantitative real-time RT-PCR. Anal. Biochem. 299: 63-70. https://doi.org/10.1006/abio.2001.5369
Iskandar HM, Simpson RS, Casu RE, Bonnett GD, et al. (2004). Comparison of reference genes for quantitative real-time polymerase chain reaction analysis of gene expression in sugarcane. Plant Mol. Biol. Report. 22: 325-337. https:// doi.org/10.1007/BF02772676
Jain M, Nijhawan A, Tyagi AK and Khurana JP (2006). Validation of housekeeping genes as internal control for studying gene expression in rice by quantitative real-time PCR. Biochem. Biophys. Res. Commun. 345: 646-651. https://doi. org/10.1016/j.bbrc.2006.04.140
Jian B, Liu B, Bi Y, Hou W, et al. (2008). Validation of internal control for gene expression study in soybean by quantitative real-time PCR. BMC Mol. Biol. 9: 59. https://doi.org/10.1186/1471-2199-9-59
Kim BR, Nam HY, Kim SU, Kim SI, et al. (2003). Normalization of reverse transcription quantitative-PCR with housekeeping genes in rice. Biotechnol. Lett. 25: 1869-1872. https://doi.org/10.1023/A:1026298032009
Kulcheski FR, Marcelino FC, Nepomuceno AL, Abdelnoor RV, et al. (2010). The use of microRNAs as reference genes for quantitative PCR in soybean. Anal. Biochem. 406: 185-192. https://doi.org/10.1016/j.ab.2010.07.020
Lee JM, Roche JR, Donaghy DJ, Thrush A, et al. (2010). Validation of reference genes for quantitative RT-PCR studies of gene expression in perennial ryegrass (Lolium perenne L.). BMC Mol. Biol. 11: 8. https://doi.org/10.1186/1471-2199-11-8
Leida C, Terol J, Martí G, Agustí M, et al. (2010). Identification of genes associated with bud dormancy release in Prunus
persica by suppression subtractive hybridization. Tree Physiol. 30: 655-666. https://doi.org/10.1093/treephys/tpq008
Leida C, Romeu J, García-Brunton G, Ríos G, et al. (2012). Gene expression analysis of chilling requirements for flower bud break in peach. Plant Breed. 13: 329-334. https://doi.org/10.1111/j.1439-0523.2011.01946.x
Li XS, Yang HL, Zhang DY, Zhang YM, et al. (2012). Reference gene selection in the desert plant Eremosparton
Li Z, Reighard GL, Abbott AG and Bielenberg DG (2009). Dormancy-associated MADS genes from the EVG locus of peach [Prunus persica (L.) Batsch] have distinct seasonal and photoperiodic expression patterns. J. Exp. Bot. 60: 3521-3530. https://doi.org/10.1093/jxb/erp195
Livak KJ and Schmittgen TD (2001). Analysis of relative gene expression data using real-time quantitative PCR and the 2(-Delta Delta C(T)) Method. Methods 25: 402-408. https://doi.org/10.1006/meth.2001.1262
Migocka M and Papierniak A (2011). Identification of suitable reference genes for studying gene expression in cucumber plants subjected to abiotic stress and growth regulators. Mol. Breed. 28: 343-357. https://doi.org/10.1007/s11032-010-9487-0
Nicot N, Hausman JF, Hoffmann L and Evers D (2005). Housekeeping gene selection for real-time RT-PCR normalization in potato during biotic and abiotic stress. J. Exp. Bot. 56: 2907-2914. https://doi.org/10.1093/jxb/eri285
Paolacci AR, Tanzarella OA, Porceddu E and Ciaffi M (2009). Identification and validation of reference genes for quantitative RT-PCR normalization in wheat. BMC Mol. Biol. 10: 11. https://doi.org/10.1186/1471-2199-10-11
Pfaffl MW, Tichopad A, Prgomet C and Neuvians TP (2004). Determination of stable housekeeping genes, differentially regulated target genes and sample integrity: BestKeeper--Excel-based tool using pair-wise correlations. Biotechnol.
Lett. 26: 509-515. https://doi.org/10.1023/B:BILE.0000019559.84305.47
Ponton F, Chapuis MP, Pernice M, Sword GA, et al. (2011). Evaluation of potential reference genes for reverse transcription-qPCR studies of physiological responses in Drosophila melanogaster. J. Insect Physiol. 57: 840-850.
https://doi.org/10.1016/j.jinsphys.2011.03.014
Ramakers C, Ruijter JM, Deprez RHL and Moorman AF (2003). Assumption-free analysis of quantitative real-time polymerase chain reaction (PCR) data. Neurosci. Lett. 339: 62-66. https://doi.org/10.1016/S0304-3940(02)01423-4
Raseira MCB, Barbosa W, Nakasu BH and Pereira JFM (2008). Pêssego. In: Albuquerque, A. C. S., A. G. DA. Silva, Agricultura Tropical Quatro décadas de inovações tecnológicas, institucionais e políticas. (Org.) 1 ed. Brasília. D.F.: Embrapa Informação Tecnológica. 1, 519-529.
Reid KE, Olsson N, Schlosser J, Peng F, et al. (2006). An optimized grapevine RNA isolation procedure and statistical determination of reference genes for real-time RT-PCR during berry development. BMC Plant Biol. 6: 27. https://doi. org/10.1186/1471-2229-6-27
Remans T, Smeets K, Opdenakker K, Mathijsen D, et al. (2008). Normalisation of real-time RT-PCR gene expression measurements in Arabidopsis thaliana exposed to increased metal concentrations. Planta 227: 1343-1349. https:// doi.org/10.1007/s00425-008-0706-4
Schmittgen TD and Zakrajsek BA (2000). Effect of experimental treatment on housekeeping gene expression: validation by real-time, quantitative RT-PCR. J. Biochem. Biophys. Methods 46: 69-81. https://doi.org/10.1016/S0165-022X(00)00129-9
Tatsumi K, Ohashi K, Taminishi S, Okano T, et al. (2008). Reference gene selection for real-time RT-PCR in regenerating mouse livers. Biochem. Biophys. Res. Commun. 374: 106-110. https://doi.org/10.1016/j.bbrc.2008.06.103
Thellin O, Zorzi W, Lakaye B, De Borman B, et al. (1999). Housekeeping genes as internal standards: use and limits. J.
Biotechnol. 75: 291-295. https://doi.org/10.1016/S0168-1656(99)00163-7
Tittarelli A, Santiago M, Morales A, Meisel LA, et al. (2009). Isolation and functional characterization of cold-regulated promoters, by digitally identifying peach fruit cold-induced genes from a large EST dataset. BMC Plant Biol. 9: 121.
https://doi.org/10.1186/1471-2229-9-121
Tong Z, Gao Z, Wang F, Zhou J, et al. (2009). Selection of reliable reference genes for gene expression studies in peach using real-time PCR. BMC Mol. Biol. 10: 71. https://doi.org/10.1186/1471-2199-10-71
Tong Z, Qu S, Zhang J, Wang F, et al. (2012). A modified protocol for RNA extraction from different peach tissues suitable for gene isolation and real-time PCR analysis. Mol. Biotechnol. 50: 229-236. https://doi.org/10.1007/s12033-011-9433-3
Vandesompele J, Preter K, Poppe De B, et al. (2002). Accurate normalization of real-time quantitative RT -PCR data by geometric averaging of multiple internal control genes. Genome Biology 3:(7) 0034.1-0034.11.
Vizoso P, Meisel LA, Tittarelli A, Latorre M, et al. (2009). Comparative EST transcript profiling of peach fruits under different post-harvest conditions reveals candidate genes associated with peach fruit quality. BMC Genomics 10: 423.
https://doi.org/10.1186/1471-2164-10-423
Weinberger JH (1950). Chilling requirements of peach varieties. Proc. Am. Soc. Hortic. Sci. 56: 122-128.
Xiao X, Ma J, Wang J, Wu X, et al. (2015). Validation of suitable reference genes for gene expression analysis in the halophyte Salicornia europaea by real-time quantitative PCR. Front. Plant Sci. 5: 788. https://doi.org/10.3389/ fpls.2014.00788