©FUNPEC-RP www.funpecrp.com.br Genetics and Molecular Research 18 (2): gmr18123
open pollinated corn genotypes
C. Troyjack1, J.R. Pimentel1, I.R. Carvalho1, V.J. Szareski1, G.T. Junior2, Í.T.P. Dubal1, G.H. Demari1, L.B.A. Jaques1, F. Kock1, S.M. Delagostin1, F. Lautenchleger2, F.A. Villela1, T.Z. Aumonde1 and T. Pedó1
1
Universidade Federal de Pelotas, Capão do Leão, RS, Brasil
2
Universidade Estadual Universidade Estadual do Centro-Oeste, Guarapuava, PR, Brasil
Corresponding author: I.R. Carvalho E-mail: [email protected]
Genet. Mol. Res. 18 (2): gmr18123 Received August 23, 2018 Accepted March 28, 2019 Published May 13, 2019
DOI http://dx.doi.org/10.4238/gmr18123
©FUNPEC-RP www.funpecrp.com.br Genetics and Molecular Research 18 (2): gmr18123
tendency for tall stature plants to increase seed yield of open pollinated corn. The most polymorphic characters were plant height and ear insertion, response to cold test, and thousand seed weight. The productivity and seed quality trends that were observed will allow us to plan further research on open pollinated varieties to allow selection and development of superior genotypes for seed productivity and quality in the extreme south of Brazil.
Key words: Zea mays; Production of seeds; Byometric models; Univariate; Multivariate approach
INTRODUCTION
Corn (Zea mays) is a crop with great commercial application, originating from Mexico (Marchi, 2008). This cereal has significant economic, social and agricultural importance, since it is one of the main cultivated species in the world, with multiple purposes of use, including human and animal food, bioproducts and biofuels (Ferreira Júnior et al., 2014). This cereal stands out in Brazil with more than 96 million tons of grains produced in the 2016/2017 harvest in an area of 18 million hectares (Conab, 2017).
In this context, it is relevant to determine the performance of corn genotypes, in order to direct the management strategies to be used, so that there are no limiting abiotic or biotic factors throughout the production cycle. Consequently, understanding the genetic basis of the genotypes is essential for the adequate planning of the crop, being available more than 3,000 varieties of open pollinated and hybrid corn (Morris et al., 2003), including simple, modified, double and triple hybrids (Sangoi et al., 2006).
Under conditions that employ relatively unsophisticated growing technologies, maize hybrids may show inferior performance compared to open pollinated varieties (Pipolo, 2010). Open pollinated genotypes, though they are less productive, are important sources of genetic variability for breeding programs, which seek superior genetic constitutions and alleles for production under adverse biotic and abiotic conditions (Araújo and Nass, 2002).
Ge
MATERIAL
This work was carried out in the agricultural harvest of 2016/2017 in Entre
located in the Northwest Region of Rio Grande do Sul, Brazil. This environment has an altitude of 215 meters, Latitude 28º 21 '32 "S and Longitude 54º 16' 04" W. The climate is humid subtropical of the Cfa type according to the classification of Köppen and the annual precipitation is approximately 2000 mm. The soil is characterized as Typic
(Streck et al., 2008). During the experiment, the monthly maximum temperature and minimum of the air and rainfall, obtained by data from INMET (National Institute of Meteorology), were obta
Figure 1.
during the months of December 2016 to March 2017
on the soil analysis (Table 1). Spatial separation of genoty pollination and varietal mixtures (Brasil, 2009).
Table 1.
aluminum (Al), cation exchange capacity (CEC), organic matter (OM) and clay o
pH(H20)
6.0
725, PL 796, PL 804 and
RS, at the geographic coordinates 27
minimum germination of 95%, planted in a conventional sowing system, with a line spacing of 0.45 meters and a p
2007). The experimental units
characters were measured in 10 random and homogeneous plants in the experimental unit:
fully expanded leaf, results in centimeters.
of the first viable ear, results in centimeters.
Genetics and Molecular Research 18
MATERIAL AND
This work was carried out in the agricultural harvest of 2016/2017 in Entre
located in the Northwest Region of Rio Grande do Sul, Brazil. This environment has an ltitude of 215 meters, Latitude 28º 21 '32 "S and Longitude 54º 16' 04" W. The climate is humid subtropical of the Cfa type according to the classification of Köppen and the annual precipitation is approximately 2000 mm. The soil is characterized as Typic
(Streck et al., 2008). During the experiment, the monthly maximum temperature and minimum of the air and rainfall, obtained by data from INMET (National Institute of Meteorology), were obta
Figure 1. Monthly averages of maximum
during the months of December 2016 to March 2017
Sowing was done in a previously fertilized area and soil acidity was corrected based on the soil analysis (Table 1). Spatial separation of genoty
pollination and varietal mixtures (Brasil, 2009).
Table 1. Acidity (pH), phosphorus (P), potassium (K), sulfur (S), calcium (Ca), magnesium (Mg), aluminum (Al), cation exchange capacity (CEC), organic matter (OM) and clay o
mg.dm
(H20) P
4.7
The treatments were composed of six open 725, PL 796, PL 804 and
RS, at the geographic coordinates 27
minimum germination of 95%, planted in a conventional sowing system, with a line spacing of 0.45 meters and a p
2007). The experimental units
characters were measured in 10 random and homogeneous plants in the experimental unit: - Plant height
fully expanded leaf, results in centimeters. - Ear insertion height (EHE): of the first viable ear, results in centimeters.
olecular Research 18
Associations of traits of importance in maize
AND METHODS
This work was carried out in the agricultural harvest of 2016/2017 in Entre
located in the Northwest Region of Rio Grande do Sul, Brazil. This environment has an ltitude of 215 meters, Latitude 28º 21 '32 "S and Longitude 54º 16' 04" W. The climate is humid subtropical of the Cfa type according to the classification of Köppen and the annual precipitation is approximately 2000 mm. The soil is characterized as Typic
(Streck et al., 2008). During the experiment, the monthly maximum temperature and minimum of the air and rainfall, obtained by data from INMET (National Institute of Meteorology), were obtained (Figure 1).
y averages of maximum
during the months of December 2016 to March 2017
Sowing was done in a previously fertilized area and soil acidity was corrected based on the soil analysis (Table 1). Spatial separation of genoty
pollination and varietal mixtures (Brasil, 2009).
Acidity (pH), phosphorus (P), potassium (K), sulfur (S), calcium (Ca), magnesium (Mg), aluminum (Al), cation exchange capacity (CEC), organic matter (OM) and clay o
dm-3
K 147.5
The treatments were composed of six open
725, PL 796, PL 804 and PL 861) commonly used by family farmers of Ametista do Sul RS, at the geographic coordinates 27
minimum germination of 95%, planted in a conventional sowing system, with a line spacing of 0.45 meters and a population density of 55,000 plants per hectare (Borghi and Crusciol, 2007). The experimental units
characters were measured in 10 random and homogeneous plants in the experimental unit: Plant height (PHE):
fully expanded leaf, results in centimeters. Ear insertion height (EHE): of the first viable ear, results in centimeters.
olecular Research 18 (2): gmr18123
Associations of traits of importance in maize
METHODS
This work was carried out in the agricultural harvest of 2016/2017 in Entre
located in the Northwest Region of Rio Grande do Sul, Brazil. This environment has an ltitude of 215 meters, Latitude 28º 21 '32 "S and Longitude 54º 16' 04" W. The climate is humid subtropical of the Cfa type according to the classification of Köppen and the annual precipitation is approximately 2000 mm. The soil is characterized as Typic
(Streck et al., 2008). During the experiment, the monthly maximum temperature and minimum of the air and rainfall, obtained by data from INMET (National Institute of
ined (Figure 1).
y averages of maximum ( ) and minimum temperatures ( during the months of December 2016 to March 2017
Sowing was done in a previously fertilized area and soil acidity was corrected based on the soil analysis (Table 1). Spatial separation of genoty
pollination and varietal mixtures (Brasil, 2009).
Acidity (pH), phosphorus (P), potassium (K), sulfur (S), calcium (Ca), magnesium (Mg), aluminum (Al), cation exchange capacity (CEC), organic matter (OM) and clay o
S Ca
18.9 6.1
The treatments were composed of six open
PL 861) commonly used by family farmers of Ametista do Sul RS, at the geographic coordinates 27o 21' S and 53
minimum germination of 95%, planted in a conventional sowing system, with a line spacing opulation density of 55,000 plants per hectare (Borghi and Crusciol, 2007). The experimental units were 16.20 m², with a spac
characters were measured in 10 random and homogeneous plants in the experimental unit: (PHE): measured by the distance between the soil level to the last fully expanded leaf, results in centimeters.
Ear insertion height (EHE): distance between ground level and the insertion node of the first viable ear, results in centimeters.
Associations of traits of importance in maize
This work was carried out in the agricultural harvest of 2016/2017 in Entre
located in the Northwest Region of Rio Grande do Sul, Brazil. This environment has an ltitude of 215 meters, Latitude 28º 21 '32 "S and Longitude 54º 16' 04" W. The climate is humid subtropical of the Cfa type according to the classification of Köppen and the annual precipitation is approximately 2000 mm. The soil is characterized as Typic
(Streck et al., 2008). During the experiment, the monthly maximum temperature and minimum of the air and rainfall, obtained by data from INMET (National Institute of
) and minimum temperatures (
Sowing was done in a previously fertilized area and soil acidity was corrected based on the soil analysis (Table 1). Spatial separation of genoty
pollination and varietal mixtures (Brasil, 2009).
Acidity (pH), phosphorus (P), potassium (K), sulfur (S), calcium (Ca), magnesium (Mg), aluminum (Al), cation exchange capacity (CEC), organic matter (OM) and clay o
cmol.
Ca Mg Al 6.1 2.7 0.0
The treatments were composed of six open-pollinated corn genotypes (PL 712, PL PL 861) commonly used by family farmers of Ametista do Sul
21' S and 53o
minimum germination of 95%, planted in a conventional sowing system, with a line spacing opulation density of 55,000 plants per hectare (Borghi and Crusciol,
16.20 m², with a spac
characters were measured in 10 random and homogeneous plants in the experimental unit: measured by the distance between the soil level to the last
distance between ground level and the insertion node of the first viable ear, results in centimeters.
©FUNPEC Associations of traits of importance in maize
This work was carried out in the agricultural harvest of 2016/2017 in Entre
located in the Northwest Region of Rio Grande do Sul, Brazil. This environment has an ltitude of 215 meters, Latitude 28º 21 '32 "S and Longitude 54º 16' 04" W. The climate is humid subtropical of the Cfa type according to the classification of Köppen and the annual precipitation is approximately 2000 mm. The soil is characterized as Typic
(Streck et al., 2008). During the experiment, the monthly maximum temperature and minimum of the air and rainfall, obtained by data from INMET (National Institute of
) and minimum temperatures (
Sowing was done in a previously fertilized area and soil acidity was corrected based on the soil analysis (Table 1). Spatial separation of genotypes was used to minimize cross
Acidity (pH), phosphorus (P), potassium (K), sulfur (S), calcium (Ca), magnesium (Mg), aluminum (Al), cation exchange capacity (CEC), organic matter (OM) and clay of soil in Entre
cmol.dm-3
CEC 12.0
pollinated corn genotypes (PL 712, PL PL 861) commonly used by family farmers of Ametista do Sul
10' 54" W. All genotypes minimum germination of 95%, planted in a conventional sowing system, with a line spacing
opulation density of 55,000 plants per hectare (Borghi and Crusciol, 16.20 m², with a spacing of 4.5 m. The following characters were measured in 10 random and homogeneous plants in the experimental unit:
measured by the distance between the soil level to the last
distance between ground level and the insertion node
©FUNPEC-RP www.funpecrp.com.br
This work was carried out in the agricultural harvest of 2016/2017 in Entre-Ijuís located in the Northwest Region of Rio Grande do Sul, Brazil. This environment has an
ltitude of 215 meters, Latitude 28º 21 '32 "S and Longitude 54º 16' 04" W. The climate is humid subtropical of the Cfa type according to the classification of Köppen and the annual precipitation is approximately 2000 mm. The soil is characterized as Typic Red Latosol (Streck et al., 2008). During the experiment, the monthly maximum temperature and minimum of the air and rainfall, obtained by data from INMET (National Institute of
), (a) and precipitation (b)
Sowing was done in a previously fertilized area and soil acidity was corrected based pes was used to minimize cross
Acidity (pH), phosphorus (P), potassium (K), sulfur (S), calcium (Ca), magnesium (Mg), f soil in Entre-Ijuís
%
OM Clay 2.6 68
pollinated corn genotypes (PL 712, PL PL 861) commonly used by family farmers of Ametista do Sul
W. All genotypes minimum germination of 95%, planted in a conventional sowing system, with a line spacing
opulation density of 55,000 plants per hectare (Borghi and Crusciol, ing of 4.5 m. The following characters were measured in 10 random and homogeneous plants in the experimental unit:
measured by the distance between the soil level to the last
distance between ground level and the insertion node
www.funpecrp.com.br 3
Ijuís - RS, located in the Northwest Region of Rio Grande do Sul, Brazil. This environment has an ltitude of 215 meters, Latitude 28º 21 '32 "S and Longitude 54º 16' 04" W. The climate is humid subtropical of the Cfa type according to the classification of Köppen and the annual Red Latosol (Streck et al., 2008). During the experiment, the monthly maximum temperature and minimum of the air and rainfall, obtained by data from INMET (National Institute of
), (a) and precipitation (b)
Sowing was done in a previously fertilized area and soil acidity was corrected based pes was used to minimize
cross-Acidity (pH), phosphorus (P), potassium (K), sulfur (S), calcium (Ca), magnesium (Mg), Ijuís - RS.
Clay 68
pollinated corn genotypes (PL 712, PL PL 861) commonly used by family farmers of Ametista do Sul - W. All genotypes gave a minimum germination of 95%, planted in a conventional sowing system, with a line spacing opulation density of 55,000 plants per hectare (Borghi and Crusciol, ing of 4.5 m. The following characters were measured in 10 random and homogeneous plants in the experimental unit:
measured by the distance between the soil level to the last
©FUNPEC-RP www.funpecrp.com.br Genetics and Molecular Research 18 (2): gmr18123
- Stem diameter (SDI): obtained with the aid of a digital caliper where the measurements were standardized, in the sense that the equipment is perpendicular to the sowing line, results in centimeters.
- Ear length (ELE): obtained through the extension between the basal and apical end of the ear, results in centimeters.
-Number of seed rows of the ear (NRE): obtained by counting the number of rows containing whole seeds per ear, results in units.
- Number of seeds per row of ear (NSR): measured by the magnitude of seeds arranged longitudinally in the row of the ear, results in units.
- Thousand seed weight (TSW): determined according to the Rules for Seed Analysis (Brasil, 2009), results in grams.
- Seed yield (YEI): obtained through the harvest and track of the useful area of each experimental unit, adjusted to 13% moisture and yield per hectare, in kg.ha-1.
- Germination test (GER): this was conducted through four samples containing four subsamples of 50 seeds. These were arranged to germinate in rolls formed by three sheets of Germitest® paper, moistened with distilled water 2.5 times the dry mass of the paper. Afterwards, the rolls were transferred to germination B.O.D. chamber type (Biochemical Oxygen Demand), with temperature and luminous period established by the legislation (Brasil, 2009). Results expressed as percentage of normal seedlings at seven days after the beginning of the tests.
- First germination count (FCG): this was performed four days after the beginning of the tests, results expressed as a percentage (Brasil, 2009).
- Emergence of seedlings in the field (EME):this was conducted through four sub-samples containing 50 seeds each, at 12 days after the implantation the measurement of emergence of seedlings for all genotypes was carried out, results expressed as a percentage.
- Cold test (CTE): this was carried out through four replicates with 50 seeds per treatment, these being seeded in a roll of paper moistened with distilled water equivalent to 2.5 times the mass of the dry substrate. The rolls were placed in a cold chamber at 10°C where they remained for seven days (Barros et al., 1999); after this period, they were arranged in a germinator at 25°C for 5 days where the percentage of normal seedlings was obtained.
Genetics and Molecular Research 18 (2): gmr18123 ©FUNPEC-RP www.funpecrp.com.br Associations of traits of importance in maize 5
which comprised: PHE, SDI, EHE, NRE, NSE, ELE, NSE, TSW and YEI. Subsequently, the phenotypic matrix was submitted to the multicollinearity diagnosis through the number of conditions (NC) of the matrix (Cruz et al., 2012). Then, the canonical correlation analysis was performed, where the significance between the groups of characters was obtained by the Likelihood Ratio Test (LRT) at 5% probability.
RESULTS AND DISCUSSION
The analysis of variance revealed a significant difference at 5% of probability by the F test for the attributes PHE, EHE, SDI, ELE, NRE, TSW, YEI, GER, FCG and CTE (Table 2).
Table 2. Summary of analysis of variance with mean squares and significance for agronomic and physiological characters of different corn genotypes.
D.F. Mean Square
PHE SDI EHE NRE NSR ELE NSE
Genotype 05 11231.64* 07.65* 3528.23* 29.98* 100.35* 13.35* 48161.98* Block 19 00017.85 00.33 0016.19 04.81 006.21 03.71 05360.72 Residue 95 00022.01 00.64 0014.33 02.69 004.59 05.17 03278.44 CV (%) – 00002.19 20.52 0003.62 11.20 007.37 14.13 00013.45
D.F. Mean Square D.F. Mean Square
TSW YEI GER FCG EME CTE
Genotype 05 05785.92* 05 3923627.50* 0.0046* 0.0043* 0.0067* 0.01* Block 07 00094.49 03 0018348.61 0.00007 0.0003 0.0004 0.0005 Residue 35 00074.75 15 0048211.94 0.0002 0.0003 0.0004 0.0003 CV (%) – 00003.60 CV (%) 0000003.51 1.86 2.11 2.66 2.27 * significant at 5% probability, Degrees of freedom (DF), coefficient of variation (CV%), germination (GER), first germination count (FCG), seedling emergence (EME), cold test (CTE), plant height (PHE), stem diameter (SDI), ear insertion height (EHE), number of seed rows (NRE), number of seeds per row (NSR), ear length (ELE), number of grains per ear (NSE) , thousand seed weight (TSW) and seed yield (YEI).
PHE is highly influenced genetically and by the effects of the environment (Souza et al., 2003), plant population (Brachtvogel et al., 2012), and soil nutrient availability (Repke et al., 2013). Among the genotypes characterized, the highest PHE was obtained for PL 712 with 246.76 cm (Table 3), the EHE was 120.3 cm for the same genotype (Table 3). However, these variables obtained a minimum magnitude for PL 804 with 184.46 cm (PHE) and 90.95cm (EHE). The PHE is an important characteristic for this cereal, mainly for the best balance of the plant (Kappes et al., 2013), being this attribute dependent of the plant population (Kappes et al., 2013), characteristics and genotype response to nutrient factors mainly from nitrogen (Santos et al., 2010) and potassium (Rodrigues et al., 2014).
©FUNPEC-RP www.funpecrp.com.br Genetics and Molecular Research 18 (2): gmr18123
Table 3. Means for plant height (PHE), stem diameter (SDI), ear insertion height (EHE), number of rows per ear (NRE), number of seeds per row (NSR), ear length (ELE) and number of seeds per ear (NSE), thousand seed weight (TSW), yield (YEI), germination (GER), first germination count (FCG), seedling emergence (EME) and cold test (CTE) of different corn genotypes.
Genotypes PHE SDI EHE NRE NSR ELE NSE TSW YEI GER FCG EME CTE
PL 712 243.9a 04.9a 120.3a 16.5a 27.1d 17.4a 448.6b 287.85a 7250a 94a 90a 92a 81ab
PL 725 200.2c 03.7bc 094.0c 13.8c 27.7cd 15.8b 380.9c 242.6bc 6250abc 76bc 89a 85ab 76bc
PL 823 240.3a 03.4c 112.6b 15.8ab 32.4a 17.4a 513.0a 271.5ab 7120ab 82a 90a 85ab 82a
PL 796 196.4c 04.2b 093.5c 13.7c 29.4bc 15.4b 402.4bc 226.6bc 5250cd 76bc 85ab 85ab 76bc
PL 804 187.4d 03.3c 090.9c 13.6c 30.8ab 15.8b 418.7bc 226.3cd 5210d 72c 80b 79b 72c
PL 861 219.7b 03.6bc 116.8a 14.5bc 26.8d 15.2b 389.7c 205.2d 6210bcd 81ab 88ab 79b 81ab
CV (%) 002.1 19.8 003.6 11.5 07.5 10.1 013.7 002.84 0003.51 02.27 2.11 2.66 2.27
Means followed by the same lowercase letter in the column do not differ significantly from each other at 5% probability. CV: CV = Coefficient of variation
The TSW and YEI presented differentials for the genotypes tested, with coefficients of variation of 3.84 and 3.51%, respectively. The thousand seed weight is considered of great importance for seed productivity (Veloso et al., 2006), but it is dependent on nutrition (Castoldi et al., 2011), genetic characteristics and crop harvest (Schiavinatti et al., 2011). Physiologically this attribute is related to the magnitude of assimilates allocated in the seed during its development; a favorable growing environment without limitations can result in an increase of seed mass (Peske et al., 2012).
The genotype PL 712 was superior for the thousand seed weight; in contrast, the PL 861 genotype was 30% inferior to the best genotype studied. TheYEI determined that genotype PL 712 was higher at 7250 kg.ha-1. Studies by Mittelmann et al. (2005) demonstrated that this response to seed yield in maize genotypes with open pollination is due to the great genetic variability between genotypes and plants of the same genotype, environmental effects, agricultural harvest and interaction between these factors.
The GER showed that genotype PL 712 was superior with 94% of germination (Table 3). It was also observed that all the genotypes tested were superior to the desirable 85% germination standards (Rocha et al., 2009). The FCG determined that genotypes PL 712, PL 823 and PL 725 expressed vigor greater than 89%. The germination test contemplates seedling establishment estimates under optimum conditions, vigor tests are essential to determine the performance of seed lots on adverse environmental conditions (Bhering et al., 2003). According to Munizzi et al., (2010), seeds of higher physiological quality have high speed metabolic processes, rapid germination and seedling uniformity. Both the growing environment and the genotype used have important contribution to seed quality (Prazeres, 2014).
The EME in the field is influenced by seed vigor, and this attribute can be affected according to Silva et al., (2012), the quality of the corn seeds used, the environmental conditions of the production field, conditions of harvesting, drying, processing and storage. The genotype PL 712 presented greater field emergence with 92% vigor. These effects are attributed to the sum of the genetic, physical, physiological and sanitary attributes linked to the seeds used (Marcos Filho, 2005).
Ge
measurements, the Singh Method (1981) was used, which is based on the premise of identifying which characters most contribute to the differentiation of genotypes. This included EHE (10.12%), CTE (9.41%), NRE (8.81%), PHE (8.75%) and TSW (8.59%) as the most important and of high variability attributes, since they represented 45% of the total genetic variation among the genotypes. Minimum effects were obtained through EME (5.3%) and G
genotypes (Figure 2) studied.
Figure 2.
(EHE), number of rows per ear (NRE), number of seeds per row (NSR), ear length (ELE) and numb
per ear (NSE), thousand seed weight (TSW), yield (YEI), germination (GER), first germination count (FCG), seedling emergence (EME) and cold test CTE) for the dissimilarity among six corn genotypes, performed by the Singh (1981)
phenotypic information measured in genotype tested (Cruz et al., 2012). It is used as the basis for the genetic dissimilarity dendrogram, where PL725 and PL796 genotypes
3) studied.
to organize them into groups (Figure 4). In this way, genotypes PL 796, PL 725
formed Group 1 (Figure 4), however, the genotypes PL 804, PL 823 and PL 712 showed greater dissimilarity for the characteristics, culminating in the isolated allocation and their representation in Group 2, 3 and 4, respectively. In this sense, m
promising and useful for grouping genotypes that express contrasting phenotypes, facilitates the interpretation of a wide range of data, optimizes trends and responses, and facilitates scientific decisions.
Genetics and Molecular Research 18
In order to distinguish genetically the genotypes according to phenotypic measurements, the Singh Method (1981) was used, which is based on the premise of identifying which characters most contribute to the differentiation of genotypes. This included EHE (10.12%), CTE (9.41%), NRE (8.81%), PHE (8.75%) and TSW (8.59%) as the most important and of high variability attributes, since they represented 45% of the total genetic variation among the genotypes. Minimum effects were obtained through EME (5.3%) and G
genotypes (Figure 2) studied.
Figure 2. Relative contribution of the characters plant height (PHE), stem diameter (SDI), ear insertion height (EHE), number of rows per ear (NRE), number of seeds per row (NSR), ear length (ELE) and numb
per ear (NSE), thousand seed weight (TSW), yield (YEI), germination (GER), first germination count (FCG), seedling emergence (EME) and cold test CTE) for the dissimilarity among six corn genotypes, performed by the Singh (1981) method.
The gen
phenotypic information measured in genotype tested (Cruz et al., 2012). It is used as the basis for the genetic dissimilarity dendrogram, where PL725 and PL796 genotypes
were similar and PL804 genotype contrasted with the others for the characteristics studied.
The use of multivariate methods made it possible to differentiate the genotypes and to organize them into groups (Figure 4). In this way, genotypes PL 796, PL 725
formed Group 1 (Figure 4), however, the genotypes PL 804, PL 823 and PL 712 showed greater dissimilarity for the characteristics, culminating in the isolated allocation and their representation in Group 2, 3 and 4, respectively. In this sense, m
promising and useful for grouping genotypes that express contrasting phenotypes, facilitates the interpretation of a wide range of data, optimizes trends and responses, and facilitates scientific decisions.
olecular Research 18
Associations of traits of importance in maize
In order to distinguish genetically the genotypes according to phenotypic measurements, the Singh Method (1981) was used, which is based on the premise of identifying which characters most contribute to the differentiation of genotypes. This included EHE (10.12%), CTE (9.41%), NRE (8.81%), PHE (8.75%) and TSW (8.59%) as the most important and of high variability attributes, since they represented 45% of the total genetic variation among the genotypes. Minimum effects were obtained through EME (5.3%) and G
genotypes (Figure 2) studied.
Relative contribution of the characters plant height (PHE), stem diameter (SDI), ear insertion height (EHE), number of rows per ear (NRE), number of seeds per row (NSR), ear length (ELE) and numb
per ear (NSE), thousand seed weight (TSW), yield (YEI), germination (GER), first germination count (FCG), seedling emergence (EME) and cold test CTE) for the dissimilarity among six corn genotypes, performed by the
ethod.
The genetic distance obtained by the Mahalanobis algorithm is obtained through the phenotypic information measured in genotype tested (Cruz et al., 2012). It is used as the basis for the genetic dissimilarity dendrogram, where PL725 and PL796 genotypes
were similar and PL804 genotype contrasted with the others for the characteristics
The use of multivariate methods made it possible to differentiate the genotypes and to organize them into groups (Figure 4). In this way, genotypes PL 796, PL 725
formed Group 1 (Figure 4), however, the genotypes PL 804, PL 823 and PL 712 showed greater dissimilarity for the characteristics, culminating in the isolated allocation and their representation in Group 2, 3 and 4, respectively. In this sense, m
promising and useful for grouping genotypes that express contrasting phenotypes, facilitates the interpretation of a wide range of data, optimizes trends and responses, and facilitates scientific decisions.
olecular Research 18 (2): gmr18123
Associations of traits of importance in maize
In order to distinguish genetically the genotypes according to phenotypic measurements, the Singh Method (1981) was used, which is based on the premise of identifying which characters most contribute to the differentiation of genotypes. This included EHE (10.12%), CTE (9.41%), NRE (8.81%), PHE (8.75%) and TSW (8.59%) as the most important and of high variability attributes, since they represented 45% of the total genetic variation among the genotypes. Minimum effects were obtained through EME (5.3%) and G
Relative contribution of the characters plant height (PHE), stem diameter (SDI), ear insertion height (EHE), number of rows per ear (NRE), number of seeds per row (NSR), ear length (ELE) and numb
per ear (NSE), thousand seed weight (TSW), yield (YEI), germination (GER), first germination count (FCG), seedling emergence (EME) and cold test CTE) for the dissimilarity among six corn genotypes, performed by the
etic distance obtained by the Mahalanobis algorithm is obtained through the phenotypic information measured in genotype tested (Cruz et al., 2012). It is used as the basis for the genetic dissimilarity dendrogram, where PL725 and PL796 genotypes
were similar and PL804 genotype contrasted with the others for the characteristics
The use of multivariate methods made it possible to differentiate the genotypes and to organize them into groups (Figure 4). In this way, genotypes PL 796, PL 725
formed Group 1 (Figure 4), however, the genotypes PL 804, PL 823 and PL 712 showed greater dissimilarity for the characteristics, culminating in the isolated allocation and their representation in Group 2, 3 and 4, respectively. In this sense, m
promising and useful for grouping genotypes that express contrasting phenotypes, facilitates the interpretation of a wide range of data, optimizes trends and responses, and facilitates
©FUNPEC Associations of traits of importance in maize
In order to distinguish genetically the genotypes according to phenotypic measurements, the Singh Method (1981) was used, which is based on the premise of identifying which characters most contribute to the differentiation of genotypes. This included EHE (10.12%), CTE (9.41%), NRE (8.81%), PHE (8.75%) and TSW (8.59%) as the most important and of high variability attributes, since they represented 45% of the total genetic variation among the genotypes. Minimum effects were obtained through EME (5.3%) and G
Relative contribution of the characters plant height (PHE), stem diameter (SDI), ear insertion height (EHE), number of rows per ear (NRE), number of seeds per row (NSR), ear length (ELE) and numb
per ear (NSE), thousand seed weight (TSW), yield (YEI), germination (GER), first germination count (FCG), seedling emergence (EME) and cold test CTE) for the dissimilarity among six corn genotypes, performed by the
etic distance obtained by the Mahalanobis algorithm is obtained through the phenotypic information measured in genotype tested (Cruz et al., 2012). It is used as the basis for the genetic dissimilarity dendrogram, where PL725 and PL796 genotypes
were similar and PL804 genotype contrasted with the others for the characteristics
The use of multivariate methods made it possible to differentiate the genotypes and to organize them into groups (Figure 4). In this way, genotypes PL 796, PL 725
formed Group 1 (Figure 4), however, the genotypes PL 804, PL 823 and PL 712 showed greater dissimilarity for the characteristics, culminating in the isolated allocation and their representation in Group 2, 3 and 4, respectively. In this sense, multivariate methods are promising and useful for grouping genotypes that express contrasting phenotypes, facilitates the interpretation of a wide range of data, optimizes trends and responses, and facilitates
©FUNPEC-RP www.funpecrp.com.br
In order to distinguish genetically the genotypes according to phenotypic measurements, the Singh Method (1981) was used, which is based on the premise of identifying which characters most contribute to the differentiation of genotypes. This included EHE (10.12%), CTE (9.41%), NRE (8.81%), PHE (8.75%) and TSW (8.59%) as the most important and of high variability attributes, since they represented 45% of the total genetic variation among the genotypes. Minimum effects were obtained through EME (5.3%) and GER (6.04) of the
Relative contribution of the characters plant height (PHE), stem diameter (SDI), ear insertion height (EHE), number of rows per ear (NRE), number of seeds per row (NSR), ear length (ELE) and number of seeds per ear (NSE), thousand seed weight (TSW), yield (YEI), germination (GER), first germination count (FCG), seedling emergence (EME) and cold test CTE) for the dissimilarity among six corn genotypes, performed by the
etic distance obtained by the Mahalanobis algorithm is obtained through the phenotypic information measured in genotype tested (Cruz et al., 2012). It is used as the basis for the genetic dissimilarity dendrogram, where PL725 and PL796 genotypes
were similar and PL804 genotype contrasted with the others for the characteristics
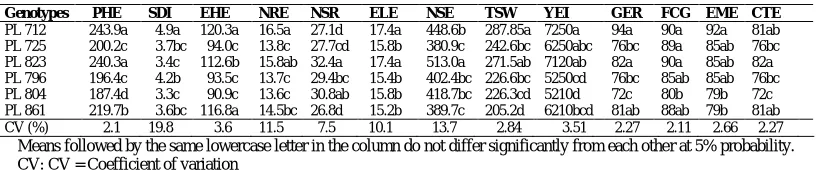
The use of multivariate methods made it possible to differentiate the genotypes and to organize them into groups (Figure 4). In this way, genotypes PL 796, PL 725 and PL 861 formed Group 1 (Figure 4), however, the genotypes PL 804, PL 823 and PL 712 showed greater dissimilarity for the characteristics, culminating in the isolated allocation and their ultivariate methods are promising and useful for grouping genotypes that express contrasting phenotypes, facilitates the interpretation of a wide range of data, optimizes trends and responses, and facilitates
www.funpecrp.com.br 7
In order to distinguish genetically the genotypes according to phenotypic measurements, the Singh Method (1981) was used, which is based on the premise of identifying which characters most contribute to the differentiation of genotypes. This included EHE (10.12%), CTE (9.41%), NRE (8.81%), PHE (8.75%) and TSW (8.59%) as the most important and of high variability attributes, since they represented 45% of the total genetic variation among ER (6.04) of the
Relative contribution of the characters plant height (PHE), stem diameter (SDI), ear insertion height er of seeds per ear (NSE), thousand seed weight (TSW), yield (YEI), germination (GER), first germination count (FCG), seedling emergence (EME) and cold test CTE) for the dissimilarity among six corn genotypes, performed by the
etic distance obtained by the Mahalanobis algorithm is obtained through the phenotypic information measured in genotype tested (Cruz et al., 2012). It is used as the basis for the genetic dissimilarity dendrogram, where PL725 and PL796 genotypes (Figure were similar and PL804 genotype contrasted with the others for the characteristics
©FUNPEC-RP www.funpecrp.com.br Genetics and Molecular Research 18 (2): gmr18123
Figure 3. Dendrogram of genetic dissimilarity of six corn genotypes (PL 712, PL 725, PL 796, PL 804 and PL 861) using the Mahalanobis distance and UPGMA grouping method, obtained through the characters plant height (PHE), stem diameter (SDI), ear insertion height (EHE), number of rows per ear (NRE), number of seeds per row (NSR), ear length (ELE) and number of seeds per ear (NSE), thousand seed weight (TSW), yield (YEI), germination (GER), first germination count (FCG), seedling emergence (EME) and cold test (CTE).
Genetics and Molecular Research 18 (2): gmr18123 ©FUNPEC-RP www.funpecrp.com.br Associations of traits of importance in maize 9
Estimates of the linear correlations were obtained for the PHE, SDI, EHE, NRE, NSR, ELE, NSE, TSW, YIE, GER, FGC, EME and CTE characters measured in five maize genotypes. There were 78 linear associations, where 57 associations were significant by the t test at 5% probability (Table 4). The positive and significant coefficients were obtained for PHE with SDI, EHE, ELE, NSE, TSW, YIE, GER, FCG, EME and CTE.
Table 4. Linear correlations between plant morphological characters and seed physiology analyzed in six corn genotypes (Zea mays). All correlations were significant at 5% probability by the t test. Sample N =120.
PHE
SDI -0.25
EHE
NRE -0.46
NRE
ELE 0.35
ELE
NSE 0.42
EHE -0.90 NSR -0.23 NSE 0.79 YIE 0.64
ELE -0.24 NSE -0.25 TSW 0.42 GER 0.60
NSE -0.40 TSW -0.32 YIE 0.80 FGC 0.58
TSW -0.62 YIE -0.81 GER 0.65 EME 0.64
YIE -0.92 GER -0.66 FGC 0.62 CTE 0.59
GER -0.77 FGC -0.64 EME 0.66
NGR ELE 0.25
FGC -0.75 EME -0.52 CTE 0.72 NSE 0.57
EME -0.66 CTE -0.87
YIE
GER 0.86
GER
FGC 0.92
CTE -0.88 FGC 0.87 EME 0.77
SDI
EHE -0.23
TSW
YIE -0.74 EME 0.74 CTE 0.63
NSR -0.30 GER -0.56 CTE 0.77
FGC EME 0.60
TSW -0.31 FGC -0.54 CTE 0.64
GER -0.46 EME -0.71
NSE TSW 0.43
EME -0.51 CTE -0.46 YIE 0.52 EME CTE 0.51
Germination (GER), first germination count (FCG), seedling emergence (EME), cold test (CTE), plant height (PHE), stem diameter (SDI), ear insertion height (EHE), number of seed rows (NRE), number of seeds per row (NSR), ear length (ELE), number of grains per ear (NSE), thousand seed weight (TSW) and seed yield (YEI).
These linear associations have demonstrated that plants with larger stature increase the components of seed yield, such as the number of seeds per ear and the thousand seed weight. The attributes of the physiological quality of the seeds produced are positively affected by larger plants. The plant height can modify the arrangement of the ears and the equilibrium point of these in the plant, the dimensions and the mass of the ear are modified, making it beneficial to the seed yield.
The variable number of NRE correlated positively with NSE (r = 0.79), YEI (r = 0.80) and CTE (r = 0.79). For genotypes with more rows of seeds in the ear may result in an increase in the magnitude of seeds per ear and yield, in addition, the thousand seed weight contributes to the physiological quality through the CTE. The physiological seed quality variables showed a significant correlation of the EME with GER, FCG and CTE, and it was possible to pre-establish the performance of the EME.
©FUNPEC-RP www.funpecrp.com.br Genetics and Molecular Research 18 (2): gmr18123
The genotypes of corn with plants of higher stature can show superior competitive ability, this allows to intercept more efficiently the photosynthetically active energy. Because these plants have high leaf area, they supply the need of assimilates and are more efficient in the formation of seeds of higher physiological quality (De Souza et al., 2015).
Table 5. Canonical loads for the characters of physiological quality (physiological group) and morphological/yield characters (morphological/yield group) in the canonical correlations (r) between groups for the six corn genotypes.
Character Canonical pair
Physiological group
GER1 -0.87
FGC -0.85
EME -0.74
CTE -0.86
Morphological/Yield Group
PHE2 -0.91
SDI -0.36
EHE -0.83
NRE -0.78
NSR -0.18
ELE -0.69
NSE -0.50
TSW -0.63
YEI -0.92
r -0.97
(LRT) P -0.0001
P: probability (Likelihood Ratio Test), r: Canonical correlation interclass, 1 (physiological group) germination (GER), first germination count (FCG), seedling emergence (EME) and cold test (CTE). 2 (Morphological group) plant height (PHE), stem diameter (SDI), ear insertion height (EHE), number of seed rows (NRE), number of seeds per row (NSR), ear length (ELE), number of grains per ear (NSE), thousand seed weight (TSW) and seed yield (YEI).
In view of the results, it was possible to identify the most productive genotypes, such as PL 712, PL 823 and PL 725, which also showed superiority to the physiological quality of the seeds produced. In this context, it was identified that the EHE, CTE, NRE, PHE and TGW characters presented greater genetic variability. The phenotypic linear associations between the genotypes were pronounceable among the characters of interest, and the canonical interrelations established for the physiological characters of the seeds and morphological / yield could help the future strategies of selection of corn genotypes, with the aim of greater productivity and physiological quality of the seeds produced.
CONCLUSIONS
Genetics and Molecular Research 18 (2): gmr18123 ©FUNPEC-RP www.funpecrp.com.br Associations of traits of importance in maize 11
advocate the selection and development of superior genotypes for the productivity and quality of the seeds produced in the extreme south of Brazil.
REFERENCES
Albrecht LP, Braccini AL, Ávila MR, Scapim CA, et al. (2009). Sementes de soja produzidas em época de safrinha na região oeste do estado do Paraná. Acta. Sci. Agron. 31: 121-127.
Albuquerque AW, Santos JR, Filho G and Reis LS (2013). Plantas de cobertura e adubação nitrogenada na produção de milho em sistema de plantio direto. Rer. Bras. Eng. Agr. Ambient. 17: 721-726.
Araújo PM and Nass LL (2002). Caracterização e avaliação de populações de milho crioulo. Sci. Ag. 59: 589-593. Barros ASR, Dias MCLL, Cicero SM and Krzyzanowski FC (1999). Testes de frio. In: Vigor de sementes: conceitos e
testes (Krzyzanowski FC, Vieira RD, França Neto JB, eds.). Abrates, Londrina.
Bergamaschi H and Matzenauer R (2009). Agrometeorologia do milho. In: Agrometeorologia dos cultivos: fator meteorológico na produção agrícola (Monteiro JE, ed.). INMET, Brasília.
Bhering MC, Dias DCFS, Barros DI, Dias LAS, et al. (2003). Avaliação do vigor de sementes de melancia (Citrullus lunatus Schrad.) pelo teste de envelhecimento acelerado. Rev. Bras. Sementes. 125: 1-6.
Borghi E and Crusciol CAC (2007). Produtividade de milho, espaçamento e modalidade de consorciação com
Brachiaria brizantha no SPD. Pesq. Agropec. Bras. 42: 163-171.
Brachtvogel ELB, Pereira FRS, Cruz SCS, Abreu MLA, et al. (2012). População, arranjo de plantas uniforme e a competição intraespecífica em milho. R. Trop. Ci. Agr. Biol. 6: 75-83.
Brasil (2009). Ministério da Agricultura, Pecuária e Abastecimento. Guia de inspeção de campos para produção de sementes. 3 ed. Mapa/ACS, Brasília.
Carmo MS Do, Cruz SCS, Souza EJ de, Campos LFC, et al. (2012). Doses e fontes de nitrogênio no desenvolvimento e produtividade da cultura de milho doce (Zea mays convar. saccharata var. rugosa). Biosci. J. 28: 223-231. Carvalho IR, Souza VQ, Nardino M, Follmann DN, et al. (2015). Canonical correlations between morphological traits
and yield components in dual-purpose wheat. Pesq. Agropec. Bras. 12: 690-697.
Castoldi G, Costa SSM, Costa LM, Pivetta LA, et al. (2011). Sistemas de cultivo e uso de diferentes adubos na produção de silagem e grãos de milho. Acta. Sci. Agron. 33: 139-146.
Conab - Companhia Nacional de Abastecimento (2017). Acompanhamento da safra brasileira de grãos. Conab, Brasília. Cruz CD, Regazzi AJ and Carneiro PCS (2012). Modelos biométricos aplicados ao melhoramento genético. 4 ed. Editora
UFV, Viçosa.
De Souza VQ, Carvalho IR, Follmann DN, Nardino M, et al. (2015). Desfolhamento artificial e seus efeitos nos caracteres morfológicos e produtivos em híbridos de milho. Rev. Bras. Milho. Sorgo. 14: 61-74.
Ferreira Junior RA, Souza JL De, Teodoro I, Lyra GB, et al. (2014). Eficiência do uso da radiação em cultivos de milho em Alagoas. Rev. Bras. Eng. Agr. Ambient. 18: 322-328.
Kappes C, Arf O and Andrade JAC (2013). Produtividade do milho em condições de diferentes manejos do solo e de doses de nitrogênio. Rev. Bras. Cien. Solo. 37: 1310-1321.
Magalhães PC and Durães FOM (2006). Fisiologia da produção de milho. 1 ed. EMBRAPA-CNPMS, Sete Lagoas. Marchi SL (2008). Interação entre desfolha e população de plantas na cultura do milho na Região Oeste do Paraná.
Dissertação de Mestrado. Universidade Estadual do Oeste do Paraná, Marechal Cândido Rondon. Marcos Filho J (2005). Fisiologia de sementes de plantas cultivadas. FEALQ, Piracicaba.
Mittelmann A, Sobrinho FS, Oliveira JS and Fernandes SBV (2005). Avaliação de híbridos comerciais de milho para utilização como silagem na região sul do Brasil. Cienc. Rural. 35: 684-690.
Morris M, Mekuria M and Gerpacio R (2003). Impacts of CIMMYT maize breeding research. In: Crop variety improvement and its effect on productivity: The impact of international agricultural research (Evenson RE, Gullin D, eds.). Cabi publishing: United Kingdom.
Munizzi A, Braccini AL, Rangel MAS, Scapim CA, et al. (2010). Qualidade de sementes de quatro cultivares de soja, colhidas em dois locais no estado de Mato Grosso do Sul. Rev. Bras. Sementes. 32: 176-185.
Neto DD, Palhares M, Vieira PA, Monfron PA, et al. (2003). Efeito da população de plantas e do espaçamento sobre a produtividade de milho. Rev. Bras. Milho. Sorgo. 2: 63-77.
Peske ST, Villela FA and Meneghello GE (2012). Sementes: Fundamentos Científicos e Tecnológicos. 3 ed. Editora Universitária/UFPel, Pelotas.
Pipolo VC, Souza A, Silva DD, Barrero TP, et al. (2010). Avaliação de cultivares de milho crioulo em sistema de baixo nível tecnológico. Acta Sci. Agron. 32: 229-233.
Prazeres CS (2014). Ganho genético para qualidade fisiológica em sementes de milho híbrido. Dissertação de Mestrado. Universidade do Estado de Santa Catarina, Lages.
©FUNPEC-RP www.funpecrp.com.br Genetics and Molecular Research 18 (2): gmr18123
Ritchie SW, Hanway JJ and Benson GO (1993). How a corn plant develops. Iowa State University of Science and Technology, Ames.
Rocha GP, Silva NC, Dourado ER, Teixeira MS, et al. (2009). Qualidade fisiológica de sementes de milho (Zea mays) e Sorgo (Sorghum bicolor) crioulos produzidas nos campos de sementes de agricultores (as) familiares de Porteirinha, Norte de Minas Gerais. Rev. Bras. Agroeco. 4: 4497-4500.
Rodrigues MAC, Buzetti S, Filho MCMT, Garcia CMP, et al. (2014). Adubação com KCl revestido na cultura do milho no Cerrado. Rev. Bras. Eng. Agri. Amb. 18: 127-133.
Sangoi L, Ernani PR, Silva PRF Da, Horn D, et al. (2006). Desempenho agronômico de cultivares de milho em quatro sistemas de manejo. Rev. Bras. Milho. Sorgo. 5: 218-231.
Santos PA, Silva AF, Carvalho MAC and Caione G (2010). Adubos verdes e adubação nitrogenada em cobertura no cultivo do milho. Rev. Bras. Milho. Sorgo. 9: 123-134.
Schiavinatti AF, Andreotti M, Benett CGS, Pariz CM, et al. (2011). Influência de fontes e modos de aplicação de nitrogênio nos componentes da produção e produtividade do milho irrigado no cerrado. Bragantia. 70: 925-930. Silva AL da, Silva JF da, Almeida F de AC, Gomes JP, et al. (2012). Qualidade fisiológica e controle de sementes de
milho tratadas com Piper nigrum. Rev. Bras. Prod. Agroind. 14: 131-142.
Singh D (1981). The relative importance of characters affecting genetic divergence. Indian. J. Genet. Pl. Br. 41: 237-245.
Souza AB, Andrade MJB and Muniz JA (2003). Altura de planta e componentes de rendimento do feijoeiro em função da população de plantas, adubação e calagem. Cienc. Agrotec. 27: 1205-1213.
Streck EV, Kämpf N, Dalmolin RSD, Klamt E, et al. (2008). Solos do Rio Grande do Sul. 2 ed. EMATER/RS, Porto Alegre.
Szareski VJ, Carvalho IR, Kelh K, Pelegrin AJ, et al. (2018). Interrelations of characters and multivariate analysis in corn. J. Agric. Sci. 10: 187-194.
Valderrama M, Buzetti S, Benett CGS and Filho MCMT (2011). Fontes e doses de NPK em milho irrigado sob plantio direto. Pesq. Agropec. Trop. 41: 254-263.