www.technology.matthey.com
Recent Developments in the Structural
Characterisation of Disordered,
Mesoporous Solids
Novel hybrid methods provide greatly increased information on this important
class of solids
Sean P. Rigby
Department of Chemical and Environmental Engineering, University of Nottingham, University Park, Nottingham, NG7 2RD, UK
Email: [email protected]
The accurate and precise characterisation of disordered, mesoporous solids continues to be an ongoing challenge due to the high level of complexity of such materials. Common, indirect methods, such as gas sorption and mercury porosimetry, still offer relatively cheap, and, most importantly, statistically representative characterisations of macroscopic samples. This work reviews and expands upon recent developments aimed at increasing, and cross-validating, the information obtained from such methods. This involves developing a better understanding of the pore-pore co operative effects that emerge only in extensive, disordered pore networks to better interpret raw characterisation data, and to use these effects to deliver more information on the void space. This work also describes novel hybrid methods that also greatly increase the information that indirect methods can deliver on complex mesoporous solids.
1. Introduction
Many materials of industrial interest are both mesoporous and disordered over many length scales. These materials include heterogeneous catalysts and adsorbents, absorbents, gas and
oil reservoir rocks (such as shales), controlled drug release devices and tissue engineering scaffolds. Such materials present a challenge for characterisation because the pore sizes are of the order of nanometres, while the particle sizes are of the order of millimetres to metres, and the correlation length, above which the statistical descriptors of the pore structure become constant, can take any value in this range, or there may even not be one.
This typical level of complexity means that, even though various different microscopy methods have been developed to directly examine the void space at nanoscale, these methods are still impractical for obtaining statistically representative descriptors for macroscopically sized samples, such as even just single catalyst pellets or rock fragments. This is because obtaining nanometre scale resolution in tomographic and microscopic methods (for example electron tomography (1), or dual-beam microscopy (2)) means the sample size typically has to be of the order of micrometres in size or even less. Microscopic and tomographic methods also tend to be slow and expensive. There is thus still a need for characterisation methods that deliver descriptors of nanoscale structure that are statistically representative for macroscopic samples.
arising just for disordered materials. These effects
are specific to disordered materials because they
are linked to the structural heterogeneity. Hence, studies of these physical processes on more ordered materials, such as templated (3) or nano-cast (4) porous media, where independent validation is
possible, is often not sufficient to properly interpret
data for disordered pellets. These idiosyncratic effects include advanced adsorption and network-based delayed condensation in gas sorption, mercury snap-off and entrapment in porosimetry, and advanced melting in thermoporometry.
While complicating the interpretation of these characterisation data types for disordered materials, these effects also offer the potential to extract more information on void spaces than has been typical in the past. Further, the often idiosyncratic physical origins of these effects particular to one technique means that a combination of methods offers the potential for independent validation of data from indirect methods.
While comparisons of statistical descriptors, such as voidage fractions or pore size probability density functions (distributions), from different indirect methods is common practice in the literature, the full integration of data sets via truly hybrid methods is rare. More recently, truly hybrid methods such as integrated gas sorption and mercury porosimetry (5), or combined mercury porosimetry and thermoporometry (6), have been developed. These hybrid methods typically consist of a series of different experiment types conducted on the same sample. For example, gas sorption may be conducted on a sample following porosimetry, once the entrapped mercury has been frozen in situ, or the entrapped mercury can form
the probe fluid for a subsequent thermoporometry
experiment. Hybrid methods present a much tougher test of the consistency of interpretation of data from the component indirect methods than simple comparisons of separate data sets. The combined hybrid data sets can also be used to obtain additional unusual pore space descriptors, such as pore length (7).
It is the purpose of this work to describe the physical principles underlying the common indirect characterisation methods, and discuss the key issues this raises concerning interpretation for disordered solids, and how they may be dealt with. It will then describe recently developed hybrid experimental protocols and their analysis. This work will argue that, rather than causing yet more problems for data interpretation, when properly understood, the idiosyncratic physical effects
discovered in application of indirect techniques to disordered pore networks present an opportunity to derive additional information from them.
2. Basic Characterisation Methods
and their Idiosyncratic Effects in
Disordered Porous Solids
2.1 Gas Sorption
Gas sorption pore size characterisation is based upon the capillary condensation process, whereby the critical pressure for the phase transition between
vapour and liquid is lowered by confinement. The
condensation pressure, P, for within a void space of radius rp is generally given by the Kelvin equation, Equation (i) (8):
P kγVmcosθ (i)
ln(—) = –
P0 RT(rp)
where Po is the saturated vapour pressure at which condensation occurs for the bulk, k is a geometry parameter and depends on the pore type (for a cylindrical pore open at both ends k = 1; and for a cylindrical pore with one dead-end and a hemispherical meniscus, k = 2), γ is the surface tension and Vm is the molar volume of the condensed liquid phase, θ is the contact angle
with which the liquid meets the wall, and T is the absolute temperature.
It is generally assumed, for nitrogen, that the adsorbed condensate is perfectly wetting the surface such that the contact angle is zero, and
thus the cosθ term is unity (8). Hence, from Equation (i), a key first assumption is thus pore
shape/geometry. However, knowledge of the material synthesis process, or microscopy, can often provide the relevant information. Further, molecular simulations suggest that as the length of open pores increases the increased pore potential from growing interactions with the greater amount of solid means that long open pores behave like dead-end pores (9). This suggests that for macroscopic samples the assumption of dead-end pores is appropriate. However, it is also noted that, as will be described below, nitrogen condensation in some pores of macroscopic catalyst support pellets shifts to lower pressures when they are turned into dead-end pores, suggesting they were not behaving that way beforehand (10).
Further, before a pore completely fills via capillary
condensation, a multi-layer film builds up on the
dimension. This must be taken account of when calculating pore sizes since the core void dimension controls condensation pressure.
The film, or t-layer, thickness is generally obtained from a universal t-curve, such as that of Halsey, or Harkins-Jura (8). t-Curves are generally obtained for adsorption on non-porous materials
with relatively flat surfaces, while under the severe confinement within mesoporous solids the walls
have severe curvature. The impact of this surface
curvature on film thickness at a given pressure
was addressed in the analysis of Broeckhoff and de Boer (11). Kruk et al. (12) showed that the Kelvin equation for a hemispherical meniscus geometry,
along with a correction for the statistical film
thickness, gives quite good agreement with the actual pore size of MCM-type silicas from nitrogen adsorption. The agreement was made even better in the pore size range from ca. 2 nm to 6.5 nm, if an additional correctional constant was added to the Kelvin equation.
A common feature of gas sorption data for mesoporous solids is the presence of hysteresis, whereby the pressure required for the main desorption step is generally lower than the pressure at which condensation originally occurred (8). The cause of the hysteresis has been a long running subject of study, with the promise of extracting additional information on pore systems (8). Even just for simple single pore systems a variety of mechanisms have been proposed.
From Equation (i), the condensation and evaporation pressures for the same adsorbate in the same pore, or the condensation pressures for the same adsorbate in open/closed pores of the same diameter, or identical pores with different wetting properties, can be related via the ratio, Equation (ii) (13):
k1 cosθ1 P
P 1 P (ii)
— — = — ln —
ln P δ
0 1 = k2 cosθ2
ln
P0 2 P0 2
where the subscripts 1 and 2 refer to either condensation and evaporation, respectively, or two different pores of the same radius. Cohan proposed that in an open cylindrical pore, with a fully wetting surface, condensation occurred via a cylindrical sleeve meniscus (where k1 = 1), while desorption occurred via a hemispherical meniscus (where k2 = 2), and the cosθ terms both equal unity (14). Hence, in that case, the relative pressure for evaporation is the square of the relative pressure for condensation, and δ = 2. For a wetting equilibrium sorption system, with no hysteresis,
the power would be unity. For less wetting surfaces
(where the cosθ term can vary) the power would
be less than two. Further, the condensation and evaporation pressures obtained by the analysis by Broeckhoff and de Boer (11) are such that δ = 1.5 (13).
While, prior to full condensation, in large (macro-) pores, the model of adsorbate spatial distribution
consisting of a distinct liquid-like film on the walls and a vapour-like core is generally sufficient,
when the pore becomes small enough such that the opposite wall potentials begin to overlap
significantly this becomes unrealistic. This overlap occurs in the mesopore range, becoming significant
for pores of sizes below 10 nm (15).
When the pore wall potentials overlap the apparent discontinuous meniscus boundary between liquid-like and vapour-like phases becomes smeared out, and there is more a continuous distribution of adsorbate density across the pore. Non-local density functional theory (NLDFT) has been used to predict the condensation and evaporation transitions in such circumstances (15). Comparisons of the predictions of NLDFT with experimental data for (more) ordered porous materials, such as templated silicas with arrays of straight cylindrical pores, like MCM-41 and SBA-15, have suggested that condensation occurs at the adsorption spinodal, while desorption occurs at the equilibrium transition (15).
For pressures thus derived from NLDFT, the value of the parameter δ in Equation (ii) is 1.8 (13). However, hysteresis widths, as measured by the parameter δ in Equation (ii), for different materials vary over the full range of values from 2 to 1.5, and even below, so none of the aforementioned theories supplies a complete description of sorption processes.
NLDFT is partially empirical because the surface potential has to be calibrated from experimental data, typically, for example for silicas, using adsorption on non-porous fumed silicas (16). Hence, the predictions of condensation pressures for NLDFT must be affected by factors such as surface chemistry and roughness that affect wetting. Previous work (17) has also allowed the
cosθ term in Equation (i) to be a free-fitting
and these may have different values of the cosθ
term in Equation (i) for different surfaces (13). This can be exploited for structural characterisation, as will be seen below.
For more complex void spaces there is a further contribution to hysteresis from pore-pore co operative effects. The most well-known such contribution is the so called pore-blocking or ink-bottle effect (18). Pore-blocking is said to arise because, for evaporation to occur, the condensate must have access to a free meniscus.
In a dead-end, ink-bottle geometry the larger (bottle) body only has access to the exterior via the narrow (bottle) neck. The pressure for evaporation from the neck will be lower than that in the body. Since it would not then have access to a free meniscus, the condensate in the body becomes meta-stable when the pressure drops below that required for desorption from an open pore of the same size. The condensate in the body can only
desorb once the pressure drops sufficiently for
the neck condensate to become unstable itself and desorb, thereby causing the free meniscus to retreat back to the entrance to the pore body, which will then immediately desorb.
In a more complex, disordered, interconnected pore network, a given pore may have many potential access routes to the surface, and thus the penetration into the network of the free meniscus as pressure declines is modelled using percolation theory (18). This approach has been used to derive pore network connectivity. It should be noted that in desorption a further key effect that can arise is cavitation, which occurs when the pore necks guarding a larger pore body are below a critical size, generally considered to be approximately 4 nm for nitrogen (19).
In cavitation, the meta-stable condensate in the pore body is stretched until it reaches the limit of stability and spontaneously converts to vapour even
though the pore neck remains filled with liquid.
This typically gives rise to a steep desorption step at a relative pressure of 0.4 for nitrogen (19). The position of this step is thought to be only dependent on properties of the adsorbate, and thus delivers no information on the void pace (beyond that it contains pore necks <4 nm guarding larger pore bodies).
It has been common practice, as in the aforementioned percolation analysis, to presume that there is a simple monotonic relationship between condensation pressure and pore size during adsorption. This is the same as treating an interconnected network of pores as a parallel pore
bundle, similar to the overall arrangement of pores in MCM-41 (3). However, this neglects the potential for pore-pore co-operative effects in adsorption. Two such effects are advanced adsorption and delayed condensation.
The idea underlying advanced adsorption was originally proposed by de Boer (20). The basic mechanism for advanced adsorption can be demonstrated from a consideration of the simplest pore network, namely the through ink-bottle pore, consisting of a through cylindrical pore body accessed by two cylindrical pore necks at either end of the body, with the central axes of all through cylinders aligned along the same straight line. Capillary condensation would be initiated at the cylindrical sleeve menisci in the
pore necks. Once the necks fill with condensate
they create a complete hemispherical meniscus at both ends of the pore body, which previously only had a largely cylindrical sleeve meniscus. Hence, if the condensation pressure for the pore necks via a cylindrical sleeve meniscus exceeds that for condensation via a hemispherical meniscus in the
pore body then both will fill at the same pressure.
According to the Cohan equations, that means that if the pore body radius is less than twice that of the
pore neck then both will fill at the same pressure
(14). Hence, the apparent pore size distribution derived from the adsorption isotherm for such a system would be much narrower than reality.
The advanced condensation effect has also been predicted from molecular simulations of capillary condensation in void spaces with corrugations or irregular geometry, and is also known as the cascade effect (21). Advanced adsorption can be detected where the adsorbate occupancy of neighbouring pores of different sizes can be simultaneously observed, either directly or indirectly. As will be seen below, magnetic resonance imaging (MRI) can be used to observe occupancy of different neighbouring pore sizes when these are each part of extended regions of similar pore size that adjoin each other. Alternatively, as will be described in Section 3.1, the presence of advanced adsorption at the pore scale can be inferred indirectly by utilising complementary information from an independent technique like mercury porosimetry.
For porous catalyst supports where there is a macroscopic heterogeneity (>10 µm) in the spatial arrangement of pore sizes this advanced adsorption effect has been directly observed via MRI using nuclear magnetic resonance (NMR) relaxation time as an independent measure of condensate ganglia
size at a given pressure (22). The typical resolution of the images is between 10 µm and 100 µm, so the images map macroscopic variation in microscopic properties.
For water adsorption in a sol-gel silica material, it was shown, using the fractal BET equation to quantify the shape of the multi-layer region with the surface fractal dimension, that multi-layer build-up was similar for water and nitrogen (22). This agrees with simulations of water adsorption in hydroxylated silica nanopores which suggest low pressure adsorption via pervasive multi-layer build-up, rather than isolated ganglia (23). However, it was observed, for water sorption, that there was not a monotonic relationship between
filling pressure for condensation and pore size, and filled pores were spatially correlated.
The relaxation time distribution obtained for partially saturated samples, at relative pressures
below that needed for complete pore filling,
contained relaxation times from the uppermost tail of the distribution for complete saturation (22). This suggested that some of the largest pores containing condensed phase became completely
filled at lower pressure than some of the smaller pores. Hence, partial pore filling is unlikely to
explain the results. It was also found that the critical ratio of body to neck size for advanced condensation to occur may be substantially higher than two, and thus advanced adsorption may have more impact on pore size distribution (PSD) accuracy than otherwise thought.
A further pore-pore co-operative effect arising during adsorption is (network derived) delayed condensation (24). Delayed condensation occurs when the pore potential in a given pore is reduced below that for a section of void of the same geometry but with completely solid walls, due to side-arms branching off that pore leaving gaps in the walls. For networks consisting of pore bodies at nodes, and pore necks forming lattice branches, the condensation pressure for a pore body of a given size depends upon how many of the adjoining
necks are filled. In such a system the apparent
characteristic pore dimension obtained from gas adsorption would be different to that controlling
invasion of a meniscus of non-wetting fluid or
Knudsen diffusion.
The potential impact of co-operative phenomena on PSD accuracy has been explored by simulation of adsorption within pore network models (25). Matadamas et al. (25) have simulated the effects of delayed and advanced adsorption in pore body-pore neck network models with a range of body-pore
connectivities and overlaps between pore body and neck size distributions. They compared the actual void space descriptors for the underlying models with those derived by standard analysis methods from the simulated isotherms, and showed that
delayed condensation gave rise to a significant
error in the accuracy of the PSD obtained. This
finding means that indirect pore characterisation
methods must address pore-pore co-operative effects to obtain accurate pore size distributions.
The existence of pore-pore co-operative effects in adsorption may explain apparent discrepancies
between previous findings from NMR relaxometry
studies of sorption hysteresis and pore blocking theory (26). In NMR relaxometry studies of partially saturated samples, the measured NMR relaxation time is dominated by the two-fraction,
fast-exchange type relaxation of the liquid confined
to the ganglia (27), and, thus, is sensitive to the characteristic size (i.e. smallest overall dimension) of the ganglia. This is because the residence time of a given water molecule is much larger in
the confinement of the high density liquid phase
compared to the short residence time in the sparsely populated, low density gas phase.
For water sorption in a silica sample, it was found that, at the same level of saturation of the void space on the adsorption and desorption boundary isotherms, the NMR relaxation time of the condensate was the same (26). This suggests that the spatial arrangement of condensate in the void space was the same on each branch at
the same saturation. This result conflicts with conventional monotonic filling and pore blocking
theory mechanisms for adsorption and desorption, respectively, which suggest more larger pore
bodies should still be filled on desorption (18).
This would mean that the measured relaxation time should be larger for the desorption branch than the adsorption branch at the same saturation level. However, as the aforementioned descriptions of pore blocking and advanced condensation show, if the material contains ink-bottle pores
then the pore neck and pore body can both fill
and empty at the same pressure. Hence, with advanced condensation as well as pore blocking,
the condensate configuration would be expected
to be the same on both adsorption and desorption branches of the hysteresis loop, as observed.
saturation with condensate is complete, and then the pressure is reversed (known as descending scanning curves), or experiments where the sample
is first pore filled with condensate and then the
pressure is reduced but this reduction is halted part way down the boundary desorption branch of the hysteresis loop and then the pressure is increased again (known as an ascending scanning curve).
The observed behaviour of scanning curves tends to fall into one of two broad classes. These classes are scanning curves that cross directly from one boundary curve to the other, and those that head for one of the hysteresis closure points. Scanning loops consist of curves where the direction of change of pressure is again reversed before the scanning curve gets to the other boundary isotherm or a hysteresis closure point. Scanning curves potentially deliver information on the relative juxtaposition of pores of different sizes because desorption requires the presence of a free vapour-liquid meniscus. If the sample is only partially saturated when desorption commences, liquid condensate may desorb into the remaining internal vapour pockets as well as the exterior. The occurrence and spatial distribution of these vapour pockets will determine the size and nature of the difference in form between the scanning curve and boundary isotherm. Hence, scanning curves have been used to validate random pore bond networks used to determine pore network connectivity (29). The availability of high resolution sorption apparatus has facilitated the increased use of scanning curves to enhance the amount of information derived from gas sorption (30). Scanning curves have been used to infer indirectly the presence of advanced adsorption and delayed condensation phenomena for nitrogen sorption in SBA-15 (24). More recently, besides percolation theory, molecular simulations have been used to aid interpretation of scanning curves (31), particularly for more chemically heterogeneous systems (32).
2.2 Mercury Porosimetry
Mercury porosimetry is based on the phenomenon that mercury is non-wetting for most surfaces, and thus an external hydrostatic pressure must be applied to force mercury into pores. The pressure, PHg, required is inversely proportional to the pore radius, r, as given by the Washburn equation, shown in Equation (iii) (8):
–2γcosθ (iii)
PHg = r
where γis the surface tension, and θ is the contact angle. The contact angle varies from surface to surface due to differences in surface chemistry and
roughness (33). Unless the contact angle is fixed
independently mercury porosimetry is strictly only a relative technique, although many materials have very similar intrusion contact angles of between 130° and 140° (33). The contact angle for a given material can be obtained from the macroscopic sessile drop experiment. However, for closely
confined systems like mesoporous solids the
contact angle and surface tension can be functions of pore radius. Hence, previous workers (34) have used mesoporous controlled pore glasses (CPGs) as model materials, for which it was possible to calibrate the pore radius independently using electron microscopy, to obtain semi-empirical relations of the form shown in Equation (iv) (33):
–A + √A2 – 2BP
Hg (iv)
r =
PHg
where the parameters A and B are given in Table I.
Table I Parameters for Insertion into Equation (iv)a
Material Advancing meniscus Retreating meniscus
A, nm B, nm2 A, nm B, nm2
MPa MPa MPa MPa
CPG/silica –302.533 –0.739 –68.366 –235.561 a The advancing meniscus values have a pore
radius range of applicability of 6–99.75 nm and the retreating values have a range from 4–68.5 nm (33)
Raw mercury porosimetry data typically exhibits hysteresis, whereby mercury extrudes from the sample at a lower pressure than was needed for it to intrude (8). In addition, some mercury may be retained in the sample, known as entrapment. The hysteresis commonly has two contributions, known as contact angle hysteresis and structural hysteresis.
angle hysteresis is determined by the degree of surface roughness (35). Hence, materials with similar surface fractal dimensions to CPGs have contact angle hysteresis that can be removed using Equation (iv) and the values of its parameters given in Table I derived from calibration using CPGs.
Structural hysteresis is associated with entrapment and is due to less mercury extruded than intruded over the same pressure range. For mercury to retreat from a given sample it must retain a continuous connection to the bulk reservoir. However, the mercury meniscus can break, or snap-off under certain circumstances (36). Experiments suggest that when the mercury thread is forced to go through a narrow neck adjoining a larger pore body the meniscus may snap-off in the neck (37). It has frequently been observed that there is often a critical pore body-to-neck ratio above which snap-off occurs, which is typically >6 (38). Experiments on glass micromodels have shown that the mercury meniscus may also break at the boundary of macroscopic heterogeneities in the spatial distribution of pore sizes, such that regions of large pores isolated in a continuous network of smaller pores will entrap mercury (36).
A combination of MRI experiments to map the macroscopic heterogeneity in the spatial distribution of pore sizes in a catalyst support pellet, with computerised X-ray tomography (CXT) to map the spatial distribution of entrapped mercury, has shown that this effect gives rise to entrapment in such materials (39). Simulation of mercury entrapment in structural models derived from the MRI images suggested that the occurrence of the snap-off process at the boundaries of adjoining
regions of sufficiently disparate pore sizes caused
entrapment as observed in the CXT images. It is possible to use calibrated relations such as Equation (iv) to deconvolute contact angle hysteresis from structural hysteresis. For example, it has been found that Equation (iv) can completely remove the hysteresis in porosimetry data for powdered samples of silica pellets, suggesting it is purely contact angle related in origin (40). However, MRI studies showed that, when whole, these pellets possessed macroscopic heterogeneities in the spatial distribution of porosity and pore size (41). For porosimetry on the whole pellets, some hysteresis and entrapment was retained after application of Equation (iv) to the raw data, and thus this means the macroscopic heterogeneity gave rise to structural hysteresis (40). Given that mercury hysteresis and entrapment are related to
structural features it can thus be used to derive information on these properties of materials, which is especially useful for chemically heterogeneous materials not amenable to fully quantitative MRI methods.
When void spaces are highly interconnected and pore sizes are such that a mercury saturation of 100% can be achieved at the top of the intrusion curve, then the mercury menisci will coalesce throughout the sample, and the mercury threads will all be continuous. In order for the mercury to retract from the sample when the pressure is lowered, there must be free menisci from which extrusion can begin.
Where there has been complete coalescence of menisci on intrusion these free menisci must be re formed by snap-off (42). This means that lowering the pressure stretches the mercury until snap-off occurs. Experiments in straight cylindrical channels (of diameter 4 µm) drilled into glass have shown that, where there is no particularly distinguished location in a pore, this snap-off may occur multiple times within the same pore (43). Simulations have shown that where larger pores are joined via smaller pores snap-off will occur in the smaller pores, but additional delay in retraction pressure, beyond that associated with contact angle hysteresis, will occur (35). This results in a characteristic residual triangular hysteresis at the top of porosimetry data analysed using Equation (iv), where there is a sharp drop in the retraction curve after a horizontal plateau delay relative to the more continuous intrusion (35).
Mercury porosimetry is sometimes mistakenly dismissed as error-prone or misleading because of the so-called pore-shielding or pore-shadowing effect (44). This arises because mercury must enter the sample from the periphery and, if the only access to larger pore bodies in the sample interior is via smaller pore necks on the periphery,
then the mercury pressure must first be raised to
that required to enter the small necks to intrude the sample as a whole. Hence, an over-simplistic interpretation of the data would mean the volume of larger pore bodies would be attributed to the smaller necks.
However, for some applications, such as fluid
permeation in reservoir rocks or adsorption separation processes, the size of pores on the surface of the
sample, as delivered first by porosimetry intrusion
pore body size can be obtained from the retraction curve (already corrected for contact angle effects) (46). Alternatively, as will be seen below, where the mercury becomes entrapped in shielded pore bodies,
it can be used as the probe fluid for thermoporometry
to determine the body size.
2.3 Thermoporometry
Thermoporometry uses the principle that when a
fluid is confined to a porous medium, the freezing and melting points of that fluid are altered.
Commonly, the change in the phase transition point for a small crystal, relative to the bulk, varies inversely with crystal size (47). When a crystal
confined within a cylindrical pore is melting, the
relevant form of the Gibbs-Thompson equation
suggests that the melting point depression ΔTm will be given by Equation (v) (47):
where Tm(x) is the melting point in a pore of diameter x, Tm ∞ is the bulk melting temperature, ΔHf is the bulk enthalpy of fusion, σsl is the solid-liquid surface tension, ρs is the solid phase density, and φ is the contact angle (typically assumed to be
180° for liquid-solid). This equation is frequently
simplified to the form shown in Equation (vi):
where k is known as the Gibbs-Thompson constant.
Probe fluids for thermoporometry typically include
water, or hydrocarbon liquids such as cyclohexane or decane, or mercury. The ideal probe liquid should have a large value of k, and a simple liquid-solid phase transition, such that it is clear when a given pore is molten or frozen. For water, experiments in templated silica materials have suggested a k value of 52 nm K (48). In previous work (6), it has been found that for melting of a mercury crystal, via a hemispherical meniscus, the value of k was 90 nm K.
Before recent work (6), mercury thermoporometry was only used to study the microscopic structure
of confined mercury ganglia, rather than for pore
structure characterisation. Borisov et al. (49) found that a thin liquid-like layer is formed on the
surface of confined, solid mercury ganglia over the
temperature range 195 to 229 K. This liquid-like layer forms the seed site for initiating melting of the solid cores at a higher temperature depending on characteristic size. It is presumed this
liquid-like layer is one molecular diameter thick, and thus the effective crystal size in Equation (vi) becomes x-t, where t is the thickness of the liquid-like layer. Thermoporometry experiments can be performed using either differential scanning calorimetry (DSC) (6), or using NMR (49, 50). In the case of DSC the melting or freezing transition is detected via the flow of latent heat of fusion, while for NMR
the transition is detected via the large decrease in relaxation time for solids compared to liquids, and so the NMR signal from the frozen solid
can be removed by a relaxation time filter. The
advantage of using NMR is that thermoporometry
can be combined with pulsed-field gradient (PFG)
NMR to create the hybrid method known as NMR cryodiffusometry, which can be used to link pore structure and transport directly (51, 52).
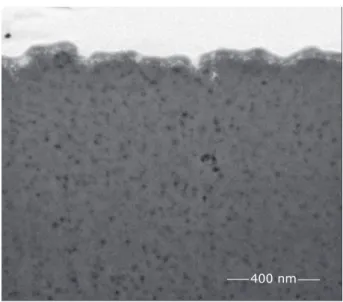
Thermoporometry can be used to directly determine pore shape since analysis by Petrov and Furo (53) has suggested that for phase transitions in through cylinders the melting point depression should be twice that of the freezing point depression. For example, the overall network architecture, and the cylindrical shape of constituent nanopores, within a small region of the sol-gel silica sphere Q1 have been independently determined by noting the similarity in the form of the images of cross-sections of the real void space obtained from focused-ion beam (FIB) SEM methods (such as the example shown in Figure 1) with simulated images obtained from sectioning a random pore bond network (shown in Figure 2) (2).
ΔTm = Tm ∞ –Tm (x) = – 4δslTm ∞ xΔHfρs
cos(φ) (v)
ΔTm = k/x (vi)
400 nm
(a) (b)
Fig. 2. (a) View of a random, cylindrical pore-bond network model with 512 nodes and 1726 cylindrical pores; (b) view of simulated random planar section through network in (a). The discrete black and white ovoids correspond to small and large pores, respectively, and the continuous grey matrix corresponds to solid. Reprinted from (2). Copyright (2017), with permission from Elsevier
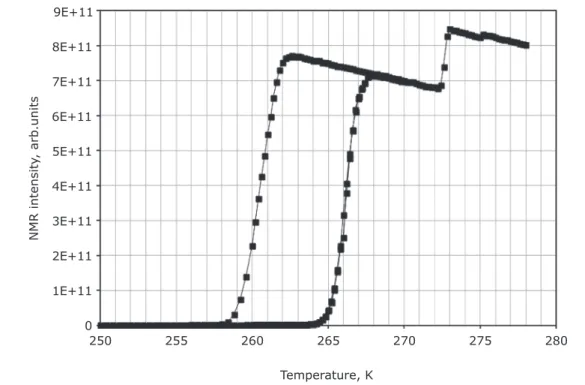
Figure 3 shows the NMR thermoporometry data the pore fluid, the large step at intermediate
for a sample of Q1 fully saturated with deionised temperature is the melting transition for the pore
water as the probe fluid. The large vertical step fluid, while the small step at 273 K is the melting
at low temperature is the freezing transition for and freezing transition for the bulk water film on
280 275
270 265
260 255
250 0 1E+11 2E+11 3E+11 4E+11 5E+11 6E+11 7E+11 8E+11 9E+11
NMR intensit
y, arb
.units
Temperature, K
the exterior of the sample pellets. The slope in the top plateaus is caused by the Curie effect (47). The
melting point depression of the point of inflexion
of the freezing curve (6 K) was twice that of the freezing curve (12 K). According to the analysis of Petrov and Furo (53), this suggests the pores are cylindrical in geometry, in line with the imaging data. This suggests the pore geometry that
happens to be observed in the image field of view
is also more pervasive throughout the sample. Freezing in thermoporometry is an invasion percolation process like gas desorption, and thus can also be used to obtain pore connectivity using percolation theory (18, 50). By analogy with gas adsorption, thermoporometry melting curves can be theorised to be affected by an advanced melting phenomenon in ink-bottle type pore geometry (54). For melting to be initiated there should be a free meniscus with molten phase. In thermoporometry, for a fully saturated, through-pore, wetting sample, melting is generally initiated from a cylindrical sleeve shaped meniscus at the boundary between the non-freezing layer at the pore wall and the ice in the pore core. However, if a smaller neck in a through ink-bottle geometry melts it creates a complete hemispherical meniscus at the entrance to the larger pore body. If the melting point for the pore body, via a hemispherical meniscus, is lower than the melting point via a cylindrical sleeve shaped meniscus for the pore neck, then both will melt together. This effect has also been predicted by computer simulation of melting in disordered porous media (55).
The existence of this effect has been confirmed
by experiments on whole and powdered samples of mesoporous pellets independently (via MRI) shown to possess macroscopic heterogeneities in the spatial distribution of pore sizes larger than the powder particle size (30 µm) (54). The sharply increasing melting curve for the whole pellet sample became more gently sloping when the sample was fragmented, and thus the direct contact between regions of small and large pores that was previously facilitating advanced melting was broken.
3. Hybrid Methods
3.1 Integrated Gas Sorption and
Mercury Porosimetry
As mentioned above, integrated gas sorption and mercury porosimetry consists of a series of gas sorption and porosimetry experiments conducted
in series on exactly the same sample each time, with any entrapped mercury frozen in situ after a porosimetry step (5), since nitrogen adsorption is carried out at 77 K and the freezing point of bulk mercury is around 234 K. The stages of the experiment are shown schematically in Figure 4. The gas sorption isotherms from after mercury entrapment can be subtracted from those obtained beforehand to obtain the isotherms for just the region of the sample affected by the entrapment. The virtue of this integrated experiment is that the mercury porosimetry data provides detailed independent information on the void space where the mercury became entrapped.
A B C
D E
F
B–F =
Fig. 4. Schematic diagram of integrated gas sorption and mercury porosimetry experiment. The stages of the experiment are: A Empty sample; B
First gas sorption experiment; C Empty sample;
D Hg porosimetry; E Hg entrapment; F Second gas sorption experiment. Reprinted from (43). Copyright (2014), with permission from Elsevier
The method can be further combined with CXT to reveal the macroscopic spatial distribution of entrapped mercury (43, 56). This further development has some similarities to the past low melting point alloy (or Wood’s metal) intrusion technique that uses electron microscopy to look at spatial distribution of frozen, intruded alloy (57).
at around 30 nm. Glass micro-model experiments (36) suggest that, in samples with heterogeneities in the spatial distribution of pore size, mercury tends to get entrapped within isolated regions of the largest pores that are surrounded by regions of smaller pores due to snap-off of the mercury menisci at the periphery of the region of larger pore sizes. Hence, the CXT images can effectively provide maps of the location of the largest pores, and, thence, reveal spatial correlations in pore size, which may be related to manufacturing route. For example, sol-gel spheres are often grown from central seeds, and these may be evident in the CXT images.
Entrapped mercury is meta-stable, and, thus, a key issue for hybrid methods is whether the mercury moves around between the end of the porosimetry experiment and the start of the next experiment, such as gas sorption or thermoporometry. The driving force for this potential movement is the minimisation of the surface energy of the entrapped phase. However, the potential for, and rate of, mercury migration can be studied using either the integrated method itself, or other complementary techniques (58).
Gas sorption experiments have been conducted both immediately after porosimetry, and a week
later, and while for some materials no significant
variation in isotherm shape has been observed, for
others significant changes did occur over this time
(58). Mercury entrapped following porosimetry experiments with shorter equilibration times tends
to be more unstable and likely to move than that entrapped in the course of experiments with longer equilibration times. The sample mean grain size of entrapped mercury ganglia can be obtained using small-angle X-ray scattering (SAXS), and, for example, for the sample of pellets from the batch of sol-gel silica spheres denoted Q1 this was found to be 5.71 ± 0.71 nm and 5.88 ± 0.11 nm for immediately after the integrated experiments, and seven days later, respectively (58).
This suggests that the ganglia of entrapped
mercury did not change significantly in characteristic
size over this period. SAXS has the virtues that the sample preparation is minimal, it does not need to be frozen before the experiment is conducted, and the scattering pattern can be obtained quite quickly, so a result can be obtained very rapidly after sample discharge from the porosimeter. CXT images can also be obtained immediately after porosimetry, and some time later, and compared in order to detect any migration of entrapped mercury occurring over macroscopic length scales.
Integrated experiments have been used to obtain pore length distributions (7), and reveal differences in mercury entrapment mechanism between samples (59). In particular, integrated experiments have been used to detect pore-pore co-operative effects, as discussed below.
Nitrogen sorption scanning curves for samples before and after mercury entrapment have been used to demonstrate the presence of the advanced Fig. 5. Two examples of X-ray tomography projection images of mercury (black) entrapped within a sol-gel silica sphere (grey), denoted batch G2. The scale bar represents 1000 µm
condensation effect for nitrogen adsorption (43).
Specific amount adsorbed is expressed per unit
mass of silica even after mercury entrapment to make the data-sets easily comparable. To produce scanning curves that are only for the pores affected by mercury entrapment, the experimental gas sorption data points following mercury porosimetry were subtracted from the equivalent data points before mercury porosimetry.
Figure 6(a) shows the desorption scanning curves, starting at relative pressure 0.948, for all
condensate-filled pores in sol-gel silica S1 (solid line)
and for those affected by entrapped mercury (closed squares). Further, Figure 6(b) shows the adsorption scanning curves, starting at relative pressure 0.894, for all empty pores in S1 (solid line) and for the pores
affected by entrapped mercury (open diamonds). The scanning curves for all pores start to descend or ascend immediately, but reach the other boundary
isotherm before the final hysteresis closure point,
so some pores have reversible condensation, while
others do not. The final intersection point of the
scanning curve is the composite of the terminus of the curves for both types. The adsorption and desorption scanning curves for just the pores affected by entrapped mercury cross directly horizontally between the boundary curves. Pores which give rise to directly crossing ascending and descending scanning curves appear to be independent, like the through cylindrical pores in MCM-41. This is because, for independent pores, condensation would occur in just one step via the cylindrical sleeve-shaped meniscus, and desorption in just one step via a hemispherical meniscus. However, the pores that entrap mercury in S1 are actually part of a complex interconnected network.
In order to account for the apparent independence of the pores that entrap mercury, they must empty of condensate by the pore
blocking mechanism, but also fill with condensate
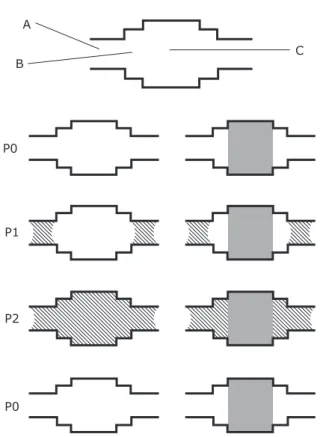
by the advanced adsorption mechanism. Consideration of sorption within the simple pore model presented in Figure 7 will demonstrate why the capillary condensation and evaporation mechanisms for S1 must be as just stated (43).
The pore model is made up of three pore segments, A, B and C, in which, following a mercury
porosimetry experiment, pore C becomes filled with
entrapped mercury. The sizes of the pores are in the order pore C > pore B > pore A, and the pressure of the system is shown as P0 or P1, where P1 > P0. At pressure P0 no nitrogen has condensed within the pore model. As the pressure is increased to P1,
pore A fills with condensed gas via a cylindrical-sleeve type meniscus. Since pore B then acquires a closed end, the condensate meniscus in pore A can then invade pore B and pore C by the advanced adsorption mechanism. This means pore C, which entraps mercury (following mercury porosimetry)
fills at the same pressure as pore A. When the
pressure is subsequently lowered, pore C and B could only empty once the liquid condensate within pore A had evaporated. This is because of the aforementioned pore blocking mechanism, and pore A will empty at pressure P0 by a hemispherical meniscus. Hence, pore C, which entraps mercury (following mercury porosimetry) would empty at the same pressure as pore A. Therefore, pore C would appear as an independent pore in a gas sorption experiment. Further, the capillary condensation and
0.7 0.8 0.9 1
Fig. 6. (a) The desorption scanning curve for all pores (solid line) and pores that became entrapped with mercury (open squares) for sol-gel silica S1. Arrows have been added to indicate the direction of the change in pressure; (b) adsorption scanning curve for all pores (solid line) and pores that became entrapped with mercury (open diamonds) for S1. Arrows have been added to indicate the direction of the change in pressure. Reprinted from (43). Copyright (2014), with permission from Elsevier
P/P0
Volume adsorbed, cm
3 STP g –1 800
700 600 500 400 300 200 100 0
0.7 0.8 0.9 1
P/P0
P/P0=0.948
P/P0=0.894 800
700 600 500 400 300 200 100 0
Volume adsorbed, cm
3 STP g
A
C B
P0
P1
P2
P0
Fig. 7. A pore model where pore size C > B > A, and a gas sorption process is also shown. Condensed gas is shown by the line shading and entrapped mercury is shown by the solid grey shading. The schematic is explained in the main text. Reprinted from (43). Copyright (2014), with permission from Elsevier
evaporation in pore C would happen at pressures anticipated for a pore of size A.
A comparison of the mercury intrusion curves for whole and powdered samples of S1 showed that the pores that entrapped mercury were shielded by pores from 1 nm to 2 nm smaller than themselves (60). This is within the range of critical sizes predicted by the Cohan equations (14). Pore A does not behave like a dead-end pore following entrapment in pore C due to the intermediate still empty pore B.
The aforementioned findings, from the integrated
experiment with scanning curves, has revealed a lower limit to the resolution possible for the pore size distribution with gas sorption. Materials with an apparently narrow PSD may, in fact, have a much wider distribution concealed by advanced adsorption effects. However, the integrated experiment showed that mercury extrusion was still sensitive to the pore size variation present that went undetected by gas sorption.
The integrated experiment has demonstrated that argon and nitrogen wet the surface of entrapped mercury differently (13). The multi-layer region
of the adsorption isotherm can be analysed using a fractal version of the BET equation that takes
account of surface roughness and quantifies it
using a surface fractal dimension parameter. When mercury becomes entrapped within an amorphous, mesoporous solid, it blocks access to much of the rough surface of the solid, and creates many other smooth metallic surfaces. Hence, if the adsorbate
multi-layer film wets the mercury significantly,
it will expand across it and the average surface roughness will decline. In contrast, if the adsorbate does not wet the smooth mercury surface well,
the surface film will largely remain confined to the
rough surface. Hence, in the case of the former adsorbate, the surface fractal dimension will decline following mercury entrapment, while, in the latter case, the fractal dimension will remain the same. The former effect is what has been observed for nitrogen and the latter for argon (13).
When mercury becomes entrapped within a pore adjoining the end of a through cylindrical pore, that particular through-pore then becomes a dead-end pore. However, the capillary condensation pressure of an adsorbate within the pore will only be reduced (as according to Equation (i)), through a change in the transition from occurring via a cylindrical-sleeve meniscus to via a hemispherical meniscus, if the adsorbate wets the new dead-end. This effect has been observed for nitrogen, but does not also arise for argon (which does not wet the new dead-end), in a hierarchical macro-/meso-/micro-porous silica-alumina catalyst pellet (10).
Similarly, for a through pore with intersections with side pores along its walls, the resulting holes in the pore potential will only be patched by entrapment of mercury in the side pores if the adsorbate wets that mercury. Hence, the difference in wetting between nitrogen and argon can be used to detect the delayed condensation effect (2). If some pore volume accessibility is lost to both nitrogen and argon, but only nitrogen isotherms show a decrease in capillary condensation pressure following mercury entrapment, then the delayed condensation effect is occurring. This effect is shown schematically in Figure 8.
Nitrogen Argon
Straight-through pore Straight-through pore
Hg Hg
Pressure Before
porosimetry
Incremental adsorbed amount After
porosimetry
Cumulative difference plot
(before-after)
Fig. 8. Schematic diagram showing the anticipated impact of entrapped mercury on the form of cumulative difference in incremental amount adsorbed (before mercury minus amount afterwards) plots for nitrogen and argon. The cumulative difference plot below also includes the broadening expected due to the presence of a range of pore sizes where the effect might happen. Reprinted from (2). Copyright (2017), with permission from Elsevier
(a) (b)
Cumulativ
e difference in amount
adsorbed, cc STP g
–1
0
–20
–30 –10 10 20 30 40
0.0 0.2 0.4 0.6 0.8 1.0 1.2
0 –5
0.6 0.7 0.8 0.9 1.0
5 20 35 40 45
30 25
15 10
Cumulativ
e difference in amount
adsorbed, cc STP g
–1
Relative pressure Relative pressure
Fig. 9. Cumulative difference in amount adsorbed plots for adsorption of: (a) nitrogen; and (b) argon on typical samples from batch Q1. Reprinted from (2). Copyright (2017), with permission from Elsevier
large positive peak appears at higher pressure. In contrast, for argon, while the large positive peak at high pressure is also observed, there is virtually no negative peak at lower pressure.
A negative peak in such plots corresponds to a pressure range where the amount adsorbing has
increased following porosimetry. Since entrapped mercury is blocking access to previously open voids, thereby reducing adsorption capacity, the only way this can apparently happen is if the condensation pressure for some pores that remain open shifts
pores neighbouring those with entrapped mercury have shifted lower in capillary condensation pressure, but this has not happened to anything like the same degree for argon.
The pores where the condensation corresponding to the negative peak is occurring have had the
holes in their walls patched with wetting filler
(mercury), and thus now have a much increased pore potential, and the delayed condensation effect has been removed. The relative pressure for the negative peak in Figure 10 of around 0.84 is approximately the square of the relative pressure of 0.93 for the positive, suggesting a discrepancy in pore size of a factor of around 2, and thereby gives an estimate of the size of the error in the pore size that the delayed condensation effect creates. The size of the negative peak gives an estimate of the volume of pores affected by delayed condensation.
Difference in incremental amount
adsorbed, cc STP g
–1
3.2 Combined Mercury Porosimetry
and Thermoporometry
As mentioned above, mercury entrapped during
porosimetry can be used as the probe fluid for
thermoporometry (6). The mercury saturation at the end of a porosimetry experiment can range from 100% to 0%. In order to successfully relate the thermoporometry data to the porosimetry data it is important that the mercury does not redistribute before or during the thermoporometry experiment. However, it has been suggested that mercury in partially saturated samples may retreat from some pores during the freezing process (63). The volumetric thermal contraction of liquid mercury on cooling from 298 K to 234.4 K is around 1%, while that for solid mercury on cooling from 234.4 K to
77 K is 0.4%. Hence, any significant retreat must
be a dewetting phenomenon. This effect can be tested for by multi-cycle thermoporometry.
In multi-cycle thermoporometry the same sample is repeatedly frozen and melted several times in series. If the freezing process is inducing mercury migration, such as a retreat from smaller pores, this should become evident from a progressive shift in the melting peak position over repeated freeze-thaw cycles. An example of a set of results of such experiments is shown in Figure 11. It
20 15 10 5 0 –5 –10 –15
Relative pressure
0.0 0.2 0.4 0.6 0.8 1.0 1.2
Temperature, °C
–75 –65 –55 –45 –35
0.0
–0.5
Fig. 10. Plot of difference in incremental amount adsorbed at particular relative pressures obtained by subtracting the isotherm obtained after porosimetry from that obtained beforehand for a sample from batch Q1. Reprinted from (2). Copyright (2017), with permission from Elsevier
Integrated experiments also enable the relationship between pore structure and mass transport to be probed directly without the need for intermediate pore network modelling (61, 62). The relative importance of particular subsets of pores to mass transport within a given void space can be determined by measuring transport rates with and without that subset included in the pore network. A subset of pores can be removed from the network
by filling with entrapped mercury via porosimetry.
–1.0
–1.5
–2.0
–2.5
–3.0
–3.5
Fig. 11. Mercury DSC thermoporometry melting curves obtained with temperature ramp rates in the order 0.5 (red dot-dashed line), 0.8 (green dashed line), 1.0 (purple dotted line), and 1.5 (solid blue line), °C min–1, for copper-zinc oxide
catalyst during repeated freeze-thaw cycling experiment on same sample. The sharp peaks at approx. –39°C correspond to the melting of the reference bulk mercury added to sample pan. The
Heat flow
, mW
sample was cooled to –80°C at the start of each Mercury porosimetry scanning curves and loops
can be used to manipulate mercury into particular subsets of pores (61).
can be seen that repeated freeze-thaw cycles did
not give rise to a significant shift in melting peak
position. It was also found that over the ranges tested the temperature ramp rate for DSC also did not affect peak position.
Since mercury tends to become entrapped in shielded (or shadowed) pores then mercury thermoporometry can be used to de-shield mercury porosimetry PSDs without the need for pore network modelling, which requires a priori knowledge of pore connectivity to determine pore accessibility (6). The DSC thermoporometry data provides the PSD of the shielded pores. Comparisons between mercury porosimetry and thermoporometry can also be used to determine whether the parameters in Equation (iii) and Equation (v) vary differently with pore size relative to each other (64).
4. Conclusions
It has been demonstrated that pore-pore co operative effects are present for a variety of characterisation techniques for disordered materials, such that the occurrence of these effects can be cross-validated between different techniques. Hybrid combinations of the various common indirect characterisation methods have been shown to vastly expand their power to deliver descriptors of complex disordered porous solids. It has been seen that the physical effects idiosyncratic to porous materials with interconnected pore networks, such as advanced condensation and melting, can also expand the range of information on pore structures and the processes occurring within them.
References
1. A. J. Koster, U. Ziese, A. J. Verkleij, A. H. Janssen
and K. P. de Jong, J. Phys. Chem. B, 2000, 104,
(40), 9368
2. S. P. Rigby, M. Hasan, I. Hitchcock and R. S.
Fletcher, Colloids Surf. A: Physicochem. Eng.
Aspects, 2017, 517, 33
3. C. T. Kresge, M. E. Leonowicz, W. J. Roth, J. C.
Vartuli and J. S. Beck, Nature, 1992, 359, 710
4. S. P. Rigby, K. Beanlands, I. O. Evbuomwan, M. J.
Watt-Smith, K. J. Edler and R. S. Fletcher, Chem.
Eng. Sci., 2004, 59, (22–23), 5113
5. S. P. Rigby, R. S. Fletcher and S. N. Riley, Chem.
Eng. Sci., 2004, 59, (1), 41
6. B. Bafarawa, A. Nepryahin, L. Ji, E. M. Holt,
J. Wang and S. P. Rigby, J. Colloid Interface Sci.,
2014, 426, 72
7. S. P. Rigby, M. J. Watt-Smith and R. S. Fletcher,
J. Catal., 2004, 227, (1), 68
8. F. Rouquerol, J. Rouquerol and K. Sing, “Adsorption
by Powders and Porous Solids: Principles, Methodology and Applications”, Academic Press, London, UK, 1999
9. L. D. Gelb, Mol. Phys., 2002, 100, (13), 2049
10. S. P. Rigby, M. Hasan, L. Stevens, H. E. L. Williams
and R. S. Fletcher, Ind. Eng. Chem. Res., 2017,
56, (50), 14822
11. J. C. P. Broeckhoff and J. H. de Boer, J. Catal.,
1968, 10, (4), 377
12. M. Kruk, M. Jaroniec and A. Sayari, Langmuir,
1997, 13, (23), 6267
13. I. Hitchcock, S. Malik, E. M. Holt, R. S. Fletcher
and S. P. Rigby, J. Phys. Chem. C, 2014, 118,
(35), 20627
14. L. H. Cohan, J. Am. Chem. Soc., 1938, 60, (2),
433
15. A. V. Neimark and P. I. Ravikovitch, Micro. Meso.
Mater., 2001, 44–45, 697
16. P. I. Ravikovitch, S. C. O. Domhnaill, A. V. Neimark,
F. Schueth and K. K. Unger, Langmuir, 1995, 11,
(12), 4765
17. G. P. Androutsopoulos and C. E. Salmas, Ind. Eng.
Chem. Res., 2000, 39, (10), 3764
18. N. A. Seaton, Chem. Eng Sci., 1991, 46, (8), 1895
19. C. J. Rasmussen, A. Vishnyakov, M. Thommes, B. M. Smarsly, F. Kleitz and A. V. Neimark, Langmuir, 2010, 26, (12), 10147
20. J. H. De Boer, ‘The Shapes of Capillaries’, in “The Structure and Properties of Porous Solids”, eds. D. H. Everett and F. S. Stone, Butterworths
Scientific Publications, London, UK, 1958, p. 68
21. F. Detchverry, E. Kierlik, M. L. Rosinberg and
G. Tarjus, Langmuir, 2004, 20, (19), 8006
22. I. Hitchcock, J. A. Chudek, E. M. Holt, J. P. Lowe
and S. P. Rigby, Langmuir, 2010, 26, (23), 18061
23. P. A. Bonnaud, B. Coasne and R. J.-M. Pellenq, J. Phys.: Condens. Matter, 2010, 22, (28), 284110 24. J. M. Esparza, M. L. Ojeda, A. Campero,
A. Domı́nguez, I. Kornhauser, F. Rojas, A. M.
Vidales, R. H. López and G. Zgrablich, Colloids
Surf. A: Physicochem. Eng. Aspects, 2004, 241,
(1–3), 35
25. J. Matadamas, R. Alférez, R. López, G. Román,
I. Kornhauser and F. Rojas, Colloids Surf.
A: Physicochem. Eng. Aspects, 2016, 496, 39 26. P. Porion, A. M. Faugère, P. Levitz, H. Van Damme,
A. Raoof, J. P. Guilbaud and F. Chevoir, Magn.
Reson. Imag., 1998, 16, (5–6), 679
27. K. R. Brownstein and C. E. Tarr, J. Magn. Reson.,
1977, 26, (1), 17
28. G. A. Tompsett, L. Krogh, D. W. Griffin and
W. C. Conner, Langmuir, 2005, 21, (18), 8214
29. H. Liu, L. Zhang and N. A. Seaton, J. Colloid
30. R. Cimino, K. A. Cychosz, M. Thommes and
A. V. Neimark, Colloids Surf. A: Physicochem.
Eng. Aspects, 2013, 437, 76
31. Y. Zeng, S. J. Tan, D. D. Do and D. Nicolson,
Colloids Surf. A: Physicochem. Eng. Aspects,
2016, 496, 52
32. L. Sarkisov. A. Centineo and S. Brandani, Carbon,
2017, 118, 127
33. J. Kloubek, Powder Technol., 1981, 29, (1), 63
34. A. A. Liabastre and C. Orr, J. Colloid Interface Sci.,
1978, 64, (1), 1
35. S. P. Rigby and P. I. Chigada, Langmuir, 2010, 26,
(1), 241
36. N. C. Wardlaw and M. McKellar, Powder Technol.,
1981, 29, (1), 127
37. C. D. Tsakiroglou and A. C. Payatakes, Adv. Colloid
Interface Sci., 1998, 75, (3), 215
38. G. P. Matthews, C. J. Ridgway and M. C. Spearing, J. Colloid Interface Sci., 1995, 171, (1), 8
39. M. J. Watt-Smith, S. P. Rigby, J. A. Chudek and
R. S. Fletcher, Langmuir, 2006, 22, (11), 5180
40. S. P. Rigby and K. J. Edler, J. Colloid Interface Sci.,
2002, 250, (1), 175
41. S. Rigby and L. F. Gladden, Chem. Eng. Sci., 1996,
51, (10), 2263
42. H. Giesche, Part. Part. Sys. Charact., 2006, 23,
(1), 9
43. I. Hitchcock, M. Lunel, S. Bakalis, R. S. Fletcher,
E. M. Holt and S. P. Rigby, J. Colloid Interface Sci.,
2014, 417, 88
44. S. Diamond, Cement Concrete Res., 2000, 30,
(12), 1987
45. A. J. Katz and A. H. Thompson, J. Geophys. Res:
Solid Earth, 1987, 92, (B1), 599
46. J. Van Brakel, S. Modrý and M. Svatá, Powder
Technol., 1981, 29, (1), 1
47. J. Mitchell, J. B. W. Webber and J. H. Strange, Phys. Rep., 2008, 461, (1), 1
48. A. Schreiber, I. Ketelsen and G. H. Findenegg, Phys. Chem. Chem. Phys., 2001, 3, (7), 1185 49. B. F. Borisov, E. V. Charnaya, P. G. Plotnikov, W.-D.
Hoffmann, D. Michel, Yu. A. Kumzerov, C. Tien and
C.-S. Wur, Phys. Rev. B, 1988, 58, (9), 5329
50. E. L. Perkins, J. P. Lowe, K. J. Edler, N. Tanko and
S. P. Rigby, Chem. Eng. Sci., 2008, 63, (7), 1929
51. A. V. Filippov and V. D. Skirda, Colloid J., 2000,
62, (6), 759
52. E. Shiko, K. J. Edler, J. P. Lowe and S. P. Rigby, J. Colloid Interface Sci., 2012, 385, (1), 183
53. O. Petrov and I. Furó, Phys. Rev. E, 2006, 73, (1),
011608
54. I. Hitchcock, E. M. Holt, J. P. Lowe and S. P. Rigby, Chem. Eng. Sci., 2011, 66, (4), 582
55. D. Kondrashova and R. Valiullin, J. Phys. Chem. C,
2015, 119, (8), 4312
56. P. Klobes, H. Riesemeier, K. Meyer, J. Goebbels
and K.-H. Hellmuth, Fresenius J. Anal. Chem.,
1997, 357, (5), 543
57. F. A. L. Dullien, Powder Technol., 1981, 29, (1),
109
58. S. P. Rigby, P. I. Chigada, I. O. Evbuomwan, J. A.
Chudek, T. Miri, J. Wood and S. Bakalis, Chem.
Eng. Sci., 2008, 63, (24), 5771
59. S. P. Rigby and R. S. Fletcher, Part. Part. Syst.
Charact., 2004, 21, (2), 138
60. S. P. Rigby, P. I. Chigada, E. L. Perkins, M. J. Watt-
Smith, J. P. Lowe and K. J. Edler, Adsorption, 2008,
14, (2–3), 289
61. A. Nepryahin, E. M. Holt, R. S. Fletcher and S. P.
Rigby, Chem. Eng. Sci., 2016, 152, 663
62. A. Nepryahin, R. S. Fletcher, E. M. Holt and S. P.
Rigby, Adsorption, 2016, 22, (7), 993
63. J. Kaufmann, Cem. Concr. Compos., 2010, 32,
(7), 514
64. P. E. Dim, R. S. Fletcher and S. P. Rigby, Chem.
Eng. Sci., 2016, 140, 291
The Author
Sean Rigby obtained his first degrees and PhD in Chemical Engineering from the University