Testing gravity on Large Scales
Alvise Raccanelli1,2,a
1Jet Propulsion Laboratory, California Institute of Technology, Pasadena CA 91109, USA
2California Institute of Technology, Pasadena CA 91125, USA
Abstract.We show how it is possible to test general relativity and different models of gravity via Redshift-Space Distortions using forthcoming cosmological galaxy surveys. However, the theoretical models currently used to interpret the data often rely on simpli-fications that make them not accurate enough for precise measurements. We will discuss improvements to the theoretical modeling at very large scales, including wide-angle and general relativistic corrections; we then show that for wide and deep surveys those cor-rections need to be taken into account if we want to measure the growth of structures at a few percent level, and so perform tests on gravity, without introducing systematic errors. Finally, we report the results of some recent cosmological model tests carried out using those precise models.
1 Introduction
TheΛCDM+GR paradigm is at the moment our best explanation for current observations; however,
its explanation for the accelerated expansion of the universe is based on a phenomenological model with no strong theoretical foundation. This acceleration can be explained introducing a dark energy component, or with modifications of Einstein’s General Relativity theory of gravitation on
cosmolog-ical scales (see [1] for a review on different dark energy and modified gravity models).
These two approaches can be easily described by looking at how it is possible to modify Einstein’s field equations. To explain the accelerated expansion of the universe, one can introduce a dark en-ergy component and so modify the right-hand side of the Einstein’s equations (Eq. 1), or modify the geometric side of them (Eq. 2):
Gµν =Tµν+Tµνde, (1)
Gµν+GMGµν =Tµν. (2)
These modifications to the Einstein’s equations alter the gravitational growth of large-scale struc-tures that we see traced by the distribution of galaxies. These strucstruc-tures derive from amplifications
of primordial fluctuations through gravitational instability; the rate at which structure grows offers
a key discriminant between cosmological models; different models predict different growth rate of
large-scale structure (e.g. [2–4]). Models with general relativity and a dark energy component predict
different large-scale structure formation compared with modified gravity models with the same
back-ground expansion (see e.g. [5–7]). Thus, observations of the large-scale structure of the Universe have
ae-mail: [email protected] C
played an important role in developing our standard cosmological model and will play an essential role in our investigations on the origin of cosmic acceleration.
In this proceeding we show how we can use measurements of the clustering of galaxies to test cosmological models and we present corrections to the standard analysis that will need to be intro-duced when considering galaxies with very large separations. Then we make use of prescriptions and measurements of SDSS-II data from [8], to constrain two interesting alternatives to the standard cosmology: a particular class of Unified Dark Matter (UDM) [9, 10] and the normal-branch Dvali-Gabadadze-Porrati (DGP) [11] models.
Clustering analyses are also complementary to other probes, since they depend on temporal met-ric perturbations, while e.g. weak lensing depends on the sum of the temporal and spatial metmet-ric
perturbations and the Integrated Sachs-Wolfe effect depends on the sum of their derivatives [12].
2 Redshift-Space Distortions
Observations of Redshift Space Distortions (RSD) in spectroscopic galaxy surveys are a promising way to study the pattern and the evolution of the Large Scale Structure of the Universe [13, 14], as they provide constraints on the amplitude of peculiar velocities induced by structure growth, thereby allowing tests of the theory of gravity governing the growth of those perturbations.
RSD arise because we infer galaxy distances from their redshifts using the Hubble law: the radial component of the peculiar velocity of individual galaxies will contribute to each redshift and be mis-interpreted as being cosmological in origin, thus altering our estimate of the distances to them; the relation between the redshift- and real-space positions is:
s(r)=r+v(r)ˆr, (3)
wheresis the redshift space position,rthe real space one, andvrthe velocity in the radial direction.
Most previous RSD analyses have used the simple plane-parallel approximation (see e.g. [14]). In
this case (in Fourier space), a mode ˆδs(k) in redshift space is simply equal to the unredshifted mode
ˆ
δr(k) amplified by a factor 1+βµ2
k:
ˆ
δs(k)=(1+βµ2 k) ˆδ
r(k), (4)
whereβ=f/bandbis the bias relating the luminous matter to the mass; the parameter f:
f = dlnD
dlna , (5)
is the logarithmic derivative of the linear growth rate,D(a)∝δm, with respect to the scale factora(δm
being the fractional matter density perturbation).
For this reason, measurements of the power spectrum or the 2-point correlation function of
galax-ies in redshift-space allow us to determine f, and hence to test different cosmological models; in
par-ticular, these measurements provide a good discriminant between modified gravity and dark energy models (see e.g. [15–17]); RSD have been measured in both Fourier- and real-space (e.g. [18–25]).
3 Large scales corrections to Redshift-Space Distortions
ξ
w
a /
ξ
pp
0.8 0.9 1.0 1.1 1.2 1.3 1.4 1.5
θ
0 0.1 0.2 0.3 0.4 0.5
ξ
GR
/
ξ
Nwt
1.01 1.02 1.03 1.04 1.05 1.06
z1
0.26 0.28 0.30 0.32 0.34 0.36 0.38 0.40 0.42 0.44
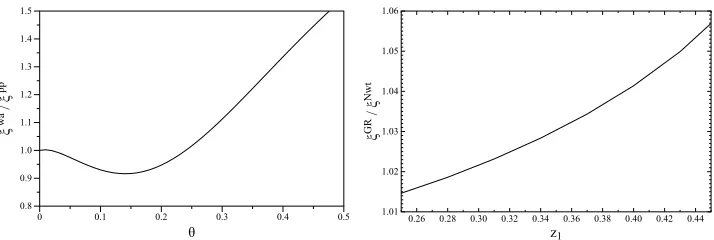
Figure 1. Large-scale corrections to the correlation function. Left Panel: wide-angle corrections to the angle-averaged correlation function as a function of the separation angleθ(in radians), for a separation scale of 79 h−1Mpc. Plotted is the ratio of the correlation function including wide-angle corrections to the plane-parallel
model (see [30]);Right Panel: general relativistic corrections to the correlation function along the line of sight, with z2=0.1 andθ=0.1 rad. Plotted is the ratio of the correlation function including GR corrections to the
newto-nian model (see [36]).
angular separation and general relativistic corrections are needed on large scales. Here we focus on the large scale corrections, given that modifications to GR are more likely to be needed on the largest scales.
Wide angle corrections arise when one takes in account the angular separation between the galax-ies; a formalism including these new terms have been proposed in [26–29], and then tested with simulations [30] and real data [8].
Analyzing the clustering on scales comparable to the Hubble scale can give better constraints on dark energy and modified gravity models and test general relativity itself. However, when looking
at those scales with future surveys, such as e.g. the Square Kilometre Array (SKA)1, the Newtonian
analysis is not anymore a good approximation; General Relativistic effects will become important.
Therefore, we need to improve the theoretical modeling of the clustering on large scales; the Newto-nian analysis needs to be modified to include General Relativistic corrections (see e.g. [31–36]).
In Figure 1 we plot the corrections to the correlation function due to wide-angle and general
relativistic effects; for details on those corrections and the models used, see [30, 36].
It is important to note that measurements of the correlation function neglecting wide-angle and general relativistic corrections can lead to an incorrect estimate of the cosmological parameters. It has also been shown that modifications due to GR corrections are degenerate with primordial
non-Gaussianity effects [37, 38]. These errors are usually on the percent level, but given that forthcoming
surveys aim to measure the growth at few percent level, those corrections will need to be included in future modeling.
4 Model testing and results
In [39] we used the extended analysis tested in [8], which includes a more realistic description of the geometry of the system, drops the plane-parallel approximation and includes corrections due to the pair orientation distribution and BAO non-linearities; this allowed us to fit the observed galaxy correlation function on a larger range of scales, and therefore to be more sensitive to the cosmological
parameter variations. With it, we test a class of Unified Dark Matter and normal-branch DGP models; we will now briefly present the two models and then show some results.
4.1 UDM
We refer to a class of Unified Dark Matter (UDM) scalar field models in which a single scalar field is responsible for both the late time accelerated expansion of the Universe and the growth of structures; for details about this models see [9, 10, 40].
The parameter that we will constrain using RSD is the speed of sound of the clustering part of the dark fluid:
c2s(a)=
ΩΛ0c2∞ ΩΛ0+(1−c2∞)Ωm0a−3
, (6)
whereΩΛ0andΩm0indicate the “dark energy” and “dark matter” part of the dark fluid today,ais the
scale factor, and we define the parameterc∞as the value of the sound speed whena→ ∞. For more
details on this model and how we computed the growth factor, see [39].
4.2 DGP
In the Dvali-Gabadadze-Porrati (DGP, [41]) scenario, all matter and radiation are confined in a 4-D
brane in 5-D Minkowski space. The parameter we constrain is the cross-over scalerc, above which
gravity propagates into the extra dimension.
In these models the Friedmann equation is modified as:
H2±H rc
= 8πG
3
ρ¯
m+ρde. (7)
The sign on the left-hand-side identifies two models: when the sign is negative we have the so called
accelerating branch, that exhibits an accelerated expansion of the Universe at late times without the
need of dark energy [42]. The case with the positive sign (normal branch) instead, does not yield
acceleration by itself. Given that the accelerating branch is in conflict with observations of the CMB and Supernovae (e.g., [43]), we consider a normal-branch DGP model including dark energy. For details on the model and how to compute the growth of structures in this case, see [11, 39].
4.3 Results
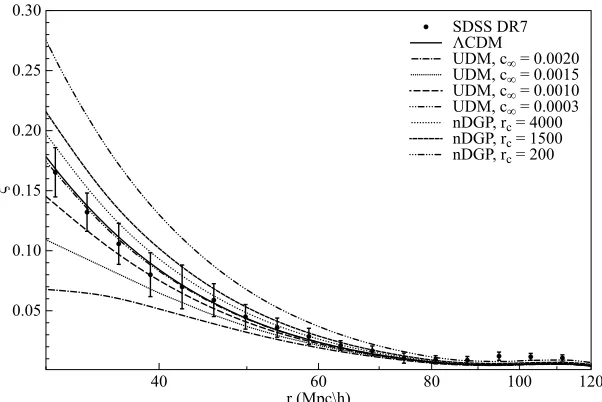
In Figure 2 we show the comparison of the correlation function measured from SDSS DR7 with
theoretical predictions for theΛCDM, UDM and nDGP models, for some values of the speed of sound
c∞(UDM) and the cross-over scalerc(nDGP). We performed a likelihood analysis, and we obtained
constraints for those parameters; to emphasize the power of RSD as a tool for testing models, it can be noted that we improved previous constraints of UDM models by two orders of magnitude, and we put constraints on nDGP for the first time. Full descriptions of the results can be found in [39].
5 Conclusions
We have seen that Redshift-Space Distortions can be used to test cosmological models, and presented a real data application of that.
SDSS DR7
ΛCDM
UDM, c∞ = 0.0020
UDM, c∞ = 0.0015
UDM, c∞ = 0.0010
UDM, c∞ = 0.0003
nDGP, rc = 4000
nDGP, rc = 1500
nDGP, rc = 200
ξ
0.05 0.10 0.15 0.20 0.25 0.30
r (Mpc\h)
40 60 80 100 120
Figure 2. Correlation function as measured from SDSS DR7 LRGs (points), compared with predictions from ΛCDM (solid line), UDM and nDGP models, for different values of their parameters (c∞andrcrespectively).
however, it will be necessary to support high precision observations with very detailed theoretical modeling. Here we showed some of the model improvements that will be necessary on very large
scales to allow tests of theΛCDM+GR paradigm of fundamental importance for our understanding
of the basic laws of nature.
Acknowledgments
Part of the research described in this paper was carried out at the Jet Propulsion Laboratory, California Institute of Technology, under a contract with the National Aeronautics and Space Administration. The author would like to thank O. Doré, N. Bartolo, D. Bertacca, C. Clarkson, R. Maartens„ S. Matarrese, W. Percival, D. Pietrobon, L. Samushia, F. Schmidt, for their contributions to the works on which this proceeding is based.
References
[1] R. Durrer, R. Maartens, Gen.Rel.Grav.,40, 301 (2008)
[2] B. Jain , P. Zhang, Phys Rev D,78, 063503, (2007)
[3] Y.-S. Song , K. Koyama, JCAP,01, 048, S (2009)
[4] Y.-S. Song, W. J. Percival , JCAP,0910, 004, (2009)
[5] G. R. Dvali, G. Gabadadze, M. Porrati, Phys. Lett., B,484, 112, (2000)
[6] S. M. Carroll, V. Duvvuri, M. Trodden, M.S. Turner, Ph Rv D,70, d3528C (2004)
[7] C. H. Brans, arXiv:gr-qc/0506063, (2005)
[8] L. Samushia, W.J. Percival, A. Raccanelli, MNRAS,420, (2102)
[10] D. Bertacca, N. Bartolo, S. Matarrese, Advances in Astronomy, 904379 (2010)
[11] F. Schmidt, Phys Rev D,80, 12, (2009)
[12] A. Raccanelli, G.-B. Zhao, D. J. Bacon,et al., Mon. Not. R. Astron. Soc.424, 801 (2012)
[13] N. Kaiser, MNRAS,227, 1 (1987)
[14] A. J. S. Hamilton, astro-ph/9708102 (1998)
[15] E. Linder, 2005, PRD,72, 043529
[16] E. Linder, Astropart. Phys.,29, 336 (2007)
[17] L. Guzzo et al., Nat.,541, 451 (2009)
[18] J.A. Peacock, et al., Nature,410, 169 (2001)
[19] W. J. Percival et al., MNRAS,385, L78 (2004)
[20] M. Tegmark et al., PRD,74, 123507 (2006)
[21] T. Okumura et al., ApJ,676, 889 (2008)
[22] C. Blake et al., MNRAS,415, 2876 B (2011)
[23] A. G. Sanchez, et al., arXiv:1203.6616 (2012) [24] L. Samushia, et al., arXiv:1210.2130 (2012) [25] B.A. Reid, et al., arXiv:1203.6641 (2012)
[26] A.S. Szalay et al., arXiv:astro-ph/9712007 (1997)
[27] T. Matsubara, arXiv:astro-ph/9908056 (1999)
[28] I. Szapudi, Astrophys. J.61451 (2004)
[29] P. Papai, I. Szapudi, arXiv:0802.2940 (2008)
[30] A. Raccanelli et al., MNRAS,409, 1525 (2010)
[31] J. Yoo, Phys. Rev. D82083508 (2010)
[32] C. Bonvin, R. Durrer, Phys. Rev. D84, 063505 (2011)
[33] A. Challinor, A. Lewis, Phys. Rev. D84, 043516 (2011)
[34] J. Yoo et al., arXiv:1206.5809 (2012)
[35] D. Jeong D et al., Phys. Rev. D85, 023504 (2012)
[36] D. Bertacca et al., JCAP10, 025 (2012)
[37] M. Bruni, R. Crittenden, K. Koyama, R. Maartens, C. Pitrou and D. Wands, Phys. Rev. D85
041301 (2012)
[38] R. Maartens et al., arXiv:1206.0732v2, (2012) [39] A. Raccanelli et al., arXiv:1207.0500, (2012)
[40] D. Bertacca et al., JCAP03, 039 B (2011)
[41] G. Dvali, G. Gabadadze and M. Porrati, Physics Letters B,485, 208 (2000)
[42] C. Deffayet, Physics Letters B,502, 199 (2001)
[43] L. Lombriser et al., arXiv:astro-ph/0905.1112 (2009)