2868
Thyroid Disease Prediction Using Hybrid
Machine Learning Techniques: An Effective
Framework
Yasir Iqbal Mir, Dr. Sonu Mittal
Abstract: Thyroid disease (TD) is one of the most progressive endocrine disorders in the human population today. Prediction of the endocrine disease is a critical task in the field of clinical data analysis. Machine Learning (ML) has shown effective results in the decision making and predictions from the enormous data generated by healthcare domain. Various studies in the prediction of thyroid disease have given only a glimpse using machine learning algorithms. In this paper we have proposed three novel models based on the primary dataset collected from1464 Indian patients. In these models, we have compared top five ML algorithms (Support Vector Machine, Naïve Byes, J48, Bagging, Boosting) found during literature survey with the aim to design an effective framework for TD. We divided our experimentation in three parts: pathological observations, serological tests and combination of both these parameters. In the first model, we have achieved the highest accuracy of 98.56% with bagging on both parameters. In the second model that is based on pathological observations of the patient we have obtained the highest accuracy of 99.08 with SVM. In the third model, the highest accuracy of 92.07% was yielded by J48 classifier on the serological tests.
Index Terms: Bagging, Boosting, Classification, Machine learning, prediction model, SVM, thyroid disease. —————————— ——————————
1
INTRODUCTION
Thyroid Disease (TD) has become one of the most common endocrine disorders worldwide. Although the cause of TD is still unknown, however the symptoms of TD can be reduced if the illness is identified at an early stage. Recent survey conducted in India on TD reveals that approximately 42 million people are suffering from TD [1]. It is not easy to identify TD because of a variety of threatening factors such as high cholesterol, high blood pressure, unusual pulse rate and various other factors. Numerous data mining techniques have been applied in order to find out the seriousness of thyroid disease among Homosapiens. The significance of the disease is classified on the basis of many methods like Decision Tree [2], Naïve Bayes (NB) [3] and SVM [4]. Since the nature of the thyroid disease is complex and therefore, it is necessary to handle the disease very carefully. If not handled carefully the effect of the thyroid disease may cause several health problems or affect the normal functioning of thyroid gland. During previous years, numerous studies have been conducted to diagnose thyroid disease. Data mining combined with classification plays an important role in the prediction of TD and investigation of data The aim of writing this paper is to address the following questions aroused in mind after conducting literature survey on TD prediction.
1. What are various pathological and serological parameters of TD and why these parameters are necessary for building a classification model?
2. Is it possible to predict the TD of the patient based on pathological parameters only, i.e. the patient doesn‟t need to undergo for painful laboratory needle tests. Similarly, is it also possible to diagnose the TD based on serological parameters only, i.e. serological parameters comprise the values obtained from blood samples.
3. Since most of the researchers have conducted a research on UCI dataset. After properly analysing the UCI dataset, is it possible to design a new dataset with proper attributes related to TD.
4. Is it possible to collect the data from real world and build up the model for TD diagnosis?
The rest of the paper is structured as follows; Section 2 gives the literature review and section 3 backgrounds of the deployed methods. In sections 4, the methodology used, experimental setup, performance strategy used are mentioned. The results obtained during experimentation are shown in section 4. Lastly section 5th include summary of conclusion and future work.
2
LITERATURE
REVIEW
We have seen that data mining techniques are used in the prediction of accuracy related to TD [5]. Numerous methods have been used in the past for knowledge abstraction by using recognized techniques of data mining for TD prediction. In one research, data mining techniques were used for thyroid disease prediction. These methods use dataset from UCI repository, where features were extracted for disease prediction. The dataset with support vector machine (SVM), Decision Tree is used for classification, where data set was chopped for training and testing purpose. The highest accuracy was achieved by SVM with 99.63% accuracy [6]. In another research Hetal Patel [7] came to conclusion that multiclass classifier algorithm achieved the highest accuracy of 99.5%. The dataset was taken from UCI machine learning repository, which is free, public accessible for research purposes. Ataide et al. [8] proposed soft computing techniques for thyroid prediction. The results on the UCI data set showed that multilayer perceptron (MLP) yielded an accuracy of
————————————————
• Yasir Iqbal Mir, Assistant Professor, School of Computer and System Sciences, Jaipur National University, Rajasthan, India. E-mail: [email protected]
2869
97.4%. However, after feature extraction the same classifier shown an accuracy of 91.7% which is less than previous results. Yadav et al. [9] generated ensemble methods (bagging+boosting) for thyroid prediction after comparing bagging, boosting and stacking methods. The dataset was downloaded from UCI machine learning repository. During experimentation the author found the performance measure of ROC=98.5, MAE=0.49, RMSE=0.07 and RAE=37.83 and RRSE=51.93. Sidiq et al. [10] implemented Decision Tree, Naïve Bayes, SVM and K nearest neighbour (KNN) in anaconda. 10-fold cross validation method was used to guarantee results. After experimentation on UCI dataset, it was concluded that Decision Tree obtained the highest accuracy of 98.89 than other classification techniques. Razia et al.[11]employed SVM, Multiple Linear Regression, Naïve Bayes and Decision Tree on dataset collected from UCI. The results of these classifiers were compared and it was found that Decision Tree performed well and showed an accuracy of 99.23%. Deepita et al [12] concluded that the use Decision Tree showed better results during the prediction of various diseases. The decision trees showed an accuracy of 95% on thyroid data set downloaded from UCI, however both the SVM and artificial neural network (ANN) performed well and obtained an accuracy of 98.6%. Gurram et al. [13] compared logistic regression and SVM for thyroid disease prediction on the data set taken from UCI. The results showed that former performed well that latter and showed the accuracy of 98.82%. Shrivas et al. [14] used ensemble approach with forward and backward feature selection method for thyroid prediction on the thyroid dataset taken from UCI. The experiment was carried out in rapid minor tool with 70% of data for training and remaining 30% for testing purposes. The proposed ensemble model of Random Forest, Naïve Bayes and KNN achieved the accuracy of 97.61%. Ammulu K et al. [15] took hypothyroid data set from UCI machine learning repository and applied random forest classifier for thyroid prediction. The results generated in WEKA tool showed an accuracy of 70.51%. Agarwal et al. [16] proposed auto associative neutral network (AANN) on thyroid dataset. The data set collected from UCI was partitioned into 60-40% split for training and testing purpose. The resulting AANN approach yielded the accuracy of 95.1%.Mazin Abdul Rasool Hameed [17] used multilayer forward feed neural network trained by back propagation algorithm for prediction of thyroid disease. The neural network contained only one hidden layer with five neurons which showed the classification rate of 99.2%. The proposed neural network was designed and tested in MATLAB. The dataset was collected from real patients containing three attributes as T3, T4 and TSH. Mahurkar et al. [18] devised improvised k means algorithm for normalization of raw data. The normalised data set was fed to feed forward neural network, which achieved an accuracy of 98.21%. The data set collected from UCI contained 215 instances. Dewangan et al. [19] developed classification and regression tree (CART) on the UCI thyroid data set. Initially info gain and gain ratio feature selection techniques were used with CART as base classifier. After comparison of feature selection techniques with CART as classification model, the best classifier (CART-info gain) achieved an accuracy of 99.47%. Bekar et al. [20] compared the performance of various decision algorithms to find out best algorithm for thyroid prediction. The data set was collected from a general surgeon working at hospital (not mentioned). After experimentation it was concluded that Naïve Bayes tree
showed the top accuracy of 75%.Ionitaet al [21] compared radial basis function, Naïve Bayes, multi-layer perception and decision tree classifiers to find out the best classifier for thyroid prediction. The data set used to test and validate the classifiers was taken from the website containing Romanian data and UCI machine learning repository. During experimentation it was shown that decision tree showed the best accuracy of 97.35% with removal of three attributes in data set. Dash et al. [22] proposed Naïve Bayes classifier by using ranker search as feature optimization technique for thyroid disease prediction. The dataset obtained from UCI repository was trained and tested by 10 fold cross validation. The results achieved an accuracy of 95.38%.As shown above, ensemble learning techniques are the most popular and effective machine learning methods used to diagnose TD. However, few studies have been conducted for using ensemble methods to diagnose TD. Ensemble learning methods are effective in diagnosing TD [23]. Ensemble methods are effective in diagnosing TD as they combine the results of several classifiers into one prediction model [24]. Ensemble methods are also known as meta-algorithms that reduce variance and bias to improve the results. It has been also seen that most of the researchers have taken data set from UCI machine learning repository [25] in the field of thyroid disease prediction. The main objective of our research is to predict the thyroid disease of the real world patients. The data set present in the UCI is outdated because the data set was donated to UCI on 1st of January 1987 with plenty of missing values. We have discussed the parameters of the UCI dataset with the endocrine specialist working at Jaipur National University institute for medical sciences and research centre (JNUIMSRC) in India and we came up with conclusion that the data set doesn‟t meet the standards to predict the thyroid disease. In this work, we introduce a new dataset containing the pathological observations and the serological tests of the real patients
3
BACKGROUND
A SUPPORT VECTOR MACHINE:
This section gives the description of SVM. Complete details of the SVM can be found in literature [26]. SVM helps the researchers in performing the analysis in a precise way. SVM is the discriminative algorithm, whose output is hyper plane which is used to categorize the new classes. This hyper plane in two dimensional classes is a line splitting a plane in binary parts. A single hyper plane or multiple planes can be created by SVM in the high dimensional space. Support vectors are those instances which are close to maximum-margin hyperplane.
The training points in SVM are represented
R S
1, 1 ,
R
2, 2
S
.,{
RN SN
,
)
(1)
In the equation (1), Ri is K-dimensional space vector and Si represents the class to which a given vector is belonged The division of training data by the hyper plane is denoted by the general form
2870
illustrated by following equations
W R
*
B
1
(3)W R
*
B
1
(4)The main benefit of the SVM is that it avoids the over fitting of data and increases the prediction accuracy [27].
B DECISION TREE
A decision tree contains 3 nodes i.e. root node, internal node and leaf node. The internal node performs test on given attribute, based on the test the classes are assigned to leaf nodes. The root node stays on the top of the decision tree. Decision trees have the ability to handle high dimensional data easily [28]. The most popular algorithms in decision trees C4.5 and ID3. Researchers have been using decision trees widely in the healthcare domain particularly to predict thyroid disease. One of the main advantages of the decision tree is that it is easy to implement and interpret, with no complex formulae and easy maths.
C NAÏVE BAYES
Naïve is one of the most scalable and proficient algorithm in data mining techniques. The Naïve Bayes is known as eager learner because they have the capability of building a model immediately after a training set is given. Naïve Bayes classifier is based on Bayes theorem based on conditional probability. Naive Bayes theorem is stated as
|
|
/
P Cj d
P d Cj P Cj
P d
(5)In the equation (5), P(Cj|d) denotes the probability of instance „d‟ being in class Cj. P(d|Cj) denotes the probability of generating instance „d‟ given a class Cj. P(d) denotes the probability of instance ‟d‟ occurring. The main advantage of Naive Bayes is that it trains and classifies instances faster and is not sensitive to irrelevant features.
D BOOSTING
Boosting is one of the Meta learning algorithms which focuses on reducing bias. It has the capability of turning weak learners into strong ones. In boosting, the resulting models built, depend on the performance of past built models. During the process of boosting, the machine learning algorithm looks for to find misclassified instances, applies extra weights on each of the misclassified instances and then builds the fresh training data set for new model. During this process the new model built on fresh training data set becomes expert for misclassified instances
E BAGGING
Bagging is used in statistical classification and regression that improves the stability and the accuracy of deployed machine learning algorithm. Bagging is very useful in avoiding over fitting and reduces variance. Bagging uses the model averaging approach for predicting the results. In this process the data set is chopped into various data sets, then machine learning algorithm is applied on these chopped data sets. The results of each dataset is combined by averaging the results.
4
METHODOLOGY
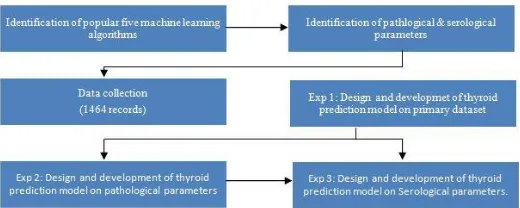
The achievements of this study are as follows:
First, in order to predict the thyroid disease of the patients, we collected the dataset from hospital which includes both pathological observations of the patient related to TD and serological laboratory tests.
1. We applied five popular classification algorithms including ensemble methods on the dataset collected with the aim to find out the best classifier to predict TD.
2. We separated dataset of pathological observations of the patient related to TD, applied ML algorithms with the aim to find out the best classifier because in this case the patient doesn‟t need to go for laboratory needle tests.
3. We also came up with the best model among five ML algorithms than can predict TD based on serological tests only.
Fig. 1. Proposed Flow diagram
4.1 Data Description
The dataset deployed in this research is the primary dataset that was collected at Sawai Man Singh (SMS) hospital at Jaipur India. The data was collected by using pre-designed questionnaire. The attributes in our dataset were finalized with the help of thyroid medical expert. The records were created in Microsoft excel 2019 in comma delimited file (CSV) format and then were converted into WEKA format. The complete details of the records collected are shown in Table 1. The dataset contains 1464 instances with 21 attributes and a multi-class attribute. The dataset comprises the combination of eighteen pathological and three serological attributes. The multi-class attribute is having three possible values (NORMAL for normal, HYPER for hyperthyroidism, HYPO for hypothyroidism). The complete description of the dataset is given in Table 2. The reason for selecting the primary dataset is because the UCI dataset is outdated as the dataset was collected in 1987 and donated to the University of California by Ross Quinlan during his visit for workshop on machine leaning. The dataset in the UCI has many missing values which leads in decrease of performance of ML classifiers. Therefore there was a strong need for primary dataset.
TABLE1
DISTRIBUTION OF INSTANCES IN DATASET
Males
Females
Total
Pregnant Non-Pregnant
Normal Hyper Hyp
o Normal Hyper Hyp
o Normal Hyper Hyp
o
192 199 201 90 90 90 207 199 196 1464
TABLE2
DESCRIPTION OF THE PRIMARY DATASET Attribute
name type Description Values
Value type
Age Pathologic Patient age in years 18-90 Numeric
2871 Pregnant Pathologic Is patient pregnant YES, NO, NA Nominal
Trimester Pathologic Division of duration of pregnancy
1ST, 2ND, 3RD,
NA Nominal
Goitre Pathologic Swelling in front of
neck YES, NO Nominal
Smoker Pathologic Does patient smoke YES, NO Nominal
Hair loss Pathologic Patient having hair
fall problem YES, NO Nominal
Constipatio
n Pathologic
Difficulty in emptying
bowels YES, NO Nominal
Diarrhoea Pathologic Watery bowel
movements YES, NO Nominal
History Pathologic Family history YES, NO Nominal
Nervousne
ss Pathologic
State of being
nervous YES, NO Nominal
Skin Pathologic State of the skin NORMAL,
ABNORMAL Nominal
Menstrual
bleeding Pathologic
State of the menorrhagia
NORMAL, ABNORMAL,
NA
Nominal
Feeling
tired Pathologic
Patient feels tired all
time YES, NO Nominal
Sleepiness Pathologic Patients is having sound sleep or not
NORMAL, LESS,
MORE Nominal
Weight Pathologic State of the body weight
NORMAL, LOSS,
GAIN Nominal
Heart rate Pathologic Speed at which heart beats NORMAL, LOW, HIGH Nominal
Body temperat
ure
Pathologic Temperature of the body
NORMAL, LOW,
HIGH Nominal
T3 Serologic Lab report for T3 2.7-5.27 pg/ml Numeric
T4 Serologic Lab report for T4 0.78-2.19 ng/dl Numeric
TSH Serologic Lab report for TSH 0.465-4.68 u/ml Numeric
Class Diagnosis of
disease
NORMAL, HYPER, HYPO
4.2 Experimental setup
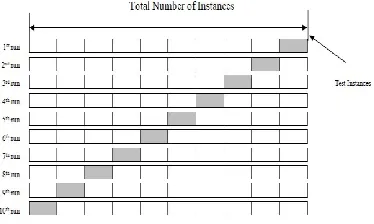
The classification models were implemented in WEKA (Waikato Environment for Knowledge Analysis) which is available from http://prdownloads.sourceforge.net/weka/weka-3-8-3-corretto-jvm.dmg.WEKA was developed at university of Waikato and it is one of the most popular machine learning software. The experiment was implemented in MAC operating system with 1.8 GHz intel core i5 processor and 8 GB of RAM. In order to get fair results, we have used K-fold cross validation [29] to evaluate the performance of methods used. The 10-fold cross validation process in illustrated in Figure 2. The dataset was divided into 10 subsets, each iteration, one of the test subsets was applied to the test set and other nine subsets were used for training. At last, the average of the classification accuracy was calculated. The main advantage of this method is that all the test sets are evaluated independently thereby improving the authentication of results.
Fig. 2. Illustration of 10 fold cross validation
4.3 Performance Metrics
The performance of the deployed methods were calculated using classification accuracy, true positive rate (TP), false positive rate (FP), precision, recall and receiver optimization curve (ROC). ROC shows the ability of the ML classifier diagnosis at various threshold values. The area under the curve depicts accuracy of test dataset. The ROC area of 1 in test dataset means perfect test. ROC of 0.5 is considered to be worst test. TP represents the number of TD patients correctly classified and FP denotes the number of TD patients incorrectly classified as healthy patients.
The accuracy, precision, recall, TPR and FPR are defined as follows
/
accuracy
TP TN TP FP FN TN
(6)precision TP TP FP
/
*100%
(7)/
*100%
recall
TP FN TP
(8)
/
*100%
specificity TPR
TP FN
TP
(9)
/
*100%
sensitivity FPR
FP TN
FP
(9)5
EXPERIMENTAL
RESULTS
5.1 Experiment A: Development and comparison of decision support system on primary dataset
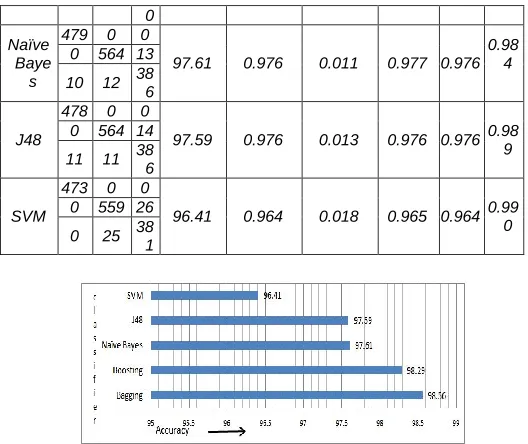
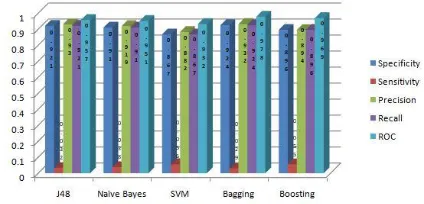
In the first experiment we have applied Naïve Bayes, J48, SVM, vote, bagging and boosting algorithms to predict the chances of TD of patients. The dataset used in this experiment contains all the 21 attributes. The classifiers which achieved highest accuracy of 98.56% was bagging, followed by boosting, SVM, Naïve Bayes, j48, and SVM which achieved an accuracy of 98.28%, 97.61%, 97.59%, 96.41% respectively. To guarantee the validation of results, we have used 10-fold cross validation method. The confusion matrix with different performance measures of deployed classifiers are shown in Table 3. Seven TD patients were misclassified as healthy controls; six TD patients were misclassified as hyperthyroidism patient while as hypothyroidism. As shown, bagging outperformed with the other four models in terms of accuracy, sensitivity, specificity, precision and recall. The average specificity was higher over tenfold cross validation was 0.986 while those of boosting, naïve Bayes, J48 and SVM were approximately 0.983, 0.976, 0.976 and 0.964 respectively. This indicates that the bagging classifier is significantly more effective in TD prediction. The comparison of accuracy obtained on the deployed classifiers is shown in Figure 3 whereas the comparison of performance metrics of deployed classifiers is shown in figure 4
TABLE3
PERFORMANCE MEASURE ON PRIMARY DATASET
Classifi er
Confusion Matrix
Accurac y
Specificit y
Sensitivit y
Precisi on
Rec-all
RO C
Baggin g
481 0 0
98.56 0.986 0.007 0.986 0.986 0.996 0 571 8
7 6 39
1
Boosti ng
479 0 0
98.29 0.983 0.007 0.983 0.983 0.999 0 570 13
2872 0
Naïve Baye s
479 0 0
97.61 0.976 0.011 0.977 0.976
0.98 4 0 564 13
10 12 38
6
J48
478 0 0
97.59 0.976 0.013 0.976 0.976 0.98
9 0 564 14
11 11 38
6
SVM
473 0 0
96.41 0.964 0.018 0.965 0.964 0.99
0 0 559 26
0 25 38
1
Fig. 3. Classifier performance with all features of dataset
Fig. 4. Classification performance comparison with all features
It reveals that the proposed bagging classifier has resolved the TD prediction problem more effectively than other four models and generates much more robust results
.
5.2 Experiment B: Development and comparison of decision support system on pathological parameters of primary dataset
In the second experiment we have developed a model which is able to predict TD of patient based on symptoms of the patient. The main objective of the proposed model is that the patient doesn‟t need to undergo blood tests. We have removed the clinical parameters in our dataset (T3, T4, TSH) resulting the dataset comprised of eighteen non-clinical features only. Pathological features are those which comprise the symptoms of the patient related to particular disease. The performance metrics and confusion matrix of deployed classifiers are shown in Table 4. It can be seen that fourteen patients were misclassified hyperthyroidism patients. As shown SVM showed best performance than other classifiers in terms of accuracy, specificity, sensitivity and precision. The average specificity was highest over tenfold cross validation was 0.991 while those of boosting, bagging, Naïve Bayes and J48 were approximately 0.990, 0.988, 0.981 and 0.981 respectively. This indicates that SVM is more effective in TD prediction than other four models. The comparison of accuracy obtained is shown in Figure 5 whereas the comparison of performance metrics of deployed classifiers is shown in figure 6.
TABLE4
PERFORMANCE MEASURE ON PATHOLOGICAL PARAMETERS OF THE
DATASET Classifi
er
Confusion Matrix
Accurac y
Specificit y
Sensitivit y
Precisio n
Rec-all ROC
SVM
483 0 0
99.08 0.991 0.006 0.991 0.99
1 0.99
4 0 574 0
0 14 39
3
Boosti ng
488 0 0
99.04 0.990 0.005 0.990 0.99
0 0.998 0 571 7
0 14 39
3
Baggin g
488 0 0
98.83 0.988 0.007 0.989 0.98 1.000
4 571 7
0 7 39
1
Naïve Baye s
488 0 0
98.83 0.988 0.005 0.989 0.98
8 1.000 0 563 15
0 2 39
6
J48
488 0 0
98.56 0.981 0.010 0.981 0.98
1 0.997 4 568 6
0 11 38
7
Fig. 5. Classification performance comparison with all features
Fig. 6. Classifier performance with pathological features of
dataset
This reveals that proposed SVM has resolved the TD prediction problem more effectively than other four models and generates much more robust results
5.3 Experiment C: Development and comparison of decision support system on serological parameters of primary dataset
2873
Bayes and SVM which obtained the accuracy of 91.53%, 90.08%, 88.93% and 86.68% respectively. The confusion matrix and detailed performance measures of the five classifiers are shown in Table 5. As shown, four patients were misclassified as hyperthyroid patient, twenty two were misclassified as hypothyroid patients, however both of them belonged to healthy control. Two hypothyroid patients were misclassified as hyperthyroid patients. Eighty seven hyperthyroid patients were misclassified as hypothyroid patients. J48 classifier outperformed with other four methods in terms of accuracy, specificity, sensitivity, precision and recall. The average specificity was higher over tenfold cross validation was 0.921 while those of bagging, naïve Bayes, boosting and SVM were approximately 0.915, 0.910, 0.889 and 0.867 respectively. The comparison of accuracy obtained with deployed classifiers is shown in Figure 6 whereas the comparison of performance metrics of deployed classifiers is shown in figure 7.
Fig. 7. Classifier performance with serological features of
dataset
TABLE5
PERFORMANCE MEASURE ON SEROLOGICAL PARAMETERS OF THE
DATASET Classifi
er
Confusion Matrix
Accurac y
Specificit y
Sensitivit y
Precisio n
Rec-all ROC
J48
487 0 0
92.07 0.921 0.032 0.930 0.92
1 0.957 4 487 87
22 2 37
4
Baggin g
488 0 0
91.53 0.915 0.036 0.922 0.91
5 0.973 6 487 85
22 11 36
5
Naïve Baye
s
488 0 0
90.98 0.910 0.038 0.919 0.91
0 0.951 8 484 86
38 0 36
0
Boosti ng
479 1 8
88.93 0.889 0.053 0.890 0.88
9 0.963 4 479 77
23 49 32
6
SVM
488 0 0
86.68 0.867 0.060 0.881 0.86
7 0.926 31 472 75
89 0 30
9
Fig. 8. Classifier performance with serological features of
dataset
As shown, we can find that the performance of J48 classifier is superior than bagging, naïve Bayes, boosting and SVM. This indicates that the proposed classifier has resolved the TD diagnosis more effectively than other four classifiers.
6
CONCLUSION
&
FUTURE
WORK
Based upon the experiments and results obtained we came up with the following answers that were aroused in the introductory part of this paper
1. We separately identified the pathological and serological parameters of TD with the help of endocrine specialist.
2. We developed the predictive model for TD diagnosis based upon the pathological parameters, serological parameters separately as well as by combining of both. 3. The first experiment concluded that bagging classification algorithm is best for predicting TD in case of all the features of the dataset. We may achieve the highest accuracy of 98.56% by bagging classifier. 4. The second experiment concluded that SVM
classification algorithm is best for predicting TD in case of pathological features of the dataset. We may achieve the highest accuracy of 99.08% by SVM classifier.
5. The third experiment concluded that J48 classification algorithm is best for predicting TD in case serological the features of the dataset We may achieve the highest accuracy of 92.07% by J48 classifier.
The conclusion discussed above are based upon the real life dataset that contains all the necessary attributes as defined in medical literature [30] [31]. In the future, the predicition techniques can be further improved by adding more instances to the dataset leading to more strong results. Furthermore, the model can be improved by applying various features selection algorithms to increase the performance of TD prediction.
7 ACKNOWLEDGMENT
The authors wish to thank the JNUIMSRC and SMS hospital for their support.
8
REFERENCES
[1] Unnikrishnan, Ambika Menon Usha. Thyroid disorders in India: An epidemiological perspective Review Article. Indian Journal of Endocrinology and Metabolism, Vol. 15, pp. 78-81, 2011.
2874
Information Technology and Computing, Vol. 9, Issue 1, pp. 15-20, 2018.
[3] Shrivas, A. K. Ambastha, Pallavi. An Ensemble Approach for Classification of Thyroid Disease with Feature Optimization. International Education and Research Journal, Vol. 3, Issue 5. pp. 112-113, 2017. [4] Mirza Shuja, Mittal Sonu, Zaman, Majid. Design and
Implementation of Predictive Model For Prognosis of Diabetes Using Data Mining Techniques. International Journal of Advanced Computer Research, Vol. 9, Issue 2. pp. 393-398, 2018.
[5] Roshan Banu D, K.C, Sharmili. A Study of Data Mining Techniques to Detect Thyroid Disease. International Journal of Innovative Research in Science, Engineering and Technology, Vol. 6, Special issue 11. pp. 549-553, 2017.
[6] Tyagi Ankita, Mehra Ritika. Interactive Thyroid Disease Prediction System Using Machine Learning Technique. 5th IEEE International Conference on Parallel, Distributed and Grid Computing, pp. 689-693, 2018.
[7] Patel Hetal. An Experimental Study of Applying Machine Learning in Prediction of Thyroid Disease. International Journal of Computer Sciences and Engineering, Vol. 7, Issue 1, pp. 130-133, 2019. [8] Marrisa Lourdes De Ataide, Amita Dessai. Thyroid
Disease detection using Soft computing Techniques. International Research journal of Engineering and Technology, Vol. 6, Issue 5, pp. 8015-8016, 2019. [9] Yadav Dhyan, Pal Saurabh. To Generate an
Ensemble Model for Women Thyroid Prediction Using Data Mining Techniques. Asian Pacific journal of cancer prevention, Vol. 20, Issue 4, pp.1275-1281, 2019.
[10]Sidiq U, Aaqib, S.M, Khan, R.A. Diagnosis of Various Thyroid Ailments using Data Mining Classification Techniques. International Journal of Scientific Research in Computer Science, Engineering and Information Technology, Vol. 5, Issue 1, pp.131-136, 2019.
[11]Razia Shaik, Swathi Prathyusha, P, Krishna, N, Sumana, N. A Comparative study of machine learning algorithms on thyroid disease prediction. International Journal of Engineering & Technology, Vol 7, Issue 2.8. pp. 315-319, 2018.
[12]Deepika M, Kalaiselvi, K. A Empirical study on Disease Diagnosis using Data Mining Techniques. Second International Conference on Inventive Communication and Computational technologies.(ICICCT), Coimbatore, pp. 616-620, 2018.
[13]Gurram Deepthi, Rao, M. A. comparative study of support vector machine and logistic regression for the diagnosis of thyroid dysfunction. International Journal of Engineering & Technology, 2018, Vol. 7, pp. 326-328.
[14]Shrivas, A., Ambastha, P. An Ensemble Approach for Classification of Thyroid Disease with Feature Optimization. International Education and Research Journal, Vol. 3, Issue 5, pp.112-113, 2017.
[15]Ammulu, Venugopal. Thyroid Data Prediction Using Data Classification Algorithm. International Journal for
Innovative Research in Science & Technology, Vol. 4, Issue 2,pp 208-212, 2017.
[16]Komal Agrawal, Mradul Dhakar. International Journal of Advanced Research in Electrical, Electronics and Instrumentation Engineering, Vol. 6, Issue 4, pp. 2239-2247, 2017.
[17]Mazin Abdul Rasool Hameed. Artificial Neural Network System for Thyroid Diagnosis. Journal of University of Babylon, Vol. 25, Issue: 2 Pages: 518-528, 2017.
[18]Kunal K Mahurkar, D.P., Gaikwad. Normalization using Improvised K-Means applied in diagnosing thyroid disease with ANN. International Conference on Trends in Electronics and Informatics (ICEI),Tirunelveli, pp. 579-583, 2017.
[19]Amit Kumar Dewangan, Akhilesh Kumar Shrivas, Prem Kumar. Classification of Thyroid Disease with Feature Selection Technique. International Journal of Engineering and Techniques, Vol. 2, Issue 3, pp.128-131, 2016.
[20]Ebru Turanoglu Bekar, Gozde Ulutagay, Suzan Kantarci. Classification of Thyroid Disease by Using Data Mining Models. A Comparison of Decision Tree Algorithms, Oxford Journal of Intelligent Decision and Data Science, Vol.2, issue 2. pp. 13-18, 2016.
[21]Irina Ionita, Liviu Ionita. Prediction of Thyroid Disease Using Data Mining Techniques. BRAIN-broad research in artificial intelligence and Neuron science, Vol. 7, Issue 3, pp.115-124, 2016.
[22]Shreela Dash, M.N., Das, Brojo Kishore Mishra. Implementation of an Optimized Classification Model for Prediction of Hypothyroid Disease Risks. International Conference on Inventive Computation Technologies (ICICT). Coimbatore, pp. 226-229, 2016.
[23]Suman Pandey, Anshu Tiwari, Akhilesh Kumar Shrivas, Vivek Sharma. International Journal of Computer Science and Information Technologies, Vol. 6, Issue 3, pp. 2395-2398, 2015.
[24]Prema, N. S.,, Varshith V, Yogeswar J. Prediction of Diabetes using Ensemble Techniques. International Journal of Recent Technology and Engineering, Vol. 7, Issue-6S4. pp. 660-662, 2019.
[25]http://archive.ics.uci.edu/ml/datasets/thyroid+disease [26]N., Cristianini, J., Shawe Taylor. An Introduction to
Support Vector Machines and Other Kernel-Based Learning Methods, Cambridge, U.K Cambridge Univ. Press.2000.
[27]Vinod Chandra, S. S., H. S., Anand. Artificial intelligence and machine learning. PHI learning Private Limited, Delhi 110092, 2017.
[28]Jiawei Han, Micheline Kamber. Data Mining Concepts and Techniques. Simon Fazer University, 2001. [29]S. L. Salzberg. On comparing classifiers: Pitfalls to
avoid and a recommended approach. Data Mining Knowledge Discovery, Vol. 1, no. 3, pp. 317-328, 1997.
[30]https://www.cancer.org/cancer/thyroid-cancer.html last accessed on 12th of dec, 2019.