1681
Volume LXI 186 Number 6, 2013
http://dx.doi.org/10.11118/actaun201361061681
METAANALYSIS OF KETOSIS MILK INDICATORS
IN TERMS OF THEIR THRESHOLD ESTIMATION
Oto Hanuš, Marcela Vyletělová Klimešová, Gustav Chládek,
Petr Roubal, Růžena Seydlová
Received: July 3, 2013
Abstract
HANUŠ OTO, VYLETĚLOVÁ KLIMEŠOVÁ MARCELA, CHLÁDEK GUSTAV, ROUBAL PETR, SEYDLOVÁ RŮŽENA: Metaanalysis of ketosis milk indicators in terms of their threshold estimation. Acta Universitatis Agriculturae et Silviculturae Mendelianae Brunensis, 2013, LXI, No. 6, pp. 1681–1692 Real time analyses of main milk components are attended in milking parlours today. Regular day information without delay is advantageous. Farmers can know milk composition every day. They can calculate milk energy quotients, identifi ed subclinical ketosis in early lactation of dairy cows and thus improve ketosis prevention and avoid economical losses. Aim was to improve the estimation reliability of thresholds of milk indicators of energy metabolism for subclinical ketosis detection and its prevention support by metaanalysis. This can have higher result reliability than individual studies. Results of similar papers were analysed. These were focused on ketosis indicators in milk (acetone (AC) and milk energy quotients (fat/crude protein, F/CP; fat/lactose, F/L)) and their thresholds for subclinical ketosis. Methods for threshold derivation were specifi ed: – statistically to reference procedure; – calculation according to relevant data frequency distribution; – qualifi ed estimation; – combinations of mentioned procedures. This was as weight source. Variability in AC subclinical ketosis cut–off values was high (78.5%) and in ketosis milk quotients was low (from 5 to 8%). The value 10.57 mg.l−1 could be the validated estimation of milk AC cut–off limit for subclinical ketosis
identifi cation. Similarly the milk quotients F/CP and F/L 1.276 and 0.82. The F/CP F/L relationship is closer in 1st third of lactation (0.89; P < 0.001) than in whole lactation (0.86; P < 0.001). This could be one
of proofs of ability for subclinical ketosis identifi cation because the majority of cases occurs in early lactation. The improved estimations of thresholds of milk indicators in early lactation for subclinical ketosis can be used at this technological innovation. Combined use of both quotients could bring an improvement of regular diagnosis of subclinical ketosis.
dairy cow, health, individual milk sample, acetone, milk energy quotients, subclinical ketosis identifi cation, ketosis prevention
Ketosis as disorder of energy metabolism of mammal females reduces milk yield (Emanuelson and Andersson, 1986; Andersson, 1988; Gustafsson and Emanuelson, 1996; Duffi eld, 2000; Duffi eld et al., 2009) and reproduction performance of dairy cows (Fig. 1; Duffi eld, 2000; Gasteiner, 2000; Duffi eld et al., 2009). Animal can also die in this case.
Ketosis, milk yield and cow reproduction Ketosis can threaten milk quality in terms of its processing (Hanuš et al., 1993). This disorder occurrence is linked with higher levels of ketones in body liquids. Ketosis is caused by higher output of
nutrients due to lactation as compared to their lower input by feeding. Cow in early lactation (Wood et al., 2004; Manzenreiter et al., 2013) is not able to take into enough nutrients for its high milk yield. That is why ketosis rises especially in high yielding dairy cows (Januš and Borkowska, 2013).
breath, sweat and milk (Andersson and Lundström, 1984 a, b; Enjalbert et al., 2001). That is also reason why there are high positive correlations between blood and milk acetone (Steger et al., 1972; Andersson, 1984, 0.96; Andersson and Lundström, 1984 b, 0.88; Gravert et al., 1986, 0.98; Enjalbert et al., 2001, 0.96; all P < 0.001). This body fat destroying phenomenon can lead to reduction of liver metabolic function.
From hypothetical point of view this is possible to include ketosis (subclinical and clinical) into time row of production disorder occurrence in early lactation as possible consequence of postpartum paresis (of course in link with nutritional energy defi ciency) and possible cause of abomasum displacement (Geishauser et al., 1997 a, b), mastitis and placenta retention with other reproduction disorders (Duffi eld, 2000; Duffi eld et al., 2009; Fig. 1). Some of these negative health consequences are caused due to ketosis immunosuppression (Duffi eld, 2000; Gasteiner, 2000).
Especially subclinical ketosis identifi cation in practice is important for its prevention (Duffi eld, 2000; Gasteiner, 2000). There is possible hormonal treatment by insulin for cow health improvement (Gasteiner, 2000). For instance also the feeding of glucoplastic and hepatoprotective matters such as propyleneglycol, natriumpropionate, niacin, carnitine, lecithin, monensisn, sylimarin (Emery et al., 1964; Jagoš et al., 1991; Vojtíšek et al., 1991; Miettinen, 1995; Green et al., 1999; Gasteiner, 2000, 2003; Tedesco et al., 2004; Hanuš et al., 2001, 2011 a; Coskun et al., 2012) can help in prevention. That is why these methods are essential for improvement of milk quality, dairy cow health and reproduction.
Importance of ketosis investigation in milk Milk in contrast to blood or urine is very easy for the sampling. Ketones in milk (acetone and betahydroxybutyrate) are suitable for confi dent noninvasive monitoring and control of dairy cow
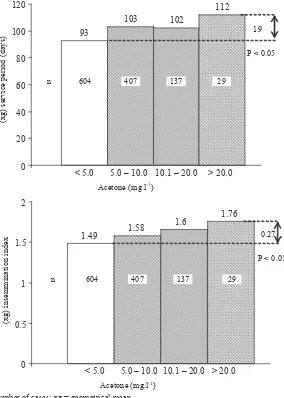
n = number of cases; xg = geometrical mean 93
103 102
112
0 20 40 60 80 100 120
< 5.0 5.0 – 10.0 10.1 – 20.0 > 20.0 Acetone (mg.l-1)
(xg) s
ervic
e peri
od
(da
ys
)
604 407 137 29
n
19
P < 0.05
1.49 1.58
1.6 1.76
0 0.5 1 1.5 2
Acetone (mg.l-1)
(xg) i
ns
emmi
nati
on in
de
x
604 407 137 29
n
< 5.0 5.0 – 10.0 10.1 – 20.0 > 20.0
0.27
P < 0.05
nutrition and health state. During ketosis (lack of energy, it means blood glucose defi ciency) milk fat content is increased due to body fat destroying and at the same time on the contrary the protein content is decreased (Diekmann, 1987; Geishauser and Ziebell, 1995; Steen et al., 1996; Hansen, 1999; Gasteiner, 2000; Hana et al., 2007; Siebert and Pallauf, 2010; van Knegsel et al., 2010; van der Dri et al., 2012).
The possibilities for identifi cation of subclinical ketosis are better step by step in dairy herds. The infrared spectroscopy with Fourier’s transformations (MIR–FT) which expands in laboratory practice makes possible regular determination of acetone in individual milk samples (Hansen, 1999; Heuer et al., 2000; de Roos et al., 2007; van Knegsel et al., 2010; Hanuš et al., 2011 a; van der Dri et al., 2012). Next possibility is investigation of milk ketones by stable tests (Geishauser et al., 1997 a; Hanuš et al., 1999; Carrier et al., 2004). Also changes in ratios of main milk components are usable in subclinical ketosis monitoring by calculation of ketosis milk quotients (fat/crude protein and fat/ lactose; Geishauser and Ziebell, 1995; Duffi eld et al., 1997; Steen et al., 1996; Gasteiner, 2000; Reist et al., 2002; van Knegsel et al., 2010; Siebert and Pallauf, 2010; Hanuš et al., 2011 b, 2013; Manzenreiter et al., 2013). These components are regularly monthly investigated during milk recording in laboratories with MIR and MIR–FT technology. There is also possibility of daily measurement of individual milk samples (NIR technology) in sophisticated milking parlours. Regarding mentioned facts especially this last possibility is advantageous.
Therefore, aim of this paper was to improve the estimation reliability of thresholds of main milk indicators of dairy cow energy metabolism for subclinical ketosis detection and its prevention support by metaanalysis method.
MATERIAL AND METHODS
Analytical viewpoint and newly created database
Metaanalysis combines and evaluates previously published results about same problem in statistical way. Is it one of proof in terms of scientifi c verifi cation hierarchy and in general very forceful verifi cation in biology. Metaanalysis can improve a quantitative estimation reliability of results and conclusions as compared to individual studies.
Scientifi c papers from last fi y years, which were specifi cally focused on evaluation of ketosis indicators in milk (such as acetone concentration and milk energy quotients (fat/crude protein, F/ CP; fat/lactose monohydrate, F/L (F, CP and L in %)) and their thresholds (for subclinical ketosis identifi cation), were studied and main results were collected and noted into newly created database (Tab. I and II). In case of necessity at using of various units of milk acetone concentration the
relevant values were recalculated (to mg.l−1) and thus
unifi ed. Database was completed by specifi cation of method for threshold derivation. There were more possibilities as follows (Tab. I and II): a) – statistically according to reference procedure results; b) – calculation according to principles of relevant data frequency distribution; c) – qualifi ed estimation according to frequency distribution of values or case study; d) – mutual combinations of previously mentioned procedures. This classifi cation was used also as weight (degree of importance) for data evaluation (w for a = 3, b = 1, c = 2 and d = 2).
Additional statistic evaluation of F/L ratio As additional evaluation to our previous results (Fig. 2) the energy milk coeffi cient F/L was calculated to originally introduced F/CP ratio in relevant data fi le under conditions which are briefl y described in Tab. I, II and by paper Hanuš et al. (2011 b). The relationship between them was studied.
Data statistical treatment in metaanalysis The mean values and their variabilities (sd) of acetone (AC) and log acetone (log AC), F/CP and
y = -0.1777x2 + 1.054x - 0.193 R2 = 0.7312
0.00 0.50 1.00 1.50 2.00
0.00 0.50 1.00 1.50 2.00 2.50
F/CP
F/
L
r = 0.8551 n = 960
y = -0.1219x2 + 0.8947x - 0.122 R2 = 0.7916
0.00 0.50 1.00 1.50 2.00
0.00 0.50 1.00 1.50 2.00 2.50
F/CP
F/
L
r = 0.8897 n = 329
2: Non-linear relationships between milk energy quotients F/CP (x axis) and F/L (y) during whole lactation and in the 1st third of lactation
Individual milk samples; clinical and superior subclinical mastitis free primiparous and multiparous dairy cows; breeds Czech Fleckvieh (CF) and Holstein (H); 3 herds CF, 3 herds H and 1 herd CF and H; summer and winter season; n = 960
(whole lactation) and 329 (1st third of lactation);
I: T he s urvey o f scientifi c sour
ces and r
es
ul
ts a
bout milk ac
et one (A C) c onc ent ra
tions and their thr
esholds f
or identifi
c
ation and di
ag nosis o f s ub clini cal k et osis o
f dairy c
ows
Literature source
Health and metabolic state of dairy cows and their environmental conditions
Declared milk AC
threshold (in mg.l −1) AC result in experiment, case study and fi
eld
observation,
x ± sd (in mg.l
−1) Number of cases (samples, cows),
n
Way of milk AC threshold derivation
Note Emery et al. , 1964 subclinical ketosis 17.4 – –
(a, w = 3)
acetone + acetacetate
Steger
et al.
, 1972
subclinical ketosis
(0.17 − 0.25, (0.21) mmol.l −1) 12.2
–
–
(a, w = 3)
acetone
Andersson, 1984, 1988
hyperketonemic cows
(0.4 mmol.l
−1) 23.2
48.7 ± 49.3
111
according to results of suspicious
animals (a, w = 3)
cows in 1
st 8 weeks of lactation
Andersson and Lundström, 1984 a
clinic healthy dairy cows
–
4.1 ± 4.6
328
–
cows in 1
st 8 weeks of lactation
Andersson and Lundström, 1984 b
hyperketonemic cows
–
18.6 ± 225.6
104
–
3
rd – 8 th lactation week
Andersson and Emanuelson, 1985 prevalence of hyperketonemie 8.9, 4.7, 1.1% in three months
23.2
–
3
087
accepted from literature and
confi
rmed by results (d (a and b), w = 2)
cows in 1
st 3 months of lactation,
Swedish dairy cows from 126 herds
Gravert
et al.
, 1986
cows with controlled nutrition and normal (commercial herds)
23.2
6.4 7.0 4.6
10 010 1 106 614
accepted from literature and
confi
rmed by results (d (a and c), w = 2)
according to breeds (H, F and Angler), cows in 1 st 4 months
of lactation
Vojtíšek, 1986
physiological with trend to physiolog. acetonemia
7–
–
accepted from literature and
confi
rmed by own experience (c, w = 2)
up to 10
th week a
er
calving
Diekmann, 1987
normal herds and herds with higher milk acetone content
(0.21 mmol.l
−1) 12.2
4.6 13.3
28 and 29
according to comparison of lactation
energy requirement and intake
(a, w = 3)
experience from advisory service about dairy cow nutrition and
health
Kvíz and Hofman, 1990
AC over physiological range
2 − 6 (4)
–
–
(c, w = 2)
experience from advisory service about dairy cow nutrition and
health Vojtíšek et al. , 1991 ketosis cows 7.9
20.1 ± 9.7 1.5 ± 0.4
48
(a, w = 3)
acetone + acetacetate, according
to experiment stadium
Gravert
et al.
, 1991
normal (commercial herds)
(0.25 mmol.l
−1) 14.5
17.4 ± 1.7
5
320
accepted from literature and
confi
rmed by results (d (a and c), w = 2)
H herds
Šrámek
et al.
, 1992
normal (commercial herds)
–
5.6 ± 4.5
3
724
–
individual milk samples, 1
st third
of lactation
Hanuš
et al.
, 1993
normal (commercial herds)
–
4.89 ± 3.5
358
–
bulk milk samples
Miettinen, 1994
4 healthy cows and 6 were overfed (20%) before calving and underfed
(25%) to induce ketosis
(0.05 mmol.l
−1) 2.9 3.9 ± 1.0 46.9 ± 17.3
172
from AC change induced by cow feeding towards ketosis (a, w = 3) individual milk samples, 6 – 64 days post partum, Finish Ayrshire cows
Gustafsson and Emanuelson, 1996
hyperketonemic cows
(0.7 mmol.l
−1) 40.7
–
11
690
according to milk losses (a, w = 3)
individual milk samples
Hanuš
et al.
, 1999
selection of healthy
problematic dairy cows
10
9.26 (± 13.31) > 6.36 (± 6.96);
6.01 > 4.41 xg
1 559 5 193 according to body condition losses, higher and lower (d (a and c), w = 2)
Literature source Health and metabolic state of dairy cows and their environmental conditions
Declared milk AC
threshold (in mg.l −1) AC result in experiment, case study and fi
eld
observation,
x ± sd (in mg.l
−1) Number of cases (samples, cows),
n
Way of milk AC threshold derivation
Note Hansen, 1999 hyperketonemic cows 40.7 – 5 8
from literature and confi
rmed
by
own analytical indirect and reference
method results (c, w = 2)
individual milk samples
Hanuš
et al.
, 2001
and 2011 a
selection of ketotic and healthy cows using rapid stable tests
5 and 7 (6)
44.2 ± 49.1 (19.5 xg)
76
according to stable test result (d (combination a and c), w = 2)
summer and winter threshold
Heuer
et al.
, 2001
7 cows were overfed (20%) before calving and 7 were fed according to requirements, group 1 had
higher body condition by 1
(0.3 mmol.l
−1) 17.4
26.1 ± 40.0
180
from literature and confi
rmed
by
own analytical indirect and reference
method results (c, w = 2)
from 1
st to 15 th week of lactation,
still good prediction
Hanuš
et al.
, 2003
normal (commercial herds)
–
2.29 : 2.21, xg; 1.99 : 1.9, xg; 2.16 : 1.99, xg; 2.44 : 1.25, xg 96 and 96; 96 and 96;
382 and 386; 94 and 98
–
individual milk samples (H and CF)
de Roos
et al.
, 2007
normal (commercial herds)
(0.15 mmol.l
−1) 8.7
8.5
1
080
from literature and confi
rmed
by
own analytical indirect and reference
method results (c, w = 2)
from 217 herds, early lactation,
multiparous dairy cows
van Knegsel
et al.
, 2010
selection of nonketotic and hyperketonemic cows
(0.07 mmol.l
−1) 4.06
–
618 milk samples, 69 dairy cows
diagnostic reference using plasma
BHB ≥ 1.2 mmol.l
−1 (a, w = 3)
individual milk samples, early
lactation
Sojková
et al.
, 2010 a
normal (commercial herds)
–
2.95 ± 5.5, 1.72 xg; 3.3 ± 4.34, 2.01 xg
234 and 224
–
individual milk samples, 1
st third
of lactation, higher and lower milk
yield (H)
Sojková
et al.
, 2010 b
normal (commercial herds)
–
2.61 ± 2.67, 1.76 xg; 2.63 ± 2.51, 1.67 xg
213 and 265
–
individual milk samples, fi
rst
third
of lactation, higher and lower milk
yield (CF)
Hanuš
et al.
, 2011 b
normal (commercial herds)
2.4 and 2.1 (H); 3.3 and 2.5 (CF); (2.6) 3.31 ± 5.38, 1.95 xg; 2.86 ± 3.91, 1.79 xg
327 and 960
according to F/CP (1.18 and 1.6)
threshold (a, w = 3)
individual milk samples,
1
st lactation and other lactations, st 1
third of lact. and whole lact.
(H and CF)
van der Dri
et al.
, 2012
normal (commercial herds),
11.2% hyperketonemia prevalence
AC no defi
ned,
only
as regression model with F/CP and AC
–
1
678
reference as plasma BHB ≥ 1.2 mmol.l
−1
cows between 5 and 60 days in milk, from 118 randomly
selected farms
A
C
= acet
one; BHB = b
et
a–hydr
o
xybuty
ra
te; H = H
ols
tein (Black Sp
ott
ed); F = Fleckvieh; CF = C
zec
h Fleckvieh; x ± sd = ari
thmeti
c mean ± s
tandar
d devi
ation; xg = g
eometri
c mean;
thr
eshold deri
va
tion: a) - s
ta tis ti call y accor ding t o r ef er ence pr o cedur e r esul
ts; b) - calcula
tion accor ding t o principles of relev ant da ta fr equency dis
tribution; c) - qualifi
ed es tima tion accor ding t o fr equency dis
tribution of v
alues or case s
tudy; d) - mutual combina
tions of pr
eviousl
y mentioned pr
o cedur es; this classifi ca tion w
as used as weig
ht for ev
alua
tion (w for
II: T he lis t o f r ese ar ch sour
ces and r
es
ul
ts a
bout milk k
et osis (ener gy) qu otient s (f at/cr ude pr ot
ein (F/CP) and f
at/lact
ose monohy
dra
te
(F/L)) and their cut
– off v alues f or inves tig ation o f s ub clini cal k et osis o
f dairy c
ows
Literature source
Health and metabolic state of dairy cows and their environmental conditions Declared milk ketosis quotient threshold Result in experiment, case study and fi
eld
observation, x ± sd
Number of cases (samples, cows)
n
Way of milk energy quotient
threshold derivation
Note
about F/CP:
Geishauser and Ziebell, 1995
27 DA case herds and 27 control
herds without DA
1.4
–
5
4
with DA the F/CP was higher than in
herds without DA (b, w = 1)
27 H herds
Duffi
eld
et al.
, 1997
prevalence of ketosis in early lactation (65 days) was 14.1% 0.75 CP/F = 1.33 F/CP
–
1
333
diagnostic reference using plasma
BHB ≥ 1.2 mmol.l
−1 (a, w = 3)
93 farms
Geishauser
et al.
, 1997 b
27 abomasum displacement (DA) case herds as ketosis consequence
1.4
–
2
7
F/CP ≥ 1.4 there was 8.6 time higher
likelihood for DA occurrence (b, w = 1)
milk tested 18 to 23 days
van Knegsel
et al.
, 2010
selection of nonketotic
and hyperketonemic cows
1.5
1.48 ± 0.09
618 milk samples, 69 dairy cows
diagnostic reference using plasma
BHB ≥ 1.2 mmol.l
−1 (a, w = 3)
individual milk samples,
early lactation
Siebert and Pallauf, 2010
normal (commercial herds)
1.5 and 1.33
1.22 ± 0.2
104
167 (H)
literature reference and statistical
derivation (b, w = 1)
52 farms
Hanuš
et al.
, 2011 b
normal (commercial herds)
1.32 and 1.42 (H); 1.27 and 1.52 (CF);
(1.38)
1.21 ± 0.31; 1.19 ± 0.27
327 and 960
according to AC (10 mg.l
−1) threshold
(a, w = 3)
individual milk samples,
1
st lactation and other lactations, st 1
third of lact. and whole lact.
(H and CF)
Manzenreiter
et al.
,
2013
control and ketosis cows
1.33 (F)
1.28 and 1.47 (F); 1.38 and 1.67 (H)
932 cases, 629 F cases;
1
372 ketose and 144
643
milk control cases (F)
according to veterinary doctor
acetonemia diagnosis and literature
references (a, w = 3)
92% of k
et
osis cases in
1
st 100 lact
ation da
ys,
8
0% in 1
st 50 da
ys
about F/L:
Steen
et al.
, 1996
normal (commercial herds)
1.0
–
800 and 1
368
with increased AC decreased L and
stable CP (a, w = 3)
43 and 82 herds (lowland
and highland)
Reist
et al.
, 2002
high yielding dairy cows
1.0
–
9
0
estimation of energy balance by F/L
(a, w = 2)
from 1
st to 10 th week
of lactation (H)
Manzenreiter
et al.
,
2013
control and ketosis cows (groups)
0.9
0.87 and 0.99 (all
breeds)
932 cases, 629 F cases;
1
367 ketose and 144
238
milk control cases (F)
according to veterinary doctor
acetonemia diagnosis and literature
references (a, w = 3)
53 veterinary practice fi
elds
and
1
133 diagnosen for acetonemia
Hanuš
et al.
, 2013
normal (commercial herds)
0.84 and 0.85 (H); 0.84 and 0.87 (CF);
(0.85)
0.82 ± 0.31 (1
st third
of lactation); 0.80 ± 0.27
(whole lactation)
327 and 960
according to AC (10 mg.l
−1) threshold
(a, w = 3)
individual milk samples,
1
st lactation and other lactations, st 1
third of lact. and whole lact.
(H and CF)
F = f
at %; CP = crude pr
ot
ein %; L = lact
ose %; F/CP = f
at%/crude pr
ot
ein%; F/L = f
at%/lact
ose monohyd
ra
te%; DA = displaced a
b
F/L in individual milk samples and their estimated thresholds for subclinical ketosis were included into study from previous scientifi c papers. AC log transformation was used because of no normal frequency distribution of values in AC data fi les. Mentioned fact is typical for health milk indicators such as AC and somatic cell count (Hanuš et al., 1999, 2011 a, b). This treatment makes also possible to use the geometrical means in case of AC values. Specifi cally modifi ed version of metaanalysis was used for collected paper data treatment. In general, remote values were canceled in created data fi les on the basis of Grubbs’ test (5%) as step of metaanalysis limitation. Statistical parameters were calculated from newly created database. The regression analysis was used for evaluation of relationship between F/CP and F/L. The Microso Excel was used for calculation and graphs.
RESULTS AND DISCUSSION
Milk acetone threshold for subclinical ketosis The results from various experiments, case studies and fi eld observations are shown in Tab. I. There are specifi ed conditions under which the relevant milk acetone thresholds for subcilinical ketosis identifi cation were obtained such as calculation according to reference procedure results including those which were derived from database or case study by qualifi ed estimation. Variability in professional AC subclinical ketosis cut–off values was high (Tab. I and III; vx cca 78%). As breed is mostly not signifi cant eff ect on milk acetone concentration in milked dairy cows (Hanuš et al., 2003, 2011 b; Sojková et al., 2010 a, b) and genetic eff ects as heritability and genetic variance on milk AC are low (Wood et al., 2004) so breeds were not included in evaluation separately.
According to here performed metaanalysis results (Tab. III and IV) this is possible to take into account the validated estimation of milk AC cut–off value for subclinical ketosis identifi cation 10.57 mg.l−1
(geometric mean of previous scientifi c estimations) in milk laboratory and recording system. Unglaub (1983) stated acetone physiological concentration and also its risk subclinical ketosis threshold 7 mg. l−1
for fi rst 10 weeks of lactation in German dairy cows. However, the historical variability about this threshold was stated from 2 to 41 mg.l−1 (from 0.03
to 0.7 mmol.l−1; Tab. I). This was stated using various
reference procedures. The highest cut–off limit was derived along defi ned decrease of milk yield in early lactation (Gustafsson and Emanuelson, 1996). However, both marginal values could be over– or undervalued. On the basis of previous results (Hanuš et al., 1999) it is possible to keep as threshold for subclinical ketosis estimation the values > 15 for milk ketones and > 10 mg.l−1 for acetone.
Nevertheless, most of studies described cut–off value from 7 to 23 mg.l−1 (from 0.12 to 0.4 mmol. l−1),
Gravert et al. (1986), Miettinen (1995) and Gasteiner
(2000). Despite it and also therefore, the metaanalysis of mentioned results (Tab. I) could be advantageous. In our previous papers (Hanuš et al., 2011 a, b) the winter and summer cut–off limits 10 and 7 mg.l−1
were used. Considering winter feeding of ketogenic roughage like silages and summer pasture and pertinent higher animal movement linked with it the used summer threshold was lower.
Under presupposition of acceptance of mentioned relationships (Andersson (1984, 1988), Andersson and Lundström (1984 a, b), Andersson and Emanuelson (1985) and Vojtíšek (1986)) it is possible to deduce that ratio between contents of acetone in milk and urine, which is determined by physiological–pathological principles and their mutual ratio combinations, could be cca from 1:10 to 1:35 in dependence on health state of organism. The mentioned fact is equal to 100 and 350 mg.l−1
of acetone in urine along limit of subclinical ketosis 10 mg.l−1 of milk acetone. Currently the
MIR–FT calibrations for milk ketones (acetone) determination are tested (van Knegsel et al., 2010). These would make possible regular AC monitoring. De Roos et al. (2006) evaluated the sensitivity (70%), specifi city (95%) and percentage of false positive (27%) and false negative (7%) fi ndings regarding method ability to identify subclinical ketosis of dairy cows on the basis of reading of acetone, acet– acetate and beta–hydroxybutyrate in individual milk samples using calibrated MIR–FT method (MilkoScan FT 6000).
Also Hansen (1999) carried out work about milk acetone and animal ketosis investigation using calibrated infrared spectroscopy on MIR–FT principle. He found out acceptable reliability for dairy cow classifi cation into two groups (healthy and suspected of ketosis) in samples which ranged from 0 to do 2.8 mM of acetone with determination coeffi cient 0.81 and rightness 0.27 mM. Similarly Heuer et al. (2001) who found out threshold for subclinical ketosis as value from 0.4 to 1.0 mM. In terms of reproduction performance the number of artifi cial inseminations per pregnancy increased by 0.14 for each unit increase in the natural logarithm to the concentration of acetone measured at fi rst artifi cial insemination (Waldmann et al., 2003).
Milk energy (ketosis) quotient thresholds for subclinical ketosis
2010 a, b), two main milked breeds (Fleckvieh (F) and Holstein (H)) were taken into account in this evaluation including Sweden red spotted. However H showed lower fat and also protein than F. That is why F/CP ration could be similar between H and F for the same degree of health state. So threshold evaluation was performed together (F and H). In spite of it there is still tendency to use a little bit diff erent values according to breed.
According to here performed metaanalysis results (Tab. III) this is possible to take into account the validated estimation of cut–off value to subclinical ketosis identifi cation of energy milk quotients as follows: for F/CP 1.276 (weighted value); for F/L 0.82 (weighted value). This could be important in milk laboratory and recording system. Of course, it can be important in current modern analytical systems as sophisticated milking parlours with real time measurement of milk composition as well.
Ketosis mainly (80%) occurs during the fi rst 50 days of lactation and about 35% of the positive diagnoses were made during the fi rst 10 days of lactation (Manzenreiter et al., 2013). It means that practical utilization of results from month sampling of milk recording is given because of fact that for 49% of the positively diagnosed dairy cows no milk recording (sampling) was conducted within a relevant time period before ketosis was diagnosed. Manzenreiter et al. (2013) estimated that only 30% of ketosis occurrence can be successfuly investigated under mentioned conditions. In practice there are o en missing the milk recording results in the important time of early lactation. It could be changed by daily milk composition analyses in modern sophisticated milking parlours with NIR technology.
Duffi eld et al. (2009) found signifi cant impact of hyperketonemia of dairy cows on their greater fat percentage and less protein percentage on fi rst test day in milk recording. A similar impact on milk composition stated previously also Geishauser and Ziebell (1995). The threshold value 1.5 for F/ CP quotient at subclinical ketosis was used by van Knegsel et al. (2010). On the other hand Duffi eld et al. (1997) reported 1.3. The sensitivity for diagnose of hyperketonemic dairy cows was 66%. This is lower as compared to milk beta–hydroxybutyrate and
acetone (80%) by MIR–FT with relevant cut–off values 23 and 70 μmol.l−1.
Steen et al. (1996) and Reist et al. (2002) found the reliability of F/L value (threshold 0.9) for subclinical and clinical ketosis identifi cation as more effi cient regarding F/CP value. Similar result was concluded by Manzenreiter et al. (2013). They found 66.7% of right diagnose in ketosis group and in control group 37.5% of F/L values were over 0.9 as false positive fi ndings. Considering ketosis diagnose it is too late at clinical signs occurrence. In terms of eff ective prevention and treatment, the diagnose of subclinical state is very important (Duffi eld et al., 1997; Duffi eld, 2000; Gasteiner, 2000; Hanuš et al., 2004, 2011 a, b). Part of ketosis prevention could be to indetify its subclinical period. Subclinical ketosis can threaten milk quality. That is why ketosis identifi cation methodical improvement is important.
Siebert and Pallauf (2010) mentioned the F/CP threshold reduction from 1.5 to 1.33. Therefore Manzenreiter et al. (2013) found 60.9% of right ketosis diagnose (F/CP over 1.33 in ketosis group) and in control group there was 38.5% of false positive fi ndings (no ketosis group with F/CP over 1.33 (Fleckvieh)). The diagnosis with F/CP 1.33 was better regarding 1.5. Also Hanuš et al. (2011 b) confi rmed F/CP threshold value 1.27 and 1.32 (fi rst third of lactation, fi rst lactation) and 1.52 and 1.42 (fi rst third of lactation, other lactations, Czech Fleckvieh and Holstein) using model regression calculation according to reference procedure (milk acetone).
Relationship between milk ketosis indicators F/CP and F/L
Because of possibility for simultaneous use of milk energy quotients (F/CP and F/L) as subclinical ketosis indicators the relationship between them was studied. Such type of evaluation has not been carried out up to now. In Fig. 2, there are two correlation indexes for 1st third of lactation and
whole lactation. There is possible to explain 79.2% of variability in F/L by variability in F/CP values in 1st third of lactation. These relationships are
logically closer due to use of the same fat values in calculation of both quotients. As far as the F/CP F/L
III: The results of metaanalysis of individual study results (from Tab. I and II) about milk ketosis indicators (acetone (AC) and energy quotients
(F/CP and F/L)) and estimation of their validated cut–off limits for possibility to investigate the subclinical ketosis of dairy cows
Milk indicator
Type of
evaluationOriginal n x ± sd vx
n a er Grubbs’
test
x ± sd vx
CI = sd × 1.64, one side limitation
(95%)
Validated estimation
of cut–off limit, x – CI
AC single 19 14.6 ± 11.4 78.1 19 14.6 ± 11.4 78.1 18.7 –
AC weighted 47 14.4 ± 11.3 78.5 47 14.4 ± 11.3 78.5 18.5 –
F/CP single 8 1.396 ± 0.071 5.1 8 1.396 ± 0.071 5.1 0.116 1.28
F/CP weighted 16 1.391 ± 0.07 5.0 16 1.391 ± 0.07 5.0 0.115 1.276
F/L single 4 0.938 ± 0.075 8.0 4 0.938 ± 0.075 8.0 0.123 0.815
F/L weighted 11 0.932 ± 0.068 7.3 11 0.932 ± 0.068 7.3 0.112 0.82
relationship is a little bit closer in 1st third of lactation
(Fig. 2; 0.89; P < 0.001) than in whole lactation (0.86; P < 0.001) this fact could be allowed to be one of proofs of ability for ketosis identifi cation in both indicators because of Manzenreiter et al. (2013) fi nding of majority of ketosis occurrence in early lactation. That result could be promising for future real time diagnostical systems in animal husbandry. Further, as it already has beeen mentioned, there was the much higher variability in scientifi c sources for proposed AC cut–off limits (Tab. I and III; from 78.5%) as compared to lower for F/CP and F/L quotient thresholds (Tab. II and III; from 5 to 8%). That is also reason, why geometric mean was used as estimation of milk AC cut–off limit in metaanalysis (Tab. I and IV). According to known information that fact is highly probable that F/L quotient is less susceptible to breed impact as F/CP. Therefore it is recommended to use F/CP cut–off value a little bit higher (by 0.02–0.05) for F and lower for H breed (Hanuš et al., 2011 b) than generally derived limit (Tab. III) in the practice diagnostical systems.
CONCLUSION
The methods of real time analysis of main milk components (fat, protein, lactose, solids non fat) and somatic cell count are introduced into milking
parlours in practice last time. This fact means that every day there is possibility for farmers to know milk composition, calculate milk energy quotients, investigate and identifi ed subclinical ketosis occurrence in early lactation of cows in their dairy herds and thus improve prevention against ketosis and avoid economical losses which are demonstrably linked with it. This all is possible to carry out with better effi ciency than previously because every day information is preferable as compared to month interval at regular milk recording and delay by 2 or 4 days from sampling to result obtaining. Higher operation possibility of this system is visible. The improved estimations of thresholds (acetone and F/CP and F/L quotient) of studied milk indicators in early lactation for subclinical ketosis by metaanalysis (10.57 mg.l−1
and 1.276 and 0.82) can be successfuly used at this mentioned technological innovation in animal production. Also combined use of both quotients could bring an improvement of regular diagnosis of subclinical ketosis. From research point of view as the high variability was in literature sources for proposed AC thresholds and low in F/CP and F/L quotient tresholds the metaanalysis cut–off value estimation is more important in AC case.
IV: The result of metaanalysis of individual study results (from Tab. I) about milk acetone (AC, in form log AC) and estimation of its validated cut–off limit for possibility to investigate the subclinical ketosis of dairy cows
Milk indicator Type of evaluation n log ACx ± sd AC xg as validated estimation of cut–off limit
AC single 19 1.035747 ± 0.357972 10.86
AC weighted 47 1.024048 ± 0.361384 10.57
Milk AC in mg.l−1; n = number of cases; xg = geometric mean.
SUMMARY
Real time analyses of main milk components and properties (fat, protein, lactose, solids non fat and somatic cell count) are attended in milking parlours today. Regular day information without delay is advantageous as compared to month interval of regular milk recording. Farmers can know milk composition every day. Therefore they can calculate milk energy quotients, investigate and identifi ed subclinical ketosis occurrence in early lactation of cows in their dairy herds and thus improve prevention against ketosis and avoid economical losses which are linked with it. Therefore, aim of this paper was to improve the estimation reliability of thresholds of main milk indicators of dairy cow energy metabolism for subclinical ketosis detection and its prevention support by metaanalysis. This method can have higher result reliability than individual studies. Results of papers, which were focused on mentioned topic, were collected, classifi ed and newly statistically analysed. There were scientifi c papers focused on evaluation of ketosis indicators in milk (acetone (AC) and milk energy quotients (fat/crude protein, F/CP; fat/lactose, F/L)) and their thresholds for subclinical ketosis. Methods for threshold derivation were specifi ed: – a) statistically according to reference procedure results; – b) calculation according to principles of relevant data frequency distribution; – c) qualifi ed estimation according to frequency distribution of values or case study; – d) mutual combinations of previously mentioned procedures. This classifi cation was used as weight for data (w: a = 3, b = 1, c = 2, d = 2). Modifi ed version of metaanalysis was used for data treatment. Remote values were canceled in created data fi les on the basis of Grubb’s test (5%). Variability in professional AC subclinical ketosis cut– off values was high (78.5%). This is possible to take the value 10.57 mg.l−1 as the validated estimation of
milk quotients was low (from 5 to 8%). This fact shows on particularity and scientifi c diffi cultness of subclinical ketosis defi nition. This is possible to take the values of milk quotients F/CP and F/L 1.276 and 0.82 as the validated estimations of cut–off limits to subclinical ketosis identifi cation. As far as the F/CP F/L relationship is closer in 1st third of lactation (0.89; P < 0.001) than in whole lactation (0.86; P < 0.001) this fact could be allowed to be one of proofs of ability for subclinical ketosis identifi cation because the majority of cases occurs in early lactation. The improved estimations of thresholds of studied milk indicators in early lactation for subclinical ketosis by metaanalysis can be used at technological innovation (milk recording and real time measurement systems) in animal production. Also combined use of both quotients (F/CP and F/L) could bring an improvement of regular diagnosis of subclinical ketosis.
Acknowledgement
This paper was supported by projects RO0513 from February 2013 and MSM 6215648905.
REFERENCES
ANDERSSON, L., 1984: Concentrations of blood and milk ketone bodies, blood isopropanol and plasma glucose in dairy cows in relation to the degree of hyperketonaemia and clinical signs. Zbl. Vet. Med., A 31: 683–693. ISSN 1439–0442.
ANDERSSON, L., 1988: Metabolic diseases of ruminant livestock. Subclinical ketosis in dairy cows. Food Anim. Pract., 4, 2: 233–251. ISSN 0749– 0720.
ANDERSSON, L., EMANUELSON, U., 1985: An epidemiological study of hyperketonaemia in Swedish dairy cows: determinants and the relation to fertility. Prev. Vet. Med., 3: 449–462. ISSN 0167– 5877.
ANDERSSON, L., LUNDSTRÖM, K., 1984 a: Eff ect of energy balance on plasma glucose and ketone bodies in blood and milk and infl uence of hyperketonaemia on milk production of postparturient dairy cows. Zbl. Vet. Med., A 31: 539– 547. ISSN 1439–0442.
ANDERSSON, L., LUNDSTRÖM, K., 1984 b: Milk and blood ketone bodies, blood isopropanol and plasma glucose in dairy cows, methodological studies and diurnal variations. Zbl. Vet. Med., A 31: 340–349. ISSN 1439–0442.
CARRIER, J., STEWART, S., GODDEN, S., FETROW, J., RAPNICKI, P., 2004: Evaluation and use of three cowside tests for detection of subclinical ketosis in early postpartum cows. J. Dairy Sci., 87: 3725–3735. ISSN 0022–0302.
COSKUN, B., INAL, F., GÜRBÜZ, E., POLAT, E. S., ALATAS, M. S., 2012: The eff ects of additional glycerol in diff erent feed form on dairy cows. Kafkas Univ. Vet. Fak. Derg., 18, 1: 115–120. ISSN 1300–6045.
DIEKMANN, L., 1987: Energiebilanz vor und nach dem Kalben. Tierzüchter, 2: 72–73. ISSN 0040– 7364.
DRIFT VAN DER, S. G. K., JORRITSMA, R., SCHONEWILLE, J. T., KNIJN, H. M., STEGEMAN, J. A., 2012: Routine detection of hyperketonemia in dairy cows using Fourier transform infrared spectroscopy analysis of -hydroxybutyrate and acetone in milk in combination with test-day
information. J. Dairy Sci., 95, 9: 4886–4898. ISSN 0022–0302.
DUFFIELD, T., 2000: Subclinical ketosis in lactating dairy cattle. Vet. Clin. North Am. Food Anim. Pract., 16: 231–253. ISSN 0749–0720.
DUFFIELD, T. F., KELTON, D. F., LESLIE, K. E., LISSEMORE, K. D., LUMSDEN, J. H., 1997: Use of test day milk fat and milk protein to detect subclinical ketosis in dairy cattle in Ontario. Can. Vet. J., 38: 713–718. ISSN 0008–5286.
DUFFIELD, T. F., LISSEMORE, K. D., Mc BRIDE, B. W., LESLIE, K. E., 2009: Impact of hyperketonemia in early lactation dairy cows on health and production. J. Dairy Sci., 92: 571–580. ISSN 0022– 0302.
EMANUELSON, U., ANDERSSON, L., 1986: Genetic variation in milk acetone in Swedish dairy cows. J. Vet. Med., A 33: 600–608. ISSN 1439–0442. EMERY, R. S., BURG, N., BROWN, L. D., 1964:
Detection, occurrence and prophylactic treatment of borderline ketosis with propylene glycol feeding. J. Dairy Sci., 47: 1074. ISSN 0022–0302. ENJALBERT, F., NICOT, M. C., BAYOURTHE, C.,
MONCOULON, R., 2001: Ketone bodies in milk and blood of dairy cows: relationship between concentrations and utilization for detection of subclinical ketosis. J. Dairy Sci., 84: 583–589. ISSN 0022–0302.
GASTEINER, J., 2000: Ketose, die bedeutendste Stoff wechselerkrankung der Milchkuh. In: BAL Gumpenstein Bericht. Viehwirtscha liche Fachtagung, 27: 11–18. ISSN 1026–6267.
GASTEINER, J., 2003: Der Einsatz glukoplastischer Verbindungen in der Milchviehfütterung. In: BAL Gumpenstein Bericht. Viehwirtscha liche Fachtagung, 30: 61–63. ISSN 1026–6267.
GEISHAUSER, T., LESLIE, K. E., DUFFIELD, T., EDGE, V., 1997 a: An evaluation of milk ketone tests for the prediction of le displaced abomasum in dairy cows. J. Dairy Sci., 80: 3188–3192. ISSN 0022–0302.
GEISHAUSER, T., ZIEBELL, K. L., 1995: Fett/ Eiweiss-Quotient in der Milch von Rinderherden mit Vorkommen von Labmagenverlagerungen. Dtsch. Tierärztl. Wschr., 102: 469–471. ISSN 0341– 6593.
GRAVERT, H. O., JENSEN, E., HAFEZIAN, H., PABST, K., SCHULTE–COERNE, H., 1991: Environmental and genetic eff ects on the acetone content in milk. Züchtungskunde, 63, 1: 42–50. ISSN 0044–5401.
GRAVERT, H. O., LANGER, R., DIEKMANN, L., PABST, K., SCHULTE–COERNE, H., 1986: Ketonkörper in Milch als Indikatoren für die Energiebilanz der Milchkühe. Züchtungskunde, 58: 309–318. ISSN 0044–5401.
GREEN, B. L., MC BRIDGE, B. W., SANDALS, D., LESLIE, K. E., BAGG, R., DICK, P., 1999: The impact of a Monensin controlled – release capsule on subclinical ketosis in the transition dairy cow. J. Dairy Sci., 83: 333–342. ISSN 0022–0302.
GUSTAFSSON, A. H., EMANUELSON, U., 1996: Milk acetone concentration as an indicator of hyperketonaemia in dairy cows: the critical value revised. Anim. Sci., 63: 183–188. ISSN 0021–8812. HANA, S. S., AYIED, A. Y., ABDULLRADA, A. J.,
2007: Eff ect of some environmental factors on milk acetone level and their relationship with milk yield and some contents. BasrahJ. Agric. Sci., 20, 2: 65–75. ISSN 1817–2695.
HANSEN, P. W., 1999: Screening of dairy cows for ketosis by use of infrared spectroscopy and multivariate calibration. J. Dairy Sci., 82: 2005– 2010. ISSN 0022–0302.
HANUŠ, O., BEBER, K., FICNAR, J., GENČUROVÁ, V., GABRIEL, B., BERANOVÁ, A., 1993: Relationship between the fermentation of bulk milk sample, its composition and contents of some metabolites. (In Czech) Czech J. Anim. Sci., 38: 635– 644. ISSN 1212–1819.
HANUŠ, O., FRELICH, J., KRON, V., ŘÍHA, J., POZDÍŠEK, J., 2004: The checking of the body condition score, health state and nutrition of dairy cows and improvement of their reproduction functions. (In Czech) Agricultural information, Zemědělské informace, Praha: UZPI Praha, 38. ISBN 80–7271–146–6. HANUŠ, O., FRELICH, J., ROUBAL, P., VORLÍČEK,
Z., ŘÍHA, J., POZDÍŠEK, J., BJELKA, M., 2003: Dairy cow breed impacts on some chemical-compositional, physical, health and technological milk parameters. (In Czech) Výzkum v chovu skotu / Cattle Research, XLV, 4: 1–10. ISSN 0139–7265. HANUŠ, O., GENČUROVÁ, V., ZHANG, Y.,
HERING, P., KOPECKÝ, J., JEDELSKÁ, R., DOLÍNKOVÁ, A., MOTYČKA, Z., 2011 a: Milk acetone determination by the photometrical method a er microdiff usion and via FT infra-red spectroscopy. J. Agrobiol., 28, 1: 33–48. ISSN 1803– 4403.
HANUŠ, O., CHLÁDEK, G., VYLETĚLOVÁ, M., SAMKOVÁ, E., FALTA, D., ROUBAL, P., SEYDLOVÁ, R., 2013: Analyse of relationships between some milk indicators of cow energy
metabolism and ketosis state. Anim. Sci. Pap. Rep., ISSN 0860–4037, in opponent procedure.
HANUŠ, O., SKYVA, J., FICNAR, J., JÍLEK, M., TICHÁČEK, A., JEDELSKÁ, R., DOLÍNKOVÁ, A., 1999: A notes to interpretation procedures of results ketone and acetone contents evaluation (Ketotest) in individual cow’s milk samples. (In Czech) Výzkum v chovu skotu / Cattle Research, XLI, 4: 17–34. ISSN 0139–7265.
HANUŠ, O., TRAJLINEK, J., HLÁSNÝ, J., GENČUROVÁ, V., KOPECKÝ, J., JEDELSKÁ, R., 2001: Ketosis problem, its diagnostic and monitoring. In Rearing and breeding of cattle for competitionable production: proceedings of the seminar VÚCHS Rapotín, (In Czech). Grafotyp Šumperk, 105–113.
HANUŠ, O., YONG, T., KUČERA, J., GENČUROVÁ, V., DUFEK, A., HANUŠOVÁ, K., KOPEC, T., 2011 b: The predicative value and correlations of two milk indicators in monitoring energy metabolism of two breeds of dairy cows. Sci. Agric. Boh., 42, 1: 1–11. ISSN 1211–3174.
HEUER, C., LUINGE, H. J., LUTZ, E. T. G., SCHUKKEN, Y. H., VAN DER MAAS, J. H., WILMINK, H., NOORDHUIZEN, J. P. T. M., 2000: Determination of acetone in cow milk by Fourier transform infrared spectroscopy for the detection of subclinical ketosis. J. Dairy Sci., 84: 575–582. ISSN 0022–0302.
HEUER, C., VAN STRAALEN, W. M., SCHUKKEN, Y. H., 2001: Prediction of energy balance in high yielding dairy cows with test-day information. J. Dairy Sci., 84: 471–481. ISSN 0022–0302.
JAGOŠ, P., ILLEK, J., SUCHÝ, P., 1991: Beziehungen zwischen Störungen im Energiestoff wechsel und der Milchzusammensetzung. Mh. Vet.–Med., 46: 698–699. ISSN 0026–9263.
JANUŠ, E., BORKOWSKA, D., 2013: Occurrence of ketone bodies in the urine of cows during the fi rst three months a er calving and their association with milk yields. Arch. Tierz., Dummerstorf, 56, ISSN: 003–9438, accepted, provisional pdf.
KNEGSEL VAN, A. T. M., DRIFT VAN DER, S. G. A., HORNEMAN, M., ROOS DE, A. P. V., KEMP, B., GRAAT, G. A. M., 2010: Ketone body concentration in milk determined by Fourier transform infrared spectroscopy: Value for the detection of hyperketonemia in dairy cows. J. Dairy Sci., 93: 3065–3069. ISSN 0022–0302. KVÍZ, J., HOFMAN, J., 1990: Metabolic profi le of
dairy cow and milk sample analysis. (In Czech) Náš Chov, 8: 364–373. ISSN 0027–8068.
MANZENREITER, H., FÜRST–WALTL, B., EGGER– DANNER, C., ZOLLITSCH, W., 2013: Zur Eignung des Gehalts an Milchinhaltsstoff en als Ketoseindikator. 40. Gumpenstein, Viehwirtscha . Fachtag., 9–19. ISBN 978-3-902559-93-7.
MIETTINEN, P. V. A., 1994: Relationship between milk acetone and milk yield in individual cows. J. Vet. Med., A 41: 102–109. ISSN 1439–0442.
fertility in Finnish dairy cows. Berl. Münch. Tierärztl. Wschr., 108: 14–19. ISSN 0005–9366.
REIST, M., VON EUW, D., TSCHUEMPERLIN, K., LEUENBERGER, L., CHILLIARD, Y., HAMMON, H. M., MOREL, C., PHILIPONA, C., ZBINDEN, Y., KUENZI, N., BLUM, J. W., 2002: Estimation of energy balance at the individual and herd level using blood and milk traits in high-yielding dairy cows. J. Dairy Sci., 85: 3314–3327. ISSN 0022–0302. ROOS DE, A. P. W., BIJGAART VAN DEN, H. J. C. M., HORLYK, L., JONG DE, G., 2007: Screening for subclinical ketosis in dairy cattle by Fourier transform infrared spectrometry. J. Dairy Sci., 90: 1761–1766. ISSN 0022–0302.
ŘÍHA, J., HANUŠ, O., 1999: The relationships between individual reproduction parameters and milk composition in fi rst 120 lactation days. Výzkum v chovu skotu / Cattle Research, XLI, 4: 3–17. ISSN 0139–7265.
SIEBERT, F., PALLAUF, J., 2010: Analyse von Ergebnissen der Milchleistungsprüfung in Hessen im Hinblick auf ein Ketoserisiko. Züchtungskunde, 82: 112–122. ISSN 0044–5401.
SOJKOVÁ, K., HANUŠ, O., ŘÍHA, J., GENČUROVÁ, V., HULOVÁ, I., JEDELSKÁ, R., KOPECKÝ, J., 2010 a: Impacts of lactation physiology at higher and average yield on composition, properties and health indicators of milk in Holstein breed. Sci. Agric. Boh., 41, 1: 21–28. ISSN 1211–3174.
SOJKOVÁ, K., HANUŠ, O., ŘÍHA, J., YONG, T., HULOVÁ, I., VYLETĚLOVÁ, M., JEDELSKÁ, R., KOPECKÝ, J., 2010 b: A comparison of lactation physiology eff ects at high and lower yield on components, properties and health state indicators of milk in Czech Fleckvieh. Sci. Agric. Boh., 41, 2: 84–91. ISSN 1211–3174.
STEEN, A., OSTERAS, O., GRONSTOL, H., 1996: Evaluation of additional acetone and urea analyses, and of the fat–lactose–quotient in cow milk samples in the herd recording system in Norway. J. Vet. Med., A 43: 181–191. ISSN 0931–184X.
STEGER, H., GIRSCHEWSKI, H., PIATKOWSKI, B., 1972: Die Beurteilung des Ketosisstatus laktieren der Rinder aus der Konzentration der Ketokörper im Blut und des Azetons in der Milch. Arch. Tierernähr., 22: 157–162. ISSN 0003–942X.
ŠRÁMEK, J., PINĎÁK, J., TICHÁČEK, A., HANUŠ, O., BEBER, K., KOPP, O., 1992: Organization technical and economical aspects of milk production for sucling and child nutrition. (In Czech) Final report, R 329–089, VÚCHS Rapotín.
TEDESCO, D., TAVA, A., GALLETTI, S., TAMENI, M., VARISCO, G., COSTA, A., STEIDLER, S., 2004: Eff ects of sylimarin a natural hepatoprotector, in periparturient dairy cows. J. Dairy Sci., 87: 2239– 2247. ISSN 0022–0302.
UNGLAUB, W., 1983: Untersuchung zur Bestimmung und zum Gehalt des Azeton in Milch. Tierärztl. Umsch., 41: 534–543. ISSN 0099– 2240.
VOJTÍŠEK, B., 1986: The determination of acetone in milk, colostrum, blood and urine of dairy cows by microdiff usion method. (In Czech) Veterinářství, 36: 394–396. ISSN 0506–8231.
VOJTÍŠEK, B., HRONOVÁ, B., HAMŘÍK, J., JANKOVÁ, B., 1991: Milk thistle (Silybum marianum) in feed rations administered to ketotic cows. (In Czech) Veter. Med. (Praha), 36: 321–330. ISSN 0375–8427.
WALDMANN, A., REKSEN, O., LANDSVERK, K., KOMMISRUD, E., ROPSTAD, E., 2003: Relationship between milk acetone at fi rst insemination and reproductive performance and fertility of Norwegian cattle. Repr. Dom. Anim., 38, 4: ESDAR, 363. ISSN 1563–2504.
WOOD, G. M., BOETTCHER, D. F., KELTON, D. F., JANSEN, G. B., 2004: Phenotypic and genetic infl uences on test-day measures of acetone concentration in milk. J. Dairy Sci., 87: 1108–1114. ISSN 0022–0302.
Address