Therapeutics and Clinical Risk Management
Dove
press
O R i g i n a l R e s e a R C h
open access to scientific and medical research
Open access Full Text article
low perfusion index affects the difference in
glucose level between capillary and venous blood
nurdan acar1
hamit Ozcelik1
arif alper Cevik1
engin Ozakin1
goknur Yorulmaz2
nur Kebapci2
Ugur Bilge3
Muzaffer Bilgin4
1emergency Department,
2endocrinology Department, 3Family Medicine Department, 4Biostatistics Department, Medical school, eskisehir Osmangazi University, eskisehir, Turkey
Aim: In emergency cases, finger stick testing is primarily used to check the blood glucose value of patients since it takes longer to obtain the venous value. In critical patients, under conditions that cause an increase in metabolic state and level of stress, there occurs considerable difference in glucose levels between capillary and venous measurements. This study aimed to investigate the comparability of capillary and venous glucose values, according to the perfusion index level obtained with the Masimo Radical-7® device, in critical patients aged 18 years and over.
Method: We conducted this prospective and observational study in the emergency department of the Eskisehir Osmangazi University hospital between November 3, 2008 and February 2, 2009.
Results: The blood glucose of 300 critical patients was checked by finger stick in the emergency unit. The participants with normal vital signs had perfusion index between 0 and 5; the results obtained by the two methods were more consistent for perfusion index values of 6 and over. The results were most consistent in aged participants with normal vital sign findings and low perfu-sion index and in young patients with high perfuperfu-sion index. In the cases where at least one of the vital signs was abnormal, the glucose values obtained by the two methods were more consistent when the perfusion index was 6 or over. In this group, independently from the perfusion index value, the consistency was higher in younger patients compared with aged patients.
Conclusion: In the emergency department, perfusion index value measured by Masimo Radical-7 and capillary blood glucose levels can serve in blood sugar management in critically ill patients.
Keyword: glucose, capillary, venous, perfusion index, Masimo Radical-7®
Introduction
In emergency cases, finger stick testing is primarily used to check the blood glucose value of patients. The value of glucose in the venous blood sample is taken into consideration to confirm the capillary blood glucose level. The capillary and venous glucose levels should be consistent with each other. In the case of an emergency, the treatment process starts in view of the capillary glucose value since it takes longer to obtain the venous value.
In critical patients, under conditions that cause an increase in metabolic state and level of stress, there occurs considerable difference in glucose levels between capil-lary and venous measurements. For instance, in the case of circulatory shock, tissue perfusion is impaired and glucose extraction increases.1 There is no clear informa-tion on whether the capillary blood glucose value according to the perfusion index obtained by a finger stick measurement is comparable with the venous value. Patients were determined to be “critical” if in triage category 1 (life-threatening or possibly life-threatening clinical condition [hemorrhagic shock, altered mental status, status epilepticus, diabetic ketoacidosis, ileus, etc]) or unstable/outside normal ranges or vital signs. Accepted values for normal limits of vital signs can vary in the literature and Correspondence: nurdan acar
emergency Department, Medical school, eskisehir Osmangazi University, Meselik 26480 eskisehir, Turkey
Tel 090 222 239 2979 ext 5182 email nn_ergun@yahoo.com
Journal name: Therapeutics and Clinical Risk Management Article Designation: Original Research
Year: 2014 Volume: 10
Running head verso: Acar et al
Running head recto: Low perfusion index affects glucose level DOI: http://dx.doi.org/10.2147/TCRM.S73359
Therapeutics and Clinical Risk Management downloaded from https://www.dovepress.com/ by 118.70.13.36 on 27-Aug-2020
For personal use only.
This article was published in the following Dove Press journal: Therapeutics and Clinical Risk Management
20 November 2014
Dovepress acar et al
at various hospitals.2–4 In close similarity to the literature, in our emergency department, we use the normal range for vital signs as systolic blood pressure 120–90 mmHg, pulse rate 60–100/min, respiration rate 12–16/min, body temperature 36.0°C–37.1°C, and oxygen saturation .94%.
The blood glucose value obtained by the finger stick measurement should normally be correlated with venous glucose level, with a maximum difference of 20%. However, conditions causing a circulatory disorder, primarily a shock, affect circulation to the fingertip. It is important to detect this condition through the perfusion index, measured by a non-invasive oximetry method, in order to see the comparability of these two types of blood glucose measurement.
Perfusion index is the ratio of the pulsatile blood flow to the nonpulsatile or static blood flow in peripheral tissues.5 Perfusion index may be derived from pulse oximetry, con-tinuously and noninvasively. The Masimo Radical-7® is a device measuring the perfusion index by pulse oximetry, continuously and simultaneously.5,6 The perfusion index is measured by a finger probe. The normal limits are not defined very well by the manufacturer. We accept the perfusion index value of 5 as the border for description of low or high (ie, 0–5 is low, .5 is high).
There is not much research on the comparability of capillary and venous glucose values according to the perfu-sion index level obtained with the Masimo Radical-7 in the emergency department.
aim
This study aimed to investigate the comparability of capillary and venous glucose values, according to the perfusion index level obtained by the Masimo Radical-7, in critical patients aged 18 years and over.
Method
This prospective and observational study took place in the emergency department of the Eskisehir Osmangazi University hospital between November 3, 2008 and February 2, 2009. After approval from the local board of ethics, the participating patients (or the relatives, for unconscious patients) provided their written consent to participate in the study. All patients in a critical state and aged 18 years and over, for whom finger stick testing was performed to check the blood glucose, were included in the study. The patients below 18 years, who did not give consent to participate in the study, or who did not need finger stick testing for blood glucose measurement were excluded from the study.
We first noted the age, sex, and vital signs (arterial blood pressure measured noninvasively, pulse rate, respiration rate, body temperature, and oxygen saturation) of the patients. The capillary glucose value was measured using the Abbott Optium Xceed blood glucose monitoring system and appropriate measurement sticks, when finger stick testing was required in clinical patients. Where indicated in these patients, the venous blood glucose value was measured. The Masimo Radical-7 was used to measure the perfusion index of patients.
The patients were categorized as “young” if they were between 18 and 65 years, and as “old” if they were over 65 years. We divided the patients by normal (systolic blood pressure 120–90 mmHg, pulse rate 60–100/min, respiration rate 12–16/min, body temperature 36.0°C–37.1°C, oxygen saturation .94%) and abnormal (results out of normal refer-ence range) vital signs. We also divided them by perfusion index: those with low (0–5) and high (5.) perfusion index. We then checked whether venous and capillary glucose levels were correlated among groups, based on age, vital signs, and perfusion index.
Medcalc 13.3 software was used for the analysis. The data were summarized as mean ± standard deviation (SD) and minimum–maximum capillary and venous glucose levels. Comparability was evaluated by the Bland–Altman graphical method and Passing and Bablok regression method. The regression equation (y = a + bx) revealed constant (a) and proportional (b) difference with confidence intervals of 95%. Where x = y, there was no significant difference between methods, and both methods could be used inter-changeably. In the Passing and Bablok regression method, in cases where the intercept was close to 0 and the slope was close to 1, capillary and venous blood glucose values were considered the most comparable. The Cusum test for linearity was used to evaluate how well a linear model fit the data. A significant P-value indicated the method was nonlinear (significant deviation from linearity). The results of the Passing and Bablok procedure were supplemented with a Bland–Altman plot. The Bland–Altman plot is a graphical method to compare two measurement techniques.7 The level of significance was accepted as P,0.05.
Results
Table 1 shows the descriptive statistics related to the patients in the study.
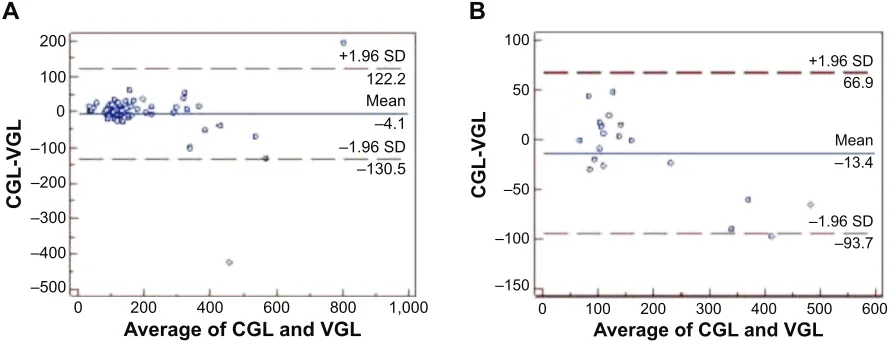
There were 67 patients with normal vital signs and perfusion index of 0–5 (or “low” perfusion index values). In this group, capillary and venous blood glucose values were comparable with each other (Figure 1A). The venous
Therapeutics and Clinical Risk Management downloaded from https://www.dovepress.com/ by 118.70.13.36 on 27-Aug-2020
Dovepress low perfusion index affects glucose level
and capillary glucose levels of patients with normal vital signs and perfusion index between 0 and 5 were more consistent compared with the levels of patients with normal vital signs and high perfusion index (.5) (n=19) (Figures 1A and B).
In all groups of patients, in the cases where at least one of the vital signs was abnormal, venous and capillary glucose levels were more consistent in patients with high perfusion index (n=57) compared with the patients with low perfusion index (n=131) (Figures 2A and B).
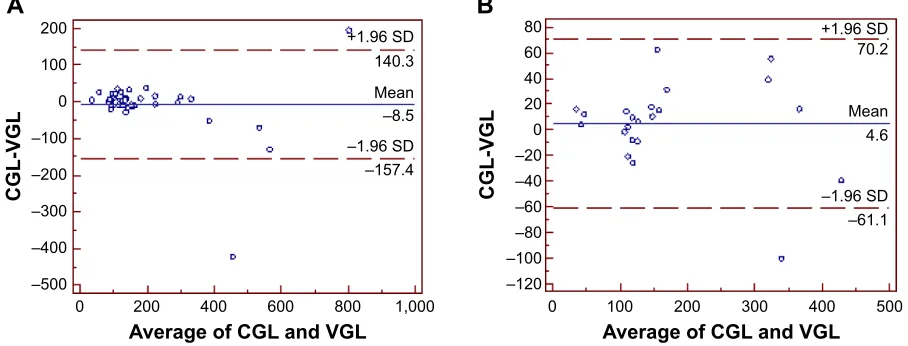
In the group of patients with normal vital signs and low perfusion index, venous and capillary glucose levels were more consistent with each other in older patients (n=22) com-pared with younger patients (n=44) (Figures 3A and B).
In the group of patients with normal vital signs and high perfusion index, venous and capillary glucose levels were more consistent in younger patients (n=12) compared with the older patients (n=7) (Figures 4A and B).
In the cases where at least one of the vital signs was abnormal and the perfusion index was between 0 and 5, venous and capillary glucose levels were more consistent
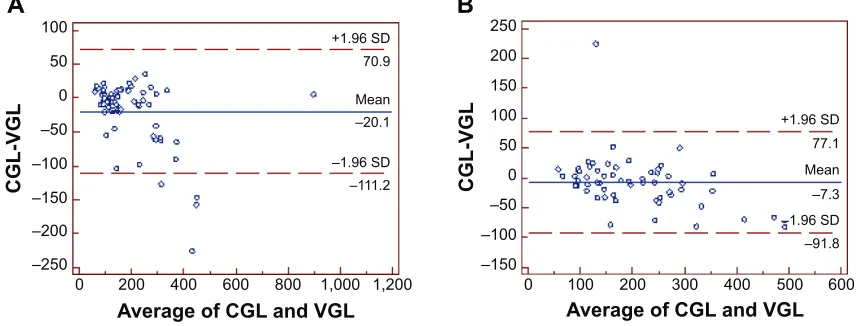
in the group of younger patients (n=72) compared with the group of older patients (n=59) (Figures 5A and B).
In the cases where at least one of the vital sign findings was abnormal and the perfusion index was high, venous and capillary glucose levels were more consistent in the group of younger patients (n=24) compared with the group of older patients (n=33) (Figures 6A and B).
In summary, Table 2 shows the major results of the analysis.
Discussion
Blood glucose regulation may be initiated according to the capillary glucose level before the level of glucose is determined by venous blood sample. That is why it is of particular importance for the management of critical patients that capillary and venous blood glucose levels are consistent with each other. Under ideal conditions, the consistency between the two methods is expected to be perfect. Above all, the devices used for measurement need to be calibrated accurately. Among the factors that foster consistency are lack of a critical state (such as circulatory shock or heart failure)
Table 1 Descriptive statistics related to the participants
Parameters Number Mean ± SD Range
age 300 59.47±16.41 19.00–97.00
Finger stick blood glucose level* (mg/dl) 300 179.33±110.36 36.00–900.00
Venous glucose level (mg/dl) 274 196.08±130.16 18.00–895.00
Perfusion index** 300 4.56±3.59 0–30
Notes: *By abbott Optium exceed. **By Masimo Radical-7®.
Abbreviation: sD, standard deviation.
Figure 1 (A) Venous and capillary glucose level comparability in all patients with normal vital signs and low perfusion index (0–5) (n=67). (B) Venous and capillary glucose level comparability in patients with normal vital signs and high perfusion index (.5) (n=19).
Notes: (A) Passing and Bablok regression equation y =5.4648+0.9718x. Cusum test for linearity: P.0.10. (B) Passing and Bablok regression equation y =28.2272+0.7923x. Cusum test for linearity: P.0.05.
Abbreviations: Cgl, capillary glucose level; Vgl, venous glucose level; sD, standard deviation.
CGL-VG
L
A
Average of CGL and VGL 200
+1.96 SD
–1.96 SD 122.2
–130.5 Mean –4.1 100
0
–100 –200 –300
–400 –500
0 200 400 600 800 1,000
B
CGL-VG
L
Average of CGL and VGL
+1.96 SD
–1.96 SD 66.9
–93.7 Mean –13.4
–150 –100 –50 0 50 100
0 100 200 300 400 500 600
Therapeutics and Clinical Risk Management downloaded from https://www.dovepress.com/ by 118.70.13.36 on 27-Aug-2020
Dovepress acar et al
Figure 2 (A) Venous and capillary glucose level comparability in patients with at least one abnormal vital sign finding and low perfusion index (n=131). (B) Venous and capillary glucose level comparability in patients with at least one abnormal vital sign finding and high perfusion index (n=57).
Notes: (A) Passing and Bablok regression equation y =13.8113+0.8679x. Cusum test for linearity: P.0.05. (B) Passing and Bablok regression equation y =10.2941+0.8916x. Cusum Test for linearity: P.0.10.
Abbreviations: Cgl, capillary glucose level; Vgl, venous glucose level; sD, standard deviation.
A
CGL-VG
L
Average of CGL and VGL 300
200
100 +1.96 SD
+1.96 SD
–1.96 SD
–1.96 SD –103.1
–85.8 74.3
56.4
–14.4 –14.7
Mean Mean
0
–100
–200
–300 –150
–100 –50 0 50 100
0 200 400 600 800 1,000 1,200 0 100 200 300 400 500 600
Average of CGL and VGL
CGL-VG
L
B
Figure 3 (A) Venous and capillary glucose level comparability in younger patients, aged 18–65 years, with perfusion index between 0 and 5 (n=44). (B) Venous and capillary glucose level comparability in older patients, aged .65 years, with perfusion index between 0 and 5 (n=22).
Notes: (A) Passing and Bablok regression equation y =8.3621+0.9310x. Cusum test for linearity: P.0.10. (B) Passing and Bablok regression equation y =1.8347+1.0565x. Cusum test for linearity: P.0.10.
A
CGL-VG
L
Average of CGL and VGL Average of CGL and VGL
CGL-VG
L
B
+1.96 SD
200 80
60 40 20 0 –20 –40 –60 –80 –100 –120 100
0
–100
–200
–300
–400
–500
0 200 400 600 800 1,000 0 100 200 300 400 500
–1.96 SD –157.4 140.3
–8.5 Mean
+1.96 SD
–1.96 SD –61.1 70.2
4.6 Mean that may cause a difference between levels of capillary and
venous glucose, or lack of drug intake (such as calcium channel blockers and alpha blockers). In the present study, we compared the blood glucose measurements of critical patients (patients in triage category 1, in need of immediate treatment). As the age of critical patients increases, it is more likely that they suffer from one or more additional disorders and use one or more drugs. These patients, in most cases, have clinical conditions, such as diabetes mellitus, decompensated heart failure, and sepsis, which may cause circulatory disorders. Vital sign findings are expected to be affected by the presence of a circulatory problem that may
influence blood glucose measurements. Based on this idea, we analyzed glucose measurement results of patients in view of abnormality in the vital signs. The capillary blood glucose value was expected to be comparable with the venous value in the absence of acute circulatory disorder or any condition affecting the vital signs.
For the purpose of this study, we tested the consistency of capillary whole-blood and venous plasma glucose values of patients aged 18 years and over, according to the perfusion index value obtained by the Masimo Radical-7 – a finger probe testing device. The participants with normal vital signs had perfusion index between 0 and 5; the results obtained by
Therapeutics and Clinical Risk Management downloaded from https://www.dovepress.com/ by 118.70.13.36 on 27-Aug-2020
Dovepress low perfusion index affects glucose level
Figure 4 (A) Venous and capillary glucose level comparability in younger patients, aged 18–65 years, with perfusion index .5 (n=12). (B) Venous and capillary glucose level comparability in older patients, aged .65 years, with perfusion index .5 (n=7).
Notes: (A) Passing and Bablok regression equation y =11.3753+0.8528x. Cusum test for linearity: P.0.10. (B) Passing and Bablok regression equation y =56.1357+0.6953x. Cusum test for linearity: P.0.10.
Abbreviations: Cgl, capillary glucose level; Vgl, venous glucose level; sD, standard deviation.
–150 –100
–80 –60 –40 –20 0 20 40 60
–100 –50 0 50 100 150
0 100 200 300 400 500
0 100 200 300 400 500 600
Average of CGL and VGL Average of CGL and VGL
CGL-VG
L
CGL-VG
L
A
B
+1.96 SD
–1.96 SD –82.9
–1.96 SD –112.2
48.0 +1.96 SD
99.0
–17.4 Mean
–6.6 Mean
Average of CGL and VGL Average of CGL and VGL
CGL-VG
L
CGL-VG
L
A
B
–150 –200
–250 –150
–100 –50 0 50 100 150 200 250
–100 –50 0 50 100
0
0 200 400 600 800 1,000 1,200 100 200 300 400 500 600
+1.96 SD
–1.96 SD –111.2 70.9
–20.1 Mean
+1.96 SD
–1.96 SD –91.8 77.1
–7.3 Mean
Figure 5 (A) Venous and capillary glucose level comparability in younger patients, aged 18–65 years, with at least one abnormal vital sign finding and low perfusion index (n=72). (B) Venous and capillary glucose level comparability in older patients, aged .65 years, with at least one abnormal vital sign finding and low perfusion index (n=59). Notes: (A) Passing and Bablok regression equation y =13.9138+0.8459x. Cusum test for linearity: P,0.05. (B) Passing and Bablok regression equation y =16.4853+0.8758x. Cusum Test for linearity: P.0.10.
Abbreviations: Cgl, capillary glucose level; Vgl, venous glucose level; sD, standard deviation. the two methods were more consistent for perfusion index
values of 6 and over. In the cases where at least one of the vital signs was abnormal, the glucose values obtained by the two methods were more consistent when the perfusion index was 6 or over. We cannot explain this difference, considering current results of our study.
With respect to age groups, the results were most consistent in older participants with normal vital sign findings and low perfusion index and in younger patients with high perfusion index. In the group of cases where vital signs was abnormal, independent from the perfusion index value, the consistency between capillary and venous glucose levels was higher in younger patients compared
with older patients. These results are confounding and not easily explainable.
To our knowledge, there are no studies in the literature comparing venous and capillary glucose levels by perfusion index, in emergent and critical situations, with a method simi-lar to the one used in this study. It is nevertheless possible to find studies that focus on the consistency of glucose values in venous (plasma) and capillary (whole-blood) samples in emergent conditions.8–10 Ullal et al reported that the measure-ments made by various glucometers in and outside the hospi-tal were well correlated with laboratory results.11 Dungan et al found that venous plasma glucose levels were well correlated with glucose levels measured in whole blood by hand-held
Therapeutics and Clinical Risk Management downloaded from https://www.dovepress.com/ by 118.70.13.36 on 27-Aug-2020
Dovepress acar et al
Average of CGL and VGL
CGL-VG
L
Average of CGL and VGL
CGL-VG
L
A
B
–150 –120
–100 –80 –60 –40 –20 0 20 40 60
–100 –50 50
0 100
0 100 200 300 400 500 600 0 100 200 300 400 500
+1.96 SD
–1.96 SD –103.8 67.1
–18.3 Mean
+1.96 SD
–1.96 SD –71.5 47.3
–12.1 Mean
Figure 6 (A) Venous and capillary glucose level comparability in younger patients, aged 18–65 years, with at least one abnormal vital sign finding and high perfusion index (n=24). (B) Venous and capillary glucose level comparability in older patients, aged .65 years, with at least one abnormal vital sign finding and high perfusion index (n=33). Notes: (A) Passing and Bablok regression equation y =7.0950+0.8450x. Cusum test for linearity: P.0.10. (B) Passing and Bablok regression equation y =9.1246+0.9208x. Cusum test for linearity: P.0.10.
Abbreviations: Cgl, capillary glucose level; Vgl, venous glucose level; sD, standard deviation.
Table 2 summary of major results
Vital signs* Perfusion index# Younger/older groups& Higher consistency between
CGL and VGL in
normal low all low perfusion index group
high
abnormal low all high perfusion index group
high
normal low Younger Older patients
Older
normal high Younger Younger patients
Older
abnormal low Younger Younger patients
Older
abnormal high Younger Younger patients
Older
Notes: *normal limits of vital signs: systolic blood pressure 120–90 mmhg, pulse rate 60–100/min, respiration rate 12–16/min, body temperature 36.0°C –37.1°C, and oxygen saturation .94%. #low perfusion index includes scores 0–5; high perfusion index includes scores .5. &Younger patients are 18–65 years; older patients are .65 years. glucometers.12 However, clinicians are more interested in
the clinical consistency of glucometer and serum/plasma laboratory results. The criteria for clinical consistency vary according to the range of glucose concentrations and are dependent on how the result is used for the monitoring and management of the patient. Several factors may influence glucometer results: operator, technology, environmental factors, and patient-specific factors (medications, oxygen therapy, anemia, hypotension, and other disorders).13 In the present study, we did not analyze the medications and disorders of each patient individually. However, based on whether there was any abnormality in vital signs of critical patients, we divided the participants as participants with no abnormality in vital signs and participants with one or more
abnormalities in vital signs. The capillary and venous plasma glucose values were consistent in all patients with abnormal vital signs and in patients aged 65 and below who had normal vital signs but high perfusion index. However, the present study cannot explain why the results were in consistent in patients aged 65 and below who had normal vital signs but low perfusion index.
It may be appropriate to evaluate capillary and venous blood glucose measurement by perfusion index in cases where vital signs have not been affected yet but where there is a condition that may potentially cause perfusion disorder. In the results of our study, the test results were variable with respect to perfusion index. It cannot be clearly explained in our study why the consistency was higher in the case of
Therapeutics and Clinical Risk Management downloaded from https://www.dovepress.com/ by 118.70.13.36 on 27-Aug-2020
Therapeutics and Clinical Risk Management
Publish your work in this journal
Submit your manuscript here: http://www.dovepress.com/therapeutics-and-clinical-risk-management-journal
Therapeutics and Clinical Risk Management is an international, peer-reviewed journal of clinical therapeutics and risk management, focusing on concise rapid reporting of clinical studies in all therapeutic areas, outcomes, safety, and programs for the effective, safe, and sustained use of medicines. This journal is indexed on PubMed Central, CAS,
EMBase, Scopus and the Elsevier Bibliographic databases. The manuscript management system is completely online and includes a very quick and fair peer-review system, which is all easy to use. Visit http://www.dovepress.com/testimonials.php to read real quotes from published authors.
Dovepress
Dove
press
low perfusion index affects glucose level
patients with low perfusion index and completely normal vital sign findings and in patients with high perfusion index and at least one abnormal vital sign.
Blood sugar regulation can be undertaken in consider-ation of the capillary glucose level since it takes longer to obtain the glucose value by venous blood sample. That is why it is important, for the management of critical patients, that capillary and venous glucose values are consistent with each other. These two methods are supposed to produce fully consistent results under ideal conditions. It is primarily important that the devices used in measurement are calibrated accurately. The consistency strengthens in cases where the patient does not suffer from a clinical situation that is likely to cause differences in capillary and venous glucose values, eg, circulatory shock or congestive heart failure, and where the patient does not take any medications that may cause a difference, eg, calcium channel blockers or alpha blockers – the consistency of venous and capillary glucose levels in aged patients with low perfusion index may be the result of these conditions.
limitations
This study involved critical patients aged 18 years and over managed in the emergency department of a university hospital. Further studies are needed to test the results with patients aged below 18 years, in less urgent condition according to triage category, and after transfer to intensive care units or ambulatory clinics posthospitalization. The present study did not consider comorbid disorders, medications used by patients, or laboratory test results, so the impact of these factors on the consistency of venous and capillary glucose values cannot be explained clearly. There is a need to support the findings with studies involving a greater number of patients and more comprehensive clinical and laboratory results.
Conclusion
In the emergency department, perfusion index value mea-sured by the Masimo Radical-7 and capillary blood glucose
levels can serve in blood sugar management in critically ill patients.
Disclosure
The authors report no conflict of interest in this work.
References
1. Rajaratnam HN, Pathmanathan S. How reliable are capillary blood glucose measurements? Sri Lanka Journal of Diabetes Endocrinology and Metabolism. 2011;1:22–24.
2. nlm.nih.gov [homepage on the Internet]. MedlinePlus: Vital signs. US National Library of Medicine; 2014 [updated October 2, 2014; cited January 21, 2013]. Available from: http://www.nlm.nih.gov/ medlineplus/ency/article/002341.htm. Accessed September 29, 2014. 3. emergencycareforyou.org [homepage on the Internet]. ER 101: Vital
signs. American College of Emergency Physicians; 2014 [cited September 29, 2014]. Available from: http://www.emergencycarefo-ryou.org/VitalCareMagazine/ER101/Default.aspx?id=500. Accessed October 4, 2014.
4. mycleveland.org [homepage on the Internet]. Vital signs. Cleve-land Clinic; 2014 [updated July 12, 2010; cited September 29, 2014]. Available from: http://my.clevelandclinic.org/health/ healthy_living/hic_Pre-participation_Evaluations/hic_Vital_Signs. Accessed October 4, 2014.
5. Masimo Corporation. Clinical Applications of Perfusion Index. Irvine, CA: Masimo Corporation; 2007. Available from: http://www.masimo. com/pdf/whitepaper/LAB3410F.pdf. Accessed July 5, 2014. 6. Murthy TSVP, Goyal R, Singh VP. Masimo – A new reliable non
invasive method of detecting oxygen saturation in critically ill. Indian J Anaesth. 2005;49(2):133–136.
7. Bilić-Zulle L. Comparison of methods: Passing and Bablok regression. Biochema Med. 2011;21(1):49–52.
8. Scott PA, Wolf LR, Spadafora MP. Accuracy of reagent strips in detect-ing hypoglycemia in the emergency department. Ann Emerg Med. 1998; 32(3 Pt 1):305–309.
9. Jones JL, Ray VG, Gough JE, Garrison HG, Whitley TW. Determination of prehospital blood glucose: a prospective, controlled study. J Emerg Med. 1992;10(6):679–682.
10. Lavery RF, Allegra JR, Cody RP, Zacharias D, Schreck DM. A prospec-tive evaluation of glucose reagent teststrips in the prehospital setting. Am J Emerg Med. 1991;9(4):304–308.
11. Ullal A, Parmar GM, Chauhan PH. Comparison of glucometers used in hospitals and in outpatient settings with the laboratory reference method in a tertiary care hospital in Mumbai. Indian J Endocrinol Metab. 2013;17(Suppl 3):S688–S693.
12. Dungan K, Chapman J, Braithwaite SS, Buse J. Glucose measurement: confounding issues in setting targets for inpatient management. Diabetes Care. 2007;30(2):403–409.
13. Tonyushkina K, Nichols JH. Glucose meters: a review of technical chal-lenges to obtaining accurate results. J Diabetes Sci Technol. 2009;3(4): 971–980.
Therapeutics and Clinical Risk Management downloaded from https://www.dovepress.com/ by 118.70.13.36 on 27-Aug-2020