www.nat-hazards-earth-syst-sci.net/11/2605/2011/ doi:10.5194/nhess-11-2605-2011
© Author(s) 2011. CC Attribution 3.0 License.
Natural Hazards
and Earth
System Sciences
Patterns of grain-size temporal variation of sediment transported by
overland flow associated with moving storms: interpreting soil flume
experiments
J. L. M. P. de Lima1,3, P. A. Dinis2,3, C. S. Souza3,7, M. I. P. de Lima5,3, P. P. Cunha2,3, J. M. Azevedo2,4, V. P. Singh6, and J. M. Abreu1,3
1Department of Civil Engineering, Faculty of Science and Technology, University of Coimbra, 3030-788 Coimbra, Portugal 2Department of Earth Sciences, Faculty of Science and Technology, University of Coimbra, 3000-272 Coimbra, Portugal 3Institute of Marine Research (IMAR), Marine and Environmental Research Centre, Coimbra, Portugal
4Geophysical Centre, Faculty of Science and Technology, Univ. of Coimbra, Avenida Dias da Silva, 3000-134 Coimbra, Portugal
5Department of Forest Resources, Coimbra College of Agriculture, Polytechnic Institute of Coimbra, Bencanta, 3040-316 Coimbra, Portugal
6Department of Biological and Agricultural Engineering & Department of Civil and Environmental Engineering, Texas A&M University, 321 Scoates Hall, 2117 TAMU, College Station, Texas 77843-2117, USA
7BVP Engenharia, Av. Luiz Paulo Franco, 457, 5◦, Belvedere, Belo Horizonte, Brazil
Received: 20 June 2010 – Revised: 4 June 2011 – Accepted: 5 August 2011 – Published: 27 September 2011
Abstract. This study describes and interprets the evolu-tion of grain-size distribuevolu-tion of sediment yields generated in an experimental soil flume subjected to downstream and upstream moving rain storms. Results of laboratory experi-ments show that downstream moving storms cause more soil loss than do upstream moving storms. The pattern of sedi-ment grain-size evolution in time during a runoff event ex-hibits a clear dependence on the direction of storm move-ment. A strong relationship between overland flow discharge and mean sediment size is found. Nevertheless, the mean grain-size of sediments transported during the rising limb of the hydrograph is coarser than during the recession limb of the hydrograph. This is more marked for downstream mov-ing storms.
1 Introduction
Soil erosion, particularly the erosion associated with rain-fall events, is a natural process that affects the genesis and dynamics of landscapes (e.g. Harvey, 2001; Hooke, 2003; O’Farrell et al., 2007). It is a major concern in agricultural management, engineering studies, and land planning.
Correspondence to: J. L. M. P. de Lima ([email protected])
Although soil erosion and surface water flow have been ex-tensively studied, many studies have tended to focus mainly on rainfall intensity, leaving out other characteristics of nat-ural storms which are highly variable both in time and space (e.g. Sharon, 1980; Willems, 2001). The high number of variables involved and the difficulties in understanding, characterizing, and simulating the entire set of parameters and interacting processes hamper the accurate prediction of runoff, sediment erosion, and sediment transport processes (e.g. Morgan, 1995; Seeger, 2007). In order to investigate the mechanisms associated with rainfall-related soil erosion, experimental studies in the field and in the laboratory have been conducted with the help of rainfall simulators (see e.g. Cerd´a et al., 1997). With rainfall simulators it is possible to control most of the relevant parameters by forcing some of the variables involved.
The grain-size of sediments generated from soil erosion can be determined by many factors, such as: grain-size dis-tribution of the original soil, the settling velocities of dif-ferent size classes, the processes of aggregate breakdown due to splash erosion, and the occurrence of selective trans-port processes for different size classes (Rose et al., 2006; Asadi et al., 2007; Kinnell, 2009a). A few erosion-transport-deposition models have been formulated to simulate the par-ticle size distribution of sediment transport (e.g. Hairsine and Rose, 1992a, b). However, some results remain difficult to explain due to the high number of factors that control the
2606 J. L. M. P. de Lima et al.: Patterns of grain-size temporal variation of sediments grain-size distribution of the produced sediment (Beuselinck
et al., 2002; Rose et al., 2006).
The characteristics of rainfall, particularly the spatial-temporal variability of rainfall intensity, play a major role in sediment yield (e.g. R¨omkens et al., 2001; Parsons and Stone, 2006). Some investigations took into account the ef-fect of the movement of rainfall storms (i.e. the combined action of wind and rain) across drainage areas, which can strongly affect runoff generation and soil erosion rates, re-sulting in under- or over-estimation of discharge and soil ero-sion (e.g. Singh, 1998; de Lima and Singh, 2003; de Lima et al., 2008). Wind-driven rain is described as raindrops falling through a wind field at an angle from vertical under the ef-fect of both gravitational and drag-forces. In this situation, raindrops gain some degree of horizontal velocity and hit the soil surface with an angle.
The importance of the combined action of wind and rain, especially the changes in rainfall characteristics (e.g. spa-tial and temporal evolution and trajectory of drops) and the runoff dynamics (e.g. volume, speed, and surface spread-ing), has long been recognized by a number of researchers (e.g. Maksimov, 1964; Yen and Chow, 1968; Wilson et al., 1979; Singh, 1998; de Lima and Singh, 1999; de Lima et al., 2003; Erpul et al., 2003). Experimental simulations have demonstrated that the peak discharge values and sediment yields are higher for downstream moving storms than for up-stream moving storms (e.g. de Lima and Singh, 2003; de Lima et al., 2003). Similar results have been obtained from modelling runoff and erosion generated by moving storms at the drainage basin scale (e.g. Nunes et al., 2006; Chang, 2007). However, the evolution of grain-size distribution of sediments generated from soil erosion and their relation to the variables that may determine the dynamics of overland flow and erosion potential have not been fully investigated.
This study is based on laboratory experiments and the main objective is to increase the understanding of the dif-ferences in grain-size distribution of sediments generated on slopes, when rainstorms are moving along distinct directions, inducing different spatial and temporal rainfall characteris-tics over a drainage area.
2 Laboratory set-up and procedure
This section describes the laboratory set-up used in this study and the methodology applied to characterize soil grain-size distributions. The laboratory experiments use a soil flume and simulated rainfall events. In this study tests were carried out for two types of rainstorm directions, downstream and upstream, along the length of the flume.
2.1 Rainfall and storm movement
The experimental work simulates a rain cell moving across a drainage area. This was accomplished through the
displacement of a rainfall simulator, at a constant speed, over a soil flume. The rainfall pattern was geometrically invariant along the flume.
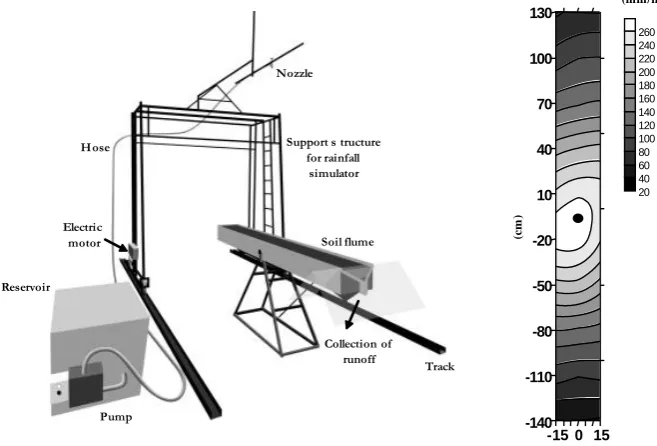
The rainfall simulator (Fig. 1 – left) comprised a constant level reservoir, a pump, a system of hoses, a stand, two elec-tric motors, an automatic control panel to set the speed at which the apparatus moves, and a sprinkler. The laboratory experiments were conducted using one single downward-oriented full-cone nozzle spray (3/4 HH – 4 FullJet Nozzle Brass-Spraying Systems Co.). Full cone sprays (solid cir-cular pattern of drops) are commonly used in rainfall simu-lations, both in the field and in the laboratory. A full-cone nozzle spray provides a high velocity water jet which is dis-persed into the air in a set of drops and droplets.
The sprinkler was fixed on a connecting rod in a stand placed 2.20 m above the flume surface and produced a full cone spray (solid circular pattern of drops). The esti-mated average raindrop-size (equivalent drop diameter) was 1.5 mm; the measurements were taken by a distrometer (laser precipitation monitor – Thies Clima) at different positions across the wetted area. The hydraulic system of the labora-tory set-up was operated at a constant pressure of 2 bar, cor-responding to a water discharge of 12.0 l min−1. From this discharge, a total of 3.28 l of water fell on the flume surface during each experimental run. As the flume surface area was 0.90 m2, this discharge was equivalent to an average rainfall intensity of 138 mm h−1, with the maximum intensity (ap-proximately 270 mm h−1)falling directly below the nozzle. The rain intensity distribution over the flume was measured by 21 small rain gauges (7 rows of 3 gauges) during 5 min of exposure (Fig. 1 – right). Although the rainfall intensi-ties used in this study were very high, similar intensiintensi-ties are nevertheless observed in nature for short periods, in heavy bursts. The Intensity-Duration-Frequency curves proposed by Matos and Silva (1986), for a large portion of mainland Portugal, associate a return period of 5 yr to a rain spell of the same duration and mean intensity, similar to the simulated in the laboratory. For the same return period, a 1 min burst has an estimated mean intensity of approximately 260 mm h−1. The IDF curves in Matos and Silva (1986) are often used for the design of hydraulic structures in Portugal; for other stud-ies on high intensity rain events in Portugal and IDF curves see e.g. Brand˜ao and Rodrigues (2001).
The spatial distribution of the rainfall simulated in the lab-oratory resembles natural conditions in that it is not uniform. The spatial rainfall pattern generated by the nozzle repre-sents a rain cell that moves across a drainage basin. This spatial variation induces a temporal rainfall distribution at each point of the soil flume. In space and time, this situation is closer to reality than uniform rainfall patterns. But there are technical limitations to simulating in the laboratory the extreme variability observed in natural rain. Once raindrops are catapulted from the nozzle, they begin to move under the action of gravity and frictional forces. At the tail end of the nozzle spraying cone ,the angle of impact of the raindrops is
J. L. M. P. de Lima et al.: Patterns of grain-size temporal variation of sediments 2607
19
FIGURES
1
2
3
4
Fig. 1.
Laboratory set-up (left) and spatial distribution of rainfall intensity (right), under the nozzle
5
located at (0,0).
6
7
-15 0 15 -140 -110 -80 -50 -20 10 40 70 100 130
20 40 60 80 100 120 140 160 180 200 220 240 260
(mm/h)
Nozzle
Hose Support s tructure
for rainfall simulator
Soil flume
Reservoir
Pump
Track Electric
motor
Collection of runoff
(cm
)
Fig. 1. Laboratory set-up (left) and spatial distribution of rainfall intensity (right), under the nozzle located at (0,0).
slightly higher than in the area just beneath the nozzle where raindrops fall vertically.
In the laboratory, the nozzle spray was operated in still-air for both static and moving storms. Kinetic energy and rainfall intensity under a nozzle in still-air (laboratory condi-tions) are highly concentrated as observed in the peaks shown in Fig. 1 (right), which is a characteristic of sprays formed by a solid circular pattern of drops.
The higher the surface gradient, the bigger the difference between raindrop impact angle for the leading edge and tail end. However, because the rain simulations were conducted in windless conditions, the raindrop impact angles remained approximately the same for each slope.
The upstream and downstream displacement of rainfall over the soil flume was obtained by moving the wheeled stand holding the nozzle on a steel rail. This movement was powered by 2 electric motors and kept constant at 1.97 m min−1. Each experimental run started when the rain-fall spraying cone entered the soil flume. From that moment, the rainfall cone took approximately 91 s to reach the oppo-site end of the flume channel and 183 s to definitively leave the flume channel.
2.2 Soil and flume
The laboratory soil flume (Fig. 1 – left) was made of zinc-coated iron and was 3.0 m long, 0.30 m wide, and 0.10 m deep (soil layer dimensions). The slope of the flume was ad-justable by a screw system. Tests were carried out for three soil flume gradients: 2 %, 7 %, and 14 %.
The flume structure was filled with natural soil, which con-sisted of 7 % clay (<4 µm), 9 % silt (4-63 µm), 73 % sand (63–2000 µm), and 11 % gravel (>2000 µm), similar to the soil used in de Lima et al. (2003, 2008). The grain-size distribution of the original soil was characterized by aD50 of 0.49 mm and aD90 of 2.1 mm. The soil was previously sieved using a 15 mm mesh; all vegetative material and atyp-ical coarser particles (e.g. stones, roots) were removed. Af-terwards the soil was re-mixed mechanically with a hand shovel. The objective was to obtain homogeneity of the soil material placed in the flume, aiming at using soil mate-rial with the same characteristics in the different repetitions. This homogeneity was controlled by grain-size analyses of random samples to guarantee homogeneity of the soil mate-rial placed in the flume for different experimental repetitions. Before the experimental runs, the soil in the flume was satu-rated in order to conduct the experiments with soil moisture close to field capacity. To avoid disturbances on the soil sur-face associated to this process, water was directly applied by hand on the surface, with a hose, using low discharge rates. 2.3 Overland flow measurements
Overland flow was collected manually at the flume outlet ev-ery 15 seconds to obtain individual samples for grain-size analysis in a very short period of time. Each experimental run started (i.e.t=0) when the leading edge of the rainfall cone crossed the outlet (for upstream moving storms) or the upper end of the flume channel (for downstream moving storms). In these experiments the overland flow sheet was very shallow (between 1 and 2 mm at peak discharge at the downstream
2608 J. L. M. P. de Lima et al.: Patterns of grain-size temporal variation of sediments end of the flume). The water depth on the soil surface was
measured directly with a point gauge manually adjusted to touch the water surface (readings are taken using a vernier scale); it was also estimated through the measurements of mean flow speeds by dye tracing (see e.g. Dunkerley, 2001). The water depth was fairly uniform across the flume; no sig-nificant rills were observed at the soil surface after the end of an experimental run. Experiments for each combination of slope and storm movement direction were repeated four times. To ensure similar conditions for each case, the soil was replaced between different rain-type experiments. 2.4 Sediment discharge measurements and grain-size
analysis
During experimental runs, runoff collected every 15 s yielded a total number of 291 samples: 176 samples for upstream moving storms and 115 samples for downstream moving storms. In these experiments the average sediment concen-tration in runoff water was about 60 g l−1. The sediment con-tent in each sample was subject to grain-size analysis. The repetition of the experimental run types resulted in 4 sam-ples for the same experiment time; each run type represented a particular combination of storm direction and flume gradi-ent. Whenever the samples were too small to allow for grain-size analysis, the corresponding samples were added prior to grain-size analysis. The objective of the grain-size anal-ysis was to trace the evolution of the characteristics of the washed-out sediments during the runoff and soil loss event.
The sediments transported by overland flow and collected at the flume outlet had different proportions of coarse (sand and gravel) and fine (silt and clay) particles. Hence, the bulk grain-size distribution of these sediments could not be eas-ily determined with a single technique; therefore, a two-fold approach was adopted. The grain-size of coarser particles was determined by conventional sieving, while the grain-size of finer particles was determined by laser diffraction using a Coulter LS 320 instrument that can measure particles with size between 0.04 µm and 2000 µm. Although different par-ticle properties were measured with sieving and laser diffrac-tion (weight and volume, respectively), the two sets of data were compared and combined because we assumed that the sediments have a homogeneous density. As there was no ev-idence of heavy mineral enrichment in any size-fraction, we considered that any small difference in density was not suffi-cient to derail a combination of the two techniques.
Several researchers have shown that sieving and laser diffraction give different size results and that laser diffrac-tion tends to indicate higher propordiffrac-tions of coarser particles (e.g. Jonasz, 1991; Konert and Vandenberghe, 1997; Eshel et al., 2004; Blott and Pye, 2006). When laser and siev-ing procedures are used to characterize the bulk grain-size distribution, the selection of a threshold diameter to sepa-rate two sub-samples to be measured by different methods must guarantee that a minimal bias is introduced. Because
laser diffraction cannot be used to measure representative sample suspensions containing medium sand or coarser par-ticles, this study adopted a threshold diameter of 0.25 mm. Thus, the particles with a grain-size larger than 0.25 mm were determined by conventional sieving and the size smaller than 0.25 mm by laser diffraction. Hence, the option for 0.25 mm was a compromise solution that allowed obtaining high number of grain-size data based on a single technique (laser diffraction). If we would have adopted a finer diame-ter, it would have been necessary to integrate sieving in more samples; the option for a coarser diameter was rejected be-cause laser diffraction tends to overestimate the proportion of coarse (>0.5 mm) particles (Blott and Pye, 2006).
In studies on the grain-size distribution of sediments gen-erated by natural processes, it is usual to define the limits of grain-size classes using a logarithmic scale with equal inter-vals (Wentworth, 1922). Based on this approach, a compara-tive analysis of frequency curves was conducted and the con-stituent sub-populations were characterized. Furthermore, this approach allowed the definition of statistical parameters that describe a single distribution, which is highly conve-nient when a large number of samples are to be compared. The bulk grain-size results, obtained by both sieving and laser diffraction, were integrated on a conceptual scale (e.g. Wentworth, 1922; Krumbein, 1934; Krumbein and Pettijohn, 1938) based on a logarithmic transformation (base two log-arithm) of the particle diameter (in mm). Thus, the percent-ages of particles present in the grain-size classes limited by 0.001, 0.002, 0.004, 0.008, 0.016, 0.032, 0.063, 0.125, 0.25, 0.5, 1, 2, and 4 mm were determined. The average grain-size was obtained with the “Moments” method (Krumbein and Pettijohn, 1938; Friedman, 1979).
3 Results and discussion
3.1 Hydrographs and sediment graphs
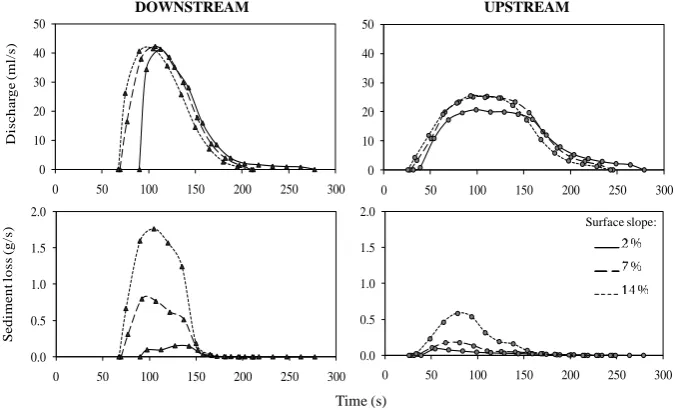
Figure 2 presents mean runoff hydrographs and associated sediment-loss graphs of the events corresponding to combi-nations of 3 surface slopes and 2 storm directions: upstream and downstream; the data are the mean of 4 repetitions of each experiment-type. The grain-size temporal variation of the sediments transported by overland flow were analysed. The shape of the hydrographs are clearly controlled by the type of the input (space and time variation of rainfall in-duced by storm movement) (Fig. 2 – top). The differences are explained by the coincidence of the direction of the over-land flow movement and the downstream-moving storm di-rection, which leads to an intensification of discharge, con-trasting with the opposite direction for an upstream moving storm (see also: de Lima and Singh, 2003; de Lima et al., 2008).
The soil flume gradient has a strong influence on the soil loss produced; on steeper slopes the total amount of sediment
J. L. M. P. de Lima et al.: Patterns of grain-size temporal variation of sediments 2609
20 1
2
3 4
Fig. 2. Runoff hydrographs (top) and respective sediment graphs (bottom) for different surface gradients 5
(2%, 7% and 14%), for downstream and upstream moving rainstorms. Each graph represents mean values 6
from 4 experimental runs. 7
0.0 0.5 1.0 1.5 2.0
0 50 100 150 200 250 300 Surface slope:
DOWNSTREAM UPSTREAM
0 10 20 30 40 50
0 50 100 150 200 250 300
D
is
ch
ar
g
e
(ml
/s
)
0 10 20 30 40 50
0 50 100 150 200 250 300
0.0 0.5 1.0 1.5 2.0
0 50 100 150 200 250 300
Sed
imen
t
lo
ss
(g
/s
)
Time (s)
Fig. 2. Runoff hydrographs (top) and respective sediment graphs (bottom) for different surface gradients (2 %, 7 % and 14 %), for downstream
and upstream moving rainstorms. Each graph represents mean values from 4 experimental runs.
Table 1. Total measured runoff volumes (l), Runoff Coefficients, and total measured soil losses (g m−2)as a function of surface slope and direction of rainstorm movement, for all the experimental runs.
Runoff (l) and Soil loss
Runoff Coefficient (%) (g m−2)
Downstream Upstream Downstream Upstream
moving storms moving storms moving storms moving storms
Surface slope (%) 2 2.61 (79 %) 2.72 (82 %) 9.04 6.88
7 2.96 (90 %) 3.08 (93 %) 52.20 14.11
14 2.92 (88 %) 2.93 (89 %) 117.76 43.89
Note: since the speed of the rain simulator was kept at a constant speed of 1.97 m min−1, a total amount of rainfall of 3.3 l of water fell on the flume surface in each experimental
run.
loss is higher (Fig. 2 – bottom; Table 1). This can be justified based on the energy available, which increases with flume gradient; hence, a greater percentage of material was carried away. It should be noted that the total amount of rainfall and runoff remained approximately constant since they resulted from similar storm events that moved with the same velocity and, furthermore, the soil was at field capacity for all events (checked by soil moisture TDR probes).
Sediment yield is also highly dependent on the direction of the rainstorm movement. Downstream-moving rainfall storms were responsible for higher runoff peaks and the cor-responding sediment graphs were more peaked than those obtained for upstream-moving storms (Fig. 2). Sediment-loss graphs followed the pattern of the corresponding hy-drographs. The rainfall spatial distribution below the noz-zle (Fig. 1 – right) also affected the sediment delivery during each event.
3.2 Grain-size distribution of sediments transported by overland flow
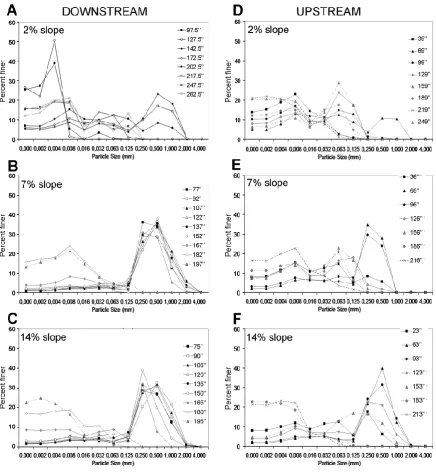
The sediment load generated by downstream moving storms presented a different behaviour in terms of grain-size distri-bution curves for higher slopes (7 % and 14 %) and for a gen-tle slope (2 %) (Fig. 3). For downstream storms the sediment transported by runoff was dominated by 0.125 to 2.0 mm par-ticles, which are also dominant in the tested soil. The re-cession limb of the hydrograph was dominated by particles mainly finer than 63 µm (silt and clay). The sediment gen-erated by a downstream moving storm on the 2 % gradient tended to be dominated by silt and clay-size particles, with a significant proportion of sand only during the rising limb of the hydrograph (Fig. 3c).
The sediment grain-size distributions, generated by upstream-moving storms, showed a similar behaviour: the
2610 J. L. M. P. de Lima et al.: Patterns of grain-size temporal variation of sediments
de Lima et al. – NHESS - Grain-size patterns of sediments generated by moving storms
21
1
Fig. 3. Evolution in time (seconds) of grain-size distribution curves of sediments transported by overland
2
flow obtained for storms moving downstream (left) and upstream (right) over surface gradients of 2%,
3
7% and 14%. Each curve represents mean values from 4 experimental runs.
4
5
6
Fig. 3. Evolution in time (seconds) of grain-size distribution curves of sediments transported by overland flow obtained for storms moving
downstream (left) and upstream (right) over surface gradients of 2 %, 7 %, and 14 %. Each curve represents mean values from 4 experimental runs.
higher surface gradients led to a significant percentage of particles between 0.125 and 2.000 mm, which was typically above 50 % of the total amount of sediments.
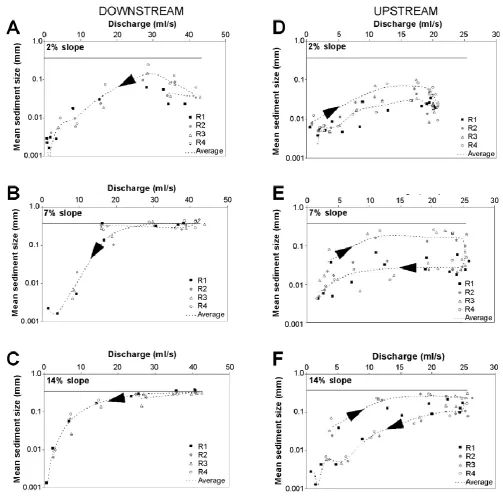
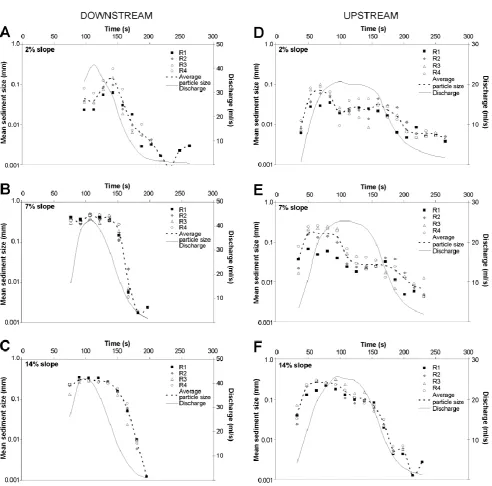
The variation of the mean grain-size of the sediments transported by the overland flow generated during the experi-mental runs is shown in Fig. 4. The data plotted in this figure were obtained from the four repetitions of each event and for the corresponding average; in each plot the arrow indicates, for the average behaviour, the grain-size evolution through-out the events. When the mean grain-size is plotted against
discharge for the 2 % flume gradient and downstream moving storms, it can be seen that the maximum in mean grain-size is reached later than the peak discharge (Fig. 4a). For upstream moving storms and also for the higher flume gradients, the opposite occurs. Moreover, the sediments transported during upstream-moving storms are much more dominated by clay and silt particles than those yielded by downstream moving storms. This can be justified based on the smaller energy available for upstream moving storms than for the down-stream moving storms.
J. L. M. P. de Lima et al.: Patterns of grain-size temporal variation of sediments 2611
22
1
Fig. 4.
Relationship between mean sediment grain-size and runoff discharge for 2%, 7%, and 14% surface
2
gradients for downstream moving storms (left) and upstream moving fronts (right). The data are from
3
four independent repetitions (R1, R2, R3 and R4). The horizontal grey line represents mean grain-size of
4
the original soil. Arrow indicates grain-size evolution throughout the experiment. Note the different
5
discharge scale for upstream and downstream moving storms.
6
7
8
Fig. 4. Relationship between mean sediment grain-size and runoff discharge for 2 %, 7 %, and 14 % surface gradients for downstream moving storms (left) and upstream moving fronts (right). The data are from four independent repetitions (R1, R2, R3, and R4). The horizontal grey line represents mean grain-size of the original soil. Arrow indicates grain-size evolution throughout the experiment. Note the different discharge scale for upstream and downstream moving storms.
For downstream moving storms and for 7 % and 14 % flume gradients, during higher discharges the mean grain-size of the transported sediments almost equalled that of the original soil (horizontal line in graphs – Fig. 4b and c), which defined an upper limit for the generated sediment size. Mean grain-size dropped strongly for the last part of the recession limb of the hydrograph. However, for downstream moving
events and the surface gradient of 2 %, the maximum mean grain-size of the transported sediments occurred later than the peak runoff discharge. For this surface gradient, the mean grain-size of the transported sediments was smaller than that of the original soil.
For upstream moving storms it was observed that the mean grain-size of the transported sediments was much higher
2612 J. L. M. P. de Lima et al.: Patterns of grain-size temporal variation of sediments
de Lima et al. – NHESS - Grain-size patterns of sediments generated by moving storms
23
1
Fig. 5.
Evolution over time of mean grain-size of transported sediments and runoff discharge, during each
2
laboratory run, for storms moving downstream (left) and upstream (right) for surface gradients of 2%,
3
7%, and 14%. Grain-size data are for four independent repetitions (R1, R2, R3 and R4); broken line
4
represents the regression line through these four repetitions.
5
Fig. 5. Evolution over time of mean grain-size of transported sediments and runoff discharge, during each laboratory run, for storms moving
downstream (left) and upstream (right) for surface gradients of 2 %, 7 %, and 14 %. Grain-size data are for four independent repetitions (R1, R2, R3, and R4); broken line represents the regression line through these four repetitions.
during the recession limb of the hydrograph. This led to a loop in the curve that was not so clearly observed in down-stream moving storms (Fig. 4).
As occurs for downstream moving storms tests, the mean grain-size of the transported sediments yielded from up-stream moving storms was further away from the mean grain-size of the original soil as surface slope increased (i.e. smaller grain-size). The maximum grain-size was attained for higher discharge.
The same data presented in Figs. 6 and 4 – top, particu-larly the mean grain-size of sediment-loss and discharge, is in Fig. 5 – plotted against time for downstream and upstream moving storms. The plot is used to confirm the occurrence of time lags between the occurrence of peak discharge and maximum mean grain-size of the transported sediments.
For all gradients tested, with increasing discharge it can be seen that, for certain discharges, the associated mean sed-iment size was coarser during the initial phase of the test than
J. L. M. P. de Lima et al.: Patterns of grain-size temporal variation of sedimentsde Lima et al. – NHESS - Grain-size patterns of sediments generated by moving storms 2613
24 1
2
Fig. 6. Schematic representation of the location of the nozzle, in time, with respect to the soil flume, 3
during the experimental procedure, for the two directions of moving storm (downstream and upstream). 4
Milestones of changing-trends in sediment yield grain-size are identified. 5
6
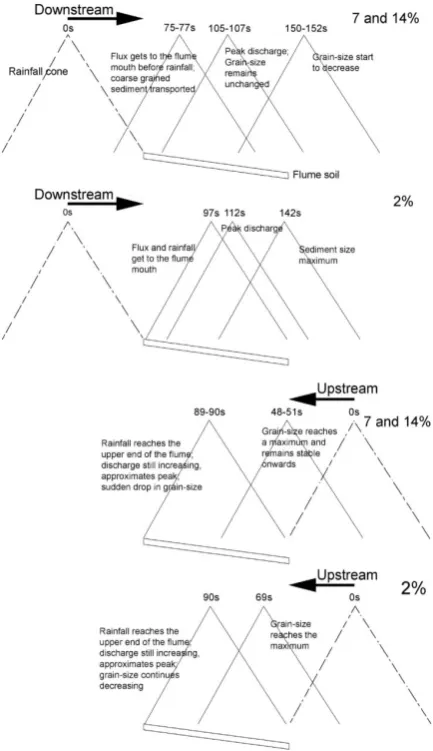
Fig. 6. Schematic representation of the location of the nozzle, in
time, with respect to the soil flume, during the experimental proce-dure for the two directions of moving storm (downstream and up-stream). Milestones of changing-trends in sediment yield grain-size are identified.
along the following phases (Fig. 5d, e and f). It was possible to recognize rising and receding limbs in the discharge rates versus grain-size curve, in which the rising branch was al-ways related to coarser grain-sizes than the receding branch. This difference attenuated in the 2 % slope experiments.
Taking into account the velocity of the moving rainstorm (1.97 m min−1)and the length of the soil channel (3 m), the time of sudden drop in the mean grain-size of sediments gen-erated by downstream storms (approximately 150 s) was the same as the time required for the passage of the vertical that contained the nozzle to reach the flume channel outlet. The decay of the sediment mean grain-size was more abrupt for the downstream moving storms (whatever the slope), which also typically showed higher peak discharges and steep rising and receding limbs.
25
1
2
Fig. 7 - Two-dimensional drop paths of a 1-mm drop ejected in different directions with a velocity of 5
3
m s-1, in still air. The slope of the receiving plane is 10% (adapted from de Lima et al., 2002).
4
5
2 0.5 0 1 0 3 -1 1.0 1.5 Distance (m) He ig h t (m ) Flume surface Drop path Nozzle 2 0.5 0 1 0 3 -1 1.0 1.5 Distance (m) He ig h t (m ) Flume surface Drop path Nozzle 2 0.5 0 1 0 3 -1 1.0 1.5 Distance (m) He ig h t (m ) Flume surface Drop path NozzleFig. 7. Two-dimensional drop paths of a 1-mm drop ejected in
dif-ferent directions with a velocity of 5 m s−1, in still-air. The slope of the receiving plane is 10 % (adapted from de Lima et al., 2002).
The out-of-phase evolution of grain-size and discharge observed for downstream experiments with 2 % gradient (Fig. 5a; see time lag between maximum discharge and max-imum mean grain-size) may be related to detachment and deposition processes along the flume channel throughout the experiment. Deposition in the downstream and upstream moving storm movement occurs when the raindrop related turbulence ceases after rain stops (i.e. direct rainfall im-pact of drops on overland sheet stops and consequently stop-ping splash), corresponding to the recession limb of the hy-drograph. On the one hand, it is usually recognized that relatively large amounts of soil particles cannot be trans-ported by raindrop splashes under windless rain (e.g. Erpul et al., 2004a). However, in some circumstances, depend-ing on factors which include soil characteristics, slope, and energy dissipated when raindrops impact the soil surface, large amounts of sediment can be transported by raindrop-impacted overland flow in windless conditions (e.g. Kinnell, 1981; 2009a, b). On the other hand, the splash-saltation pro-cess can cause net transportation in the prevailing wind di-rection since variations in splash-saltation trajectory due to the wind are expected in wind-driven rain (e.g. Erpul et al., 2004a). The fall vector of raindrops not only affects the soil detachment but also the shallow flow hydraulics (e.g. Erpul et al., 2004b). However, in fact, the experiments described in this work do not entirely represent the conjugated action of wind and rain (typically called wind-driven rain). The labo-ratory experiments were performed without wind, and there-fore there was no added horizontal wind component.
Figure 6 expresses an attempt to identify specific instants during the rainfall-runoff event, where variations of grain-size could be identified. The objective of this figure was to assist in the interpretation of Figs. 3 to 5. The posi-tion of the nozzle over the soil flume, defining the distribu-tion of rainfall on the soil surface, had an influence on the grain-size distribution of the transported sediments. When the nozzle-vertical left the flume, changes in sediment prop-erties occurred because of a reduction of the direct impact
2614 J. L. M. P. de Lima et al.: Patterns of grain-size temporal variation of sediments of raindrops on the overland flow sheet (disturbed flow). It
was under the nozzle-vertical that the highest intensities were measured.
The issue of the angle of inclination of the trajectory of drops generated by nozzles is difficult to solve. All exper-iments using nozzles conducted in recent decades have had the same problem (for both static and moving storms).
The scheme in Fig. 6 is not an exact illustration of the drop trajectory and impact angle of the drops on the hedge of the wetted area. In fact, the falling drops hit the soil surface at inclination angles that are much smaller than represented in this figure, as shown in Fig. 7. It is observed that the angles of inclination of the trajectories of drops at impact, measured from the vertical, increase as the distance to the nozzle in-creases, (Fig. 7). Thus, larger angles of inclination of the trajectories of drops are observed in areas where the rainfall is less intense. Areas with higher rainfall intensity have ap-proximately vertical fall drop trajectories.
4 Conclusion and discussion
This paper identifies significant differences in soil losses as-sociated with storms moving in different directions (down-stream and up(down-stream) and interprets the results through a de-tailed analysis of nearly 300 grain-size curves. The study aims at getting a better insight into the processes induced by these types of storms.
The results of laboratory experiments show that down-stream moving storms produce more soil loss than updown-stream moving storms. The pattern of sediment grain-size evolution shows a clear dependence on the direction of storm move-ment. For downstream-moving storms, a strong relationship between overland flow discharge and mean sediment size is found. For a particular discharge, the mean grain-size of sed-iments transported during the rising limb of the hydrograph is always coarser than during the recession limb.
The evolution patterns of mean grain-size distribution of transported sediments by overland flow are only partially consistent with the evolution of overland discharge. Gen-erally, under higher discharge the transported sediment tends to be coarser. For lower slopes, the available energy is likely to be insufficient to carry the coarser particles, regardless of rainfall intensity, and the coarser particles tend to remain on the soil surface. Downstream moving storms have greater peak discharges and can more easily mobilize particle sizes present on the soil surface. Regardless of the slope and type of moving rainstorm, the maximum mean grain-size of trans-ported solids is bounded by the mean grain-size of the orig-inal soil, which constitutes an upper limit for the size of the transported material.
This study is mainly focused on the consequences of the spatial and temporal distribution of rainfall events, as a result of the rainfall simulator displacement, which is one of the main factors affecting runoff and sediment transport. This
type of study should also be conducted in small drainage basins to validate the findings on larger scales. At this time it is not possible to discuss scale issues related to these pro-cesses: namely, the complexity of the surface geometry and length of the slopes on a natural basin in contrast with the regular surface of the 3 m long laboratory flume. Consider-able differences are expected on the transport and deposition processes of the eroded material. However, the advantage of conducting laboratory experiments offers the possibility to reduce and constrain the number of variables playing a role in the precipitation-overland flow transformation and in the erosion process. Thus, the main objective of this study was attained, which was to understand qualitatively the effect of the direction of moving storms on the relevant processes. We consider that the laboratory conditions made it possible to significantly reduce (most likely not to eliminate) the ef-fect of other main variables which allow the movement of the storm to play a dominant role.
Acknowledgements. This work was funded by the research
projects PTDC/ECM/70456/2006, PTDC/ECM/105446/2008, PTDC/GEO/73114/2006 and HSR-Risk (MIT-Portugal Pro-gramme) of the Portuguese Foundation for Science and Technology (FCT). The experimental simulations were carried out in the Laboratory of Hydraulics, Water Resources and Environment of the Department of Civil Engineering, and the grain-size determi-nations in the Laboratory of Sedimentology of the Earth Sciences Department. Both Laboratories belong to the Faculty of Sciences and Technology of the University of Coimbra (FCTUC), Portugal.
Edited by: A. Mugnai
Reviewed by: one anonymous referee
References
Asadi, H., Ghadiri, H., Rose, C. W., Yu, B., and Hussein, J.: An investigation of flow-driven soil erosion processes at low stream-powers, J. Hydrol., 342, 134–142, 2007.
Beuselinck, L., Hairshine, P. B., Sander, G. C., and Govers G.: Evaluating a multiclass net deposition equation in overland flow conditions, Water Resour. Res., 38, 14.1–14.7, 2002.
Blott, S. J. and Pye, K.: Particle size distribution analysis of sand-sized particles by laser diffraction: an experimental investigation of instrument sensitivity and the effects of particle shape, Sedi-mentology, 53, 671–685, 2006.
Brand˜ao, C. and Rodrigues R.: Precipitac¸˜oes intensas em Portugal Continental para per´ıodos de retorno at´e 1000 anos, Direcc¸˜ao dos servic¸os de recursos h´ıdricos, DSRH-INAG, Lisboa, 17 pp., 1997 (in Portuguese).
Brand˜ao, C., Rodrigues, R., and da Costa, J. P.: An´alise de fen´omenos extremos precipitac¸˜oes intensas em portugal conti-nental, Direcc¸˜ao dos servic¸os de recursos h´ıdricos, DSRH-INAG, Lisboa, 17 pp., 2001 (in Portuguese).
Cerd´a, A., Ib´a˜nez, S., and Calvo, A.: Design and operation of a small and portable rainfall simulator for rugged terrain, Soil Technol., 11, 163–170, 1997.
Chang, C. L.: Influence of moving rainstorms on watershed re-sponses, Environ. Eng. Sci., 24(10), 1353–1360, 2007.
de Lima, J. L. M. P. and Singh, V. P.: The influence of storm move-ment on overland flow – Laboratory experimove-ments under simulated rainfall, in: Hydrologic Modeling, edited by: Singh, V. P., Won Seo, I., and Sonu, J. H., Water Resour. Publications, USA, 101– 111, 1999.
de Lima, J. L. M. P. and Singh, V. P.: Laboratory experiments on the influence of storm movement on overland flow, Phys. Chem. Earth, 28, 277–282, 2003.
de Lima, J. L. M. P., Torfs, P. J. J. F., and Singh, V. P.: A Mathe-matical Model for Evaluating the Effect of Wind on Downward-Spraying Rainfall Simulators, CATENA, 46, 221–241, 2002. de Lima, J. L. M. P., Singh, V. P., and de Lima, M. I. P.: The
influ-ence of storm movement on water erosion: storm direction and velocity effects, Catena, 52, 39–56, 2003.
de Lima, J. L. M. P., Souza, C. S., and Singh, V. P.: Granulomet-ric characterization of sediments transported by surface runoff generated by moving storms, Nonlin. Processes Geophys., 15, 999–1011, doi:10.5194/npg-15-999-2008, 2008.
Dunkerley, D.: Estimating the mean speed of laminar overland flow using dye injection-uncertainty on rough surfaces, Earth Surf. Proc. Land., 26, 363–374, 2001.
Eshel, G., Levy, G. J., Migelgrin, U., and Singer, M. J.: Critical evaluation of the use of laser diffraction for particle-size distri-bution analysis, Soil Sci. Soc. Am. J., 68, 736–743, 2004. Erpul, G., Norton, L. D., and Gabriels, D.: Sediment transport from
interrill areas under wind-driven rain, J. Hydrol., 276, 184–197, 2003.
Erpul, G., Norton, L. D., and Gabriels, D.: Splash-saltation trajec-tories of soil particles under wind-driven rain, Geomorphology, 59(1–4), 31–42, 2004a.
Erpul, G., Gabriels, D., and Norton, L. D.: Wind effects on sediment transport by raindrop-impacted shallow flow, Earth Surf. Proc. Land., 29, 955–967, 2004b.
Friedman, G. M.: Differences in the size distributions of popula-tions of particles among sands of various origins, Sedimentology, 26, 3–32, 1979.
Hairsine, P. B. and Rose, C. W.: Modeling water erosion due to overland flow using physical principles, 1. Sheet flow, Water Re-sour. Res., 28, 237–243, 1992a.
Hairsine, P. B. and Rose, C. W.: Modeling water erosion due to overland flow using physical principles, 2. Rill flow, Water Re-sour. Res., 28, 245–250, 1992b.
Harvey, A. M.: Coupling between hillslopes and channels in upland fluvial systems: implications for landscape sensitivity, illustrated from the Howgill Fells, northwest England, Catena, 42, 225–250, 2001.
Hooke, J.: Coarse sediment connectivity in river channel systems: a conceptual framework and methodology, Geomorphology, 56, 79–94, 2003.
Jonasz, M.: Size, shape, composition and structure of microparticle from light scattering, in: Principles, methods and applications of particle size analysis, edited by: Syvitski, J. P. M., Cambridge University Press, New York, pp. 143-162, 1991.
Kinnell, P. I. A.: Rainfall intensity – kinetic energy relationship for soil loss prediction, Soil Sci. Soc. Am. J., 45, 153–155, 1981. Kinnell, P. I. A.: The influence of raindrop induced saltation on
par-ticle size distributions in sediment discharged by rain-impacted flow on planar surfaces, Catena, 78, 2–11, 2009a.
Kinnell, P. I. A.: The impact of slope length on the discharge of sediment by rain impact induced saltation and suspension. Earth Surf. Process. Land., 34, 1393–1407, 2009b.
Konert, M. and Vandenberghe, J.: Comparison of laser grain-size analysis with pippete and sieve analysis: a solution for the un-derestimation of the clay fraction, Sedimentology, 44, 523–535, 1997.
Krumbein, W. C.: Size frequency distributions of sediments, J. Sed-iment. Petrol., 4, 65–77, 1934.
Krumbein, W. C. and Pettijohn, F. J.: Manual of Sedimentary Pet-rography. Appleton-Century-Crofts, New York, 1938.
Maksimov, V. A.: Computing runoff produced by a heavy rainstorm with a moving center, Soviet Hydrology, 5, 510–513, 1964. Matos, R. and Silva, M.: Estudos de precipitac¸˜ao com aplicac¸˜ao no
projecto de sistemas de drenagem pluvial, Curvas Intensidade-Durac¸˜ao-Frequˆencia da Precipitac¸˜ao em Portugal, ITH 24, Lab-orat´orio Nacional de Engenharia Civil, LNEC, Lisboa, 1986 (in Portuguese).
Morgan, R. P. C.: Soil erosion and conservation, 2nd Edn., Long-man, London, 1995.
Nunes, J. P., de Lima, J. L. M. P, Singh, V. P., de Lima, M. I. P., and Vieira, G. N.: Numerical modelling of surface runoff and erosion due to moving rainstorms at the drainage basin scale, J. Hydrol., 330, 709–720, 2006.
O’Farrell, C. R., Heimsath, A. M., and Kaste, J. M.: Quantify-ing hillslope erosion rates and processes for a coastal California landscape over varying timescales, Earth Surf. Proc. Land., 32, 544–560, 2007.
Parsons, A. J. and Stone, P. M.: Effects of intra-storm variations in rainfall intensity on interrill runoff and erosion, Catena, 67, 68–78, 2006.
R¨omkens, M. J. M., Prasad, S. N. and Gerits, J. J. P.: Soil erosion modes of sealing soils: a phenomenological study, Soil Technol., 11, 31–41, 1997.
R¨omkens, M. J. M., Helming, K., and Prasad, S. N.: Soil erosion under different rainfall intensities, surface roughness, and soil water regimes, Catena, 46, 103–123, 2001.
Rose, C. W., Yu, B., Ghadiri, H., Asadi, H., Parlange, J. Y., Hogarth, W. L., and Hussein, J.: Dynamic erosion of soil in steady sheet flow, J. Hydrol., 333, 449–458, 2006.
Seeger, M.: Uncertainty of factors determining runoff and erosion processes as quantified by rainfall simulations, Catena, 71, 56– 67, 2007.
Sharon, D.: The distribution of hydrologically effective rainfall in-cident on sloping ground, J. Hydrol., 46, 165–188, 1980. Singh, V. P.: Effect of the direction of storm movement on planar
flow, Hydrol. Process., 12, 147–170, 1998.
Wentworth, C. K.: A scale of grade and class terms for clastic sedi-ments, J. Geol., 30, 377–392, 1922.
Willems, P.: A spatial rainfall generator for small spatial scales, J. Hydrol., 252, 126–144, 2001.
Wilson, C. B., Valdˆes, J. B., and Rodrigues-Iturbe, I.: On the influ-ence of the spatial distribution of rainfall on storm runoff, Water Resour. Res., 15, 321–328, 1979.
Yen, B. C. and Chow, V. T.: A study of surface runoff due to mov-ing rainstorms. Hydraulic Engineermov-ing Series 17, Department of Civil Engineering, University of Illinois, Urbana, USA, 1968.