ENHANCING SOLUBILITY AND DISSOLUTION OF MEFENAMIC ACID BY FREEZE DRYING USING β-CYCLODEXTRIN
5
0
0
Full text
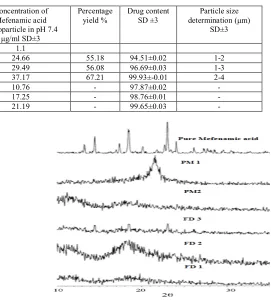
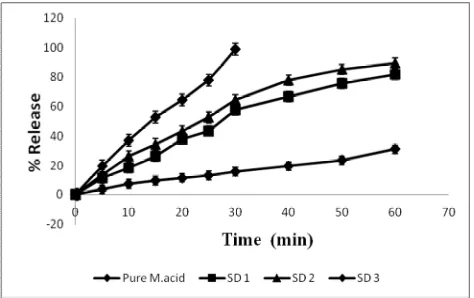
(2) Kulkarni Parthasarathi Keshavarao et al. IRJP 2011, 2 (9), 146-150 Evaluation of microparticle Determination of percentage yield and Drug content The percentage yield of each formulation was determined according to the total recoverable final weight of microparticle and the total original weight of Mefenamic acid. Microparticles (50 mg) were triturated with 10 ml of water. Allowed to stand for 10 min with occasional swirling and methanol was added to produce 100 ml. After suitable dilution, samples were measured at 334 nm. Differential scanning calorimeter (DSC) A DSC study was carried out to detect possible polymorphic transition during the crystallization process. DSC measurements were performed on a DSC DuPont 9900, differential scanning calorimeter with a thermal analyzer. Fourier transforms infrared spectroscopy (FTIR) The FTIR spectral measurements were taken at ambient temperature using a Shimadzu, Model 8033 (USA). Samples were dispersed in KBr powder and the pellets were made by applying 5 ton pressure. FTIR spectra were obtained by powder diffuse reflectance on FTIR spectrophotometer. Powder X-ray diffraction analysis X-Ray powder diffraction patterns were obtained at room temperature using a Philips X’ Pert MPD diffract-meter, with Cu as anode material and graphite monochromatic, operated at a voltage of 40 mA, 45 kV. The process parameters used were set as scan step size of 0.0170 (2q). Scanning electron microscopy (SEM) Scanning electron microscopic (Joel- LV-5600, USA, with magnification of 250x) photographs were obtained to identify and confirm surface nature of the microparticle. Mechanical Properties Tensile strength of microparticle was determined by compressing 500 mg of crystals using hydraulic press at different ton/cm2 for 1 min. The compacts stored in desiccators for overnight to allow elastic recovery. The thickness and diameter were measured for each compact. The hardness of each compact was then measured using Pfizer hardness tester. The tensile strength (σ) of the compact (ton/cm2) was calculated using following equation. σ = 2F/π Dt Where, F, D and t are hardness (ton), compact diameter (cm) and thickness (cm), respectively. Each sample was determined in triplicate. Determination of solubility Drug solubility was determined by adding excess amounts of pure Mefenamic acid, its physical mixture and microparticle to water and pH 7.4 phosphate buffer at 37 ± 0.5°C, respectively. The solutions formed were equilibrated under continuous agitation for 24 h and passed through a 0.8 μm membrane filter to obtain a clear solution. The absorption of then samples was measured using UV spectrophotometric method (UV 1601 A Shimadzu, Japan at 334 nm and the concentrations in μg/ml were determined. Each sample was determined in triplicate. Dissolution studies of microparticle The dissolution of Mefenamic acid commercial sample, microparticle and physical sample was determined by using USP dissolution apparatus XXIV-Type II (Electro Lab, Mumbai). Dissolution medium was 900 ml pH 7.4 phosphate buffer. The amount of dissolved drug was determined using UV spectrophotometric method (UV 1601 A Shimadzu, Japan) at 334 nm. Each sample was determined in triplicate. RESULTS The Freeze dried microparticle formulations collected and they were free-flowing and white in color. The percentage yield of Freeze. dried microparticle of different ratio of β-cyclodextrin and Mefenamic acid was showed in Table no 3. This small yield can be increase by adding of solid substance or in large scale production as it was small scale preparation. Drug content for the Freeze dried microparticle of different ratio of β-cyclodextrin and Mefenamic acid were showed in Table no 3. DSC curves obtained for pure material, physical mixtures and microparticle are showed Fig. 1. In DSC curve, pure Mefenamic acid had a sharp endothermic peak at 332°C that corresponded to the melting point of Mefenamic acid. FT-IR is a very powerful technique in detecting presence of interaction in drug-carrier microparticle. The appearance or disappearance of peaks and/or the shift of their positions are often an indication of interactions such as hydrogen bonding. Mefenamic acid contains characteristic peaks at 1255 cm-1 (-OH group bending and vibrations of COOH), 1647 cm-1 (N-H stretching vibration), 1572 cm-1 (C=O stretching), 1504 cm-1 (Aromatic C-H plane deformation), 1163 cm-1 (Aromatic-O-CH3) and 757(Aromatic C-C vibration for ortho substitution). The carbonyl group is more favorable in hydrogen bonding over the tertiary amine because of the steric hindrance of the latter group. The spectrum of physical mixture shown in Figure 2 was simple summation of pure drug and β-cyclodextrin, revealing no perceptible interaction between the two components. Little evidence could be deduced from the carbonyl band region, probably due to the strong absorption of the carbonyl group of the polymer. X-Ray diffraction was used to analyze potential changes in the inner structure of Mefenamic acid nanocrystal during the formulation. The extent of such changes depends on the chemical nature and physical hardness of the active ingredient. The powder X-ray diffraction patterns of the unprocessed Mefenamic acid and β-cyclodextrin, their different physical mixture and microparticle formed by Freeze drying showed in Fig. 3. The characteristic peaks of the Mefenamic acidappeared in the 2θ range of 10–400 indicating that the unprocessed Mefenamic acid was a crystalline material. The SEM image of the A) Mefenamic acid, B) their physical mixture and C) microparticle are shown in Fig. 4. Microparticle exhibited superior compressibility characteristics compared to Physical mixture and pure sample of Mefenamic acid drug crystals (fig. 5). It could be due to the fact that during the process of compression fresh surfaces are formed by fracturing crystals. Surface freshly prepared by fracture enhanced the plastic inter particle bonding, resulting in a lower compression force required for compressing the microparticle under plastic deformation compared to that of single crystal. The solubility of Mefenamic acid, their physical mixture and microparticle in water and in pH 7.4 phosphate buffer is shown in Table 3. The dissolution curves of Mefenamic acid in pH 7.4 phosphate buffer shown in Fig. 6. The dissolution rate profiles were plotted as the % release from the different microparticle, physical mixture and pure Mefenamic acid versus time in minute. The rate of dissolution of pure Mefenamic acid was slow Compared with Mefenamic acid from its physical mixtures and different microparticle in 60 min. DISSCUSIONS In DSC study, as the amount of β-cyclodextrin increased in microparticle, the size of the Mefenamic acid endothermic peak was reduced. In formulations number Physical mixture 1, 2 and 3, showed no change in Mefenamic acid endothermic peak was observed but dispersed. In case of microparticle, the two melting transitions in the system made up of Mefenamic acid and βcyclodextrin indicated that both materials formed a separate phase. It was found that Mefenamic acid was in a crystalline state in the microparticle. The position of the melting peak of β-cyclodextrin. INTERNATIONAL RESEARCH JOURNAL OF PHARMACY, 2(9), 2011.
(3) Kulkarni Parthasarathi Keshavarao et al. IRJP 2011, 2 (9), 146-150 remained largely unchanged, while that of Mefenamic acid shifted depending on the concentration. In formulation of microparticle FD 1, 2 and 3, the endothermic peak of Mefenamic acid was no longer observed. This could be because Mefenamic acid was molecularly or amorphously dispersed in the phases. Suggesting that the absence of crystallinity or presence of amorphous state in the microparticle. On the other hand, the physical mixtures of Mefenamic acidand βcyclodextrin showed an apparent endothermic peak for Mefenamic acid at 332- 329°C. In contrast, FTIR spectra of Mefenamic acid, physical mixture and Freeze-dried microparticle sample display different absorption bands in 3200– 3600 cm_1, with the N–H or O–H stretching vibration completely lost (Fig. 2). This observation, combined with the XRD result, can be attributed to the formation of hydrogen bonding between OH or NH group of Mefenamic acid with the carbonyl group of β-cyclodextrin. The prepared microparticle containing Mefenamic acid with β-cyclodextrin showed the characteristic peaks of the drug and the β-cyclodextrin. This suggests the absence of any interaction between the drug and β-cyclodextrin. In XRD thermograph of pure Mefenamic acid powder, physical mixture and prepared microparticle showed that crystallinity of Mefenamic acid in the formulations was not affected significantly. The x-ray diffraction pattern of the pure drug exhibit its characteristic diffraction peaks at various diffraction angles indicating the presence of crystallinity. The diffraction study of the different physical mixture of drug and β-cyclodextrin showed the peak corresponding to the crystalline drug molecules present in the mixture, although their intensity was lower than pure drug may be due to the high percentage of β-cyclodextrin & drug ratio employed. The diffraction pattern of the different Freeze dried microparticle of drug showed absence, broadening, and reduction of major Mefenamic acid diffraction peaks indicating that mostly an amorphous form (disordered state) existed in the microparticle. The Mefenamic acid particles in the physical mixture were broken into much smaller ones, irregular size and result show that Mefenamic acid particles could be seen in the physical mixture and on the other hand, the shape of microparticle were small in size and micrograph of microparticle shows a matrix formation in which no crystals of Mefenamic acid could be seen. Tensile strength of the same ratio of microparticle and physical mixture (1:3%) showed that tensile strength of microparticle higher than physical mixture. But tensile strength of microparticle ratio of 1:3 % (FD 3) show much higher than any ratio of microparticle, physical mixture (PM 3) and pure sample this may be due to the increasing in the plastic inter particle bonding of microparticle. These results show that the solubility of Mefenamic acid increased on increasing the concentration of β-cyclodextrin in microparticle. The solubility of Mefenamic acid from the microparticle was significantly higher than from it is physical mixture, when the microparticle and physical mixture contained the same weight ratio of Mefenamic acid i.e. 1:3% (FD 3 & PM 3). It was found that the solubility of Mefenamic acid from microparticle much higher than physical mixture of same % in pH 7.4 phosphate buffer as well as in water. The higher solubility of Mefenamic acid from microparticle may be due to the increased in surface area, wet-ability of microparticle and solubilizing effect of the β-cyclodextrin as carrier to microparticle. The % release of microparticle containing ratio of 1:3(FD 3) showed high release compare to other microparticle containing different ratio, its physical mixture and pure Mefenamic acid. There was a significant difference in the drug release between the microparticle, physical mixture and pure sample. The increase in dissolution from the physical mixtures was probably due to the wetting and solubilizing effect of the β-cyclodextrin, which could reduce the. interfacial tension between the Mefenamic acid and the dissolution medium, thus leading to a higher dissolution rate. The large surface area of the resulting microparticle should result in an enhanced dissolution rate and thereby improve the bioavailability. CONCLUSION In this present study, an increased solubility and dissolution rate of Mefenamic acid were achieved by Freeze dried microparticle using different ratio of β-cyclodextrin. Freeze dried microparticle exhibited decreased crystallinity compare to its physical mixture and pure Mefenamic acid. DSC and XRD studies showed that there is no change in the crystal structure of Mefenamic acid during the Freeze drying process i.e., polymorphism has not occurred. The solubility and dissolution of the Freeze dried microparticle was improved significantly compared with its physical mixture and pure sample. The drug dissolution rate from microparticle was highest at the polymer-drug ratio of 1:3 w/w % (FD 3). Hence this Freeze drying technique was very simple method & can be used for formulation of tablets of Mefenamic acid by direct compression without further process like (mixing, granulation) with directly compressible tablet excipients. ACKNOWLEDGEMENT The authors are thankful to Micro labs, Bangalore, India for the gift sample of Mefenamic acid and β-cyclodextrin, and Principal, J.S.S. College of Pharmacy, Mysore for providing facilities to carry out this work. REFFRENCEES 1. Sato J, Owada E, Ito K, Niida Y, Wakamatsu A, Umetsu M. Simple rapid and sensitive reversed-phase high-performance liquid-chromatographic method for the determination of mefenamic- acid in plasma. J. Chromatogr.-Biomed. Appl 1989; 493: 239–243. 2. Grant. SM, and Clissold. SP, Mefenamic acid: a review of its pharmacodynamic and pharmacokinetic properties, and therapeutic use in superfi cial and systemic mycoses. Drugs, 1989; 37: 310-344. 3. Beule D, Van K and Gestel V. Pharmacology of Mefenamic acid. Drugs 61 (Suppl. 1), 2001; 27-33. 4. Verreck. G and Den MV: Characterization of solid dispersions of Mefenamic acidand hydroxypropylmeth ylcellulose prepared by melt extrusion–part I. Int. J. Pharm. 2003; 251: 165-174. 5. Hong JY, Kim JK and Song YK. A new self-emulsifying formulation of Mefenamic acidwith improved dissolution and oral absorption. J. Control. Release, 2006; 110: 332- 338. 6. Peeters J, Neeskens P and Tollenaere. JP. Characterization of the interaction of 2hydroxypropyl-b-β-cyclodextrin with Mefenamic acidat pH 2, 4 and 7. J. Pharm. Sci, 2002; 91, 1414-1422. 7. Amidon. GL, Lennernas. H and Shah VP. Theoretical basis for a biopharmaceutical drug classification: the correlation of in vitro drug product dissolution and in vivo bioavailability. Pharm. Res., 1995; 12, 413-420. 8. Dressman JB, Amidon G, Reppas C and Shah VP. Dissolution testing as a prognostic tool for oral drug absorption: immediate release dosage forms. Pharm. Res., 1998; 15: 11 -22. 9. Dressman J, Butler J and Hempenstall J. The BCS: where do we go from here? Pharm. Tech, 2001; 25: 68-76. 10. Kapsi SG and Ayres JW. Processing factors in development of solid solution formation of Mefenamic acidfor enhancement of drug dissolution and bioavailability. Int. J. Pharm., 2001; 229:193-203. 11. Serajuddin AT. Solid dispersion of poorly watersoluble drugs: early promises, subsequent problems, and recent breakthroughs. J. Pharm. Sci., 1999; 88: 10581066. 12. Sekiguchi K and Obi N. Studies on absorption of eutectic mixture. I. A comparison of the behavior of eutectic mixture of sulfathiazole and that of ordinary sulfathiazole in man. Chem. Pharm. Bull. 1961; 9: 866-872. 13. Chiou WL, Riegelman AS. Pharmaceutical applications of solid dispersion systems. J. Pharm. Sci. 1971; 60: 1281- 1302. 14. Maury M, Murphy K, Kumar S, Shi L and Lee G. Effects of process variables on the powder yield of Freeze-dried trehalose on a laboratory Freeze-dryer. Eur. J. Pharm. Biopharm., 2005; 59: 565-573. 15. Amal A. E and Ebtessam A E: Dissolution of ibuprofen from Freeze dried and Freeze cooled particles. pak. j. pharm. sci. 2010; 23(3), 284-290. 16. Maa YF, Nguyen PA, Sit K and Hsu CC. Freeze drying performance of benchtop Freeze dryer for protein aerosol powder preparation. Biotech. Bioeng. 1998; 60: 301-309.. INTERNATIONAL RESEARCH JOURNAL OF PHARMACY, 2(9), 2011.
(4) Kulkarni Parthasarathi Keshavarao et al. IRJP 2011, 2 (9), 146-150 Numbers 1 2 3 4 5 6. Table 1 Freeze-Dried microparticle formulation Different ratio of β-cyclodextrin and Formulation numbers drug (w/w) FD 1 1:1 1:2 FD 2 1:3 FD 3 PM 1 1:1 1:2 PM 2 1:3 PM 3. Table 2 Freeze-Drying Parameters Inlet temperature Feed pump Vacuum Aspirator level (°C) speed % (mm Wc) (kg/cm2) 115 12 -75 2.0. Table 3 Solubility of Mefenamic acid microparticle at different ratios of β-cyclodextrin in water and pH 7.4 phosphate buffer. Different formulations containing polymer: Drug ratio(w/w) Pure drug FD 1 FD 2 FD 3 PM 1 PM 2 PM 3. Concentration of Mefenamic acid microparticle in water (μg/ml) SD±3 0.045 01.27 16.35 24.19 4.23 8.19 11.43. Concentration of Mefenamic acid microparticle in pH 7.4 μg/ml SD±3 1.1 24.66 29.49 37.17 10.76 17.25 21.19. Fig 1 Shows DSC Spectrum of pure Mefenamic acid & it’s different ratio of physical mixture and microparticle. Percentage yield %. Drug content SD ±3. Particle size determination (μm) SD±3. 55.18 56.08 67.21 -. 94.51±0.02 96.69±0.03 99.93±-0.01 97.87±0.02 98.76±0.01 99.65±0.03. 1-2 1-3 2-4 -. Fig 3 shows XRD Spectrum of pure Mefenamic acid& different ratio of physical mixture and microparticle. Fig 2 Shows FT-IR Spectrum of pure Mefenamic acid, its different ratio of physical mixture and microparticle Fig 4 Shows SEM photographs of different sample of Mefenamic acid.. INTERNATIONAL RESEARCH JOURNAL OF PHARMACY, 2(9), 2011.
(5) Kulkarni Parthasarathi Keshavarao et al. IRJP 2011, 2 (9), 146-150. Fig 5 Shows Tensile strength of pure Mefenamic acid, physical mixture and microparticle. Figure 6 Shows Dissolution of pure Mefenamic acid and its different ratio of Physical mixture. Figure 7 Shows Dissolution of pure Mefenamic acid and its different ratio of microparticle. Source of support: Nil, Conflict of interest: None Declared. INTERNATIONAL RESEARCH JOURNAL OF PHARMACY, 2(9), 2011.
(6)
Figure
Related documents
We aim to describe the phenotypes of four children with mutations in the SLC19A3 gene, comparing their clinical, biochemical, radiological and genetic data with all of the
AR: Airway Resistance; BHR: Bronchial Hyperresponsiveness; ECP: Eosinophil Cationic Protein; EI: Eosinophilic Inflammation; EP: Eosinophils Percentages in nasal lavage fluid;
Stephen Balsky at the above address. A case of a 74-year-old woman complaining of pain, loss of strength and diminished range of motion in her left wrist is presented. These
Features of the course include an intensive module on innovation delivered by Teagasc (the Irish Agriculture and Food Agency) in Semester 2 and the development of a business
The article presents the results of studies on freeze-thaw durability and hydraulic conductivity of selected aggregates applied in the construction of green roof drainage
Thus the cost –sharing policy of the 1980’s and 1990’s which pushed responsibility for construction of physical facilities and provision of learning and teaching materials to
The apparent benefit of antenatal glucocorticoid therapy in the prevention ofBPD is consistent with previous studies that demonstrated beneficial ef- fects of steroid therapy in
