© 2017 IJSRST | Volume 3 | Issue 8 | Print ISSN: 2395-6011 | Online ISSN: 2395-602X Themed Section: Science and Technology
Studies on Seasonal and Habitat Variations in Serum Biochemical
Composition of Labeo Boga
Roopma Gandotra, Monika Sharma, Sapana Jangral
Department of Zoology, University of Jammu, Jammu, IndiaABSTRACT
The present study focussed on determining the stress response of fish to the changing season and habitat. The biochemical determinants were analysed in the fish from the two distinct sections(upstream and downstream section) of River Tawi. Results obtained revealed the significant(p<0.05) stress response of fish in the section 2(downstream polluted section) as compared to the section 1(upstream non polluted section) and hence indicated the degrading condition of section 2 as compared to section 1. Physico-chemical analyses of water was conducted which revealed the degraded status of section 2 as reflected from pH and DO content observations for section 2 as compared to section 1. Glucose content in fish serum at section 1 ranged from 51.99±0.04mg/dl – 112.31±0.04mg/dl while for the section 2, glucose content ranged from 61.69±0.04mg/dl – 121.54±0.04mg/dl. Also, Cholesterol concentration ranged from 141.00±0.06mg/dl–199.40±0.01mg/dl for section1;while 159.54±0.05mg/dl – 232.50±0.02mg/dl for section 2. Alkaline Phosphatase, SGOT, SGPT content also showed variation in fish serum between the two sections. The values obtained for the Alkaline phosphatase, SGOT and SGPT for the section 1 ranged from 62.00±0.02U/L – 97.32±0.02U/L, 19.50±0.01U/L – 34.30±0.04U/L and 20.20±0.02U/L – 36.84±0.06U/L respectively; however for the section 2 their values ranged from 76.54±0.01U/L – 130.52±0.01U/L, 29.80± 0.05U/L- 39.50±0.03U/L and 29.50±0.03U/L – 43.25±0.01U/L respectively. LDH content also observed to be higher in Section 2 than the section 1 for whole studied period. These studied biochemical parameters also showed significant variation with the changing season, showing the maximum stress response during the summer months when the aquatic conditions were not favourable. Thus from the results , it can be concluded that such observed variations in serum biochemical constituents reflected the stress response of fish and thus can be used to assess the health of habitat and fish.
Keywords: Physico-Chemical Analyses, Habitat Variations, Labeo Boga, SGOT, SGPT, LDH, APHA
I.
INTRODUCTION
Fish is the main source of animal protein and therefore has an important role to play in the diets of human beings. Water pollution is recognized globally as a potential threat and it seriously affects the life of humans and other animals interacting with the aquatic environment. Fish in natural and marine water are exposed to various pollutants, pathogens, xenobiotic substances which causes the stress to aquatic organisms. Fresh water environment are mostly subjected to variations in the environmental factors such as pH, temperature, light peneteration etc. Fish plays an important role in monitoring of water quality because they respond with great sensitivity to direct and indirect changes in aquatic environment (Borkovic et al 2008). Fishes are intimately associated with aqueous
often measured(Venkataramana et al 2006). The activities of some enzymes like SGOT, SGPT, LDH also indicates the impact of pollutants on fish( Bucher and Hofer , 1990).These enzymes are normally found with in cells of liver, heart, gills and kidney (Shalaby, 2009) but their increase in serum indicates the tissue injury or organ dysfunction(Wells et al, 2006). The biochemical analysis can help in understanding the better health conditions of fish in natural habitat. Different factors such as season, stressors, physico-chemical parameters of water, fish specie etc affect the serum biochemical parameters. Blood biochemistry parameters can be used to detect the health of fish. These studies can be helpful in understanding the health condition of fish in their natural habitat.
Water pollution is recognized globally as a potential threat to both human and other animal populations which depends for their survival on aquatic environment. River Tawi is an important lifeline for Jammu city and its outskirts. It serves as a source of drinking water as well as a source of nutritious food (fish) to the residents of jammu region but it is increasingly getting polluted. The important sources of water pollution are domestic sewage, drainage and discharges from different sources which pollute the river and other major water resources (Maruthanayagam, 2004). Labeo boga is an important commercial fresh water fish commonly found in the rivers and streams of jammu region. Thus, Knowledge of it’s biochemical composition is important for human dietary. Such studies also furnishes data for evaluating the health status of fish and hence of aquatic habitat.
II.
METHODS AND MATERIAL
During the present course of investigation, the samples of Labeo boga (12 ±1.5cm L, 120±15g W) were collected from Aug 2015-Jul2016 from upstream
section( Nagrota-Section 1, Latitude 32º 46’,Longitude 74º 54’) with the clear and fast flowing water and
downstream section(Gujjar nagar – Section 2 , Latitude 32º 43’, Longitude 74º 52’) with slow moving and polluted water due to municipal solid waste discharge, sewage discharge, cremation wastes, religious wastes, ill treated drainage and other anthropogenic wastes. Distance between the two stations was more than 10 kms. Water quality parameters (Water temperature, pH, DO ) were analysed by using the standard methods prescribed by APHA(1985). Also, Blood samples were drawn from caudal vein using hypodermic needle in serum collecting activator tube and then blood was allowed to clot and serum then separated for studying some biochemical constituents. The collected blood samples were then subjected to biochemical analysis using standard methods. Glucose content was measured by Correll and Langley, 1956 method. Alkaline phosphatase content was measured by Hillman, 1971 method. For SGOT and SGPT, Bergmeyer et al, 1986 method was used. Stadman, 1957 method was used for determining Cholesterol levels. For Lactate Dehydrogenase(LDH), Henry et al ,1960 method was used.
III.
RESULTS AND DISCUSSION
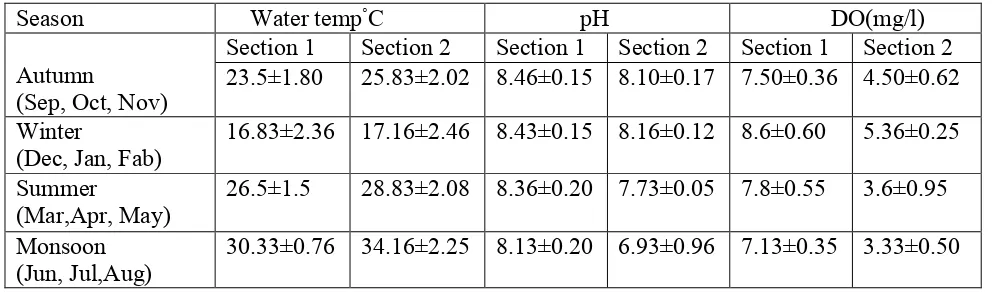
Table 1 showing the Physico chemical parameters of water from upstream non polluted section(section 1) and downstream polluted section(Section 2). Values are expressed as Mean±S.D
Season
Water temp
◦C
pH
DO(mg/l)
Autumn
(Sep, Oct, Nov)
Section 1
Section 2
Section 1
Section 2 Section 1 Section 2
23.5±1.80
25.83±2.02 8.46±0.15 8.10±0.17 7.50±0.36 4.50±0.62
Winter
(Dec, Jan, Fab)
16.83±2.36 17.16±2.46 8.43±0.15 8.16±0.12 8.6±0.60
5.36±0.25
Summer
(Mar,Apr, May)
26.5±1.5
28.83±2.08 8.36±0.20 7.73±0.05 7.8±0.55
3.6±0.95
Monsoon
(Jun, Jul,Aug)
Months Glucose Section 1 Section 2 Cholesterol Section 1 Section 2 LDH Section 1 Section 2 Alkaline Phosphatase Section 1 Section 2
Sep 77.65±0.02 89.60±0.0
1 168.40±0.01 191.23±0.07 47.00±0.03 52.75±0.03 78.64±0.02 98.64±0.04
Oct 74.39±0.01 85.45±0.0
3 160.23±0.02 186.24±0.21 44.25±0.02 51.45±0.03 74.29±0.06 92.45±0.02
Nov 70.54±0.01 81.02±0.0
1 151.43±0.01 173.50±0.14 41.50±0.02 50.00±0.40 71.54±0.04 88.23±0.02
Dec 68.64±0.06 76.65±0.0
4 141.00±0.06 162.80±0.04 39.25±0.04 48.50±0.05 67.63±0.02 81.54±0.04
Jan 51.99±0.04 64.54±0.0
2
146.00±0. 06
159.54±0. 05
42.50±0.0 3
54.21±0.0 1
65.20±0.04 76.54±0.01
Feb 55.45±0.03 61.69±0.0
4 162.30±0.10 171.50±0.07 43.85±0.01 56.50±0.02 62.00±0.02 79.63±0.02
Mar 67.32±0.03 78.23±0.0
1 178.00±0.23 182.25±0.03 49.20±0.01 58.60±0.02 75.20±0.05 88.54±0.02
Apr 84.29±0.01 96.46±0.2
1
182.50±0. 04
198.63±0. 01
53.70±0.0 6
60.64±0.0 4
78.00±0.03 96.44±0.05
May 93.63±0.04 111.20±0.
05 194.20±0.04 221.54±0.03 57.23±0.03 63.20±0.03 84.00±0.03 112.41±0.03
June 112.31±0.0
4 121.54±0.04 199.40±0.01 232.50±0.02 61.50±0.04 64.25±0.02 97.32±0.02 130.52±0.01
July 92.52±0.02 99.54±0.0
2 176.52±0.05 204.25±0.04 54.65±0.2 58.24±0.14 86.25±0.04 120.51±0.05
Aug 83.64±0.01 94.24±0.0
1
171.20±0. 02
197.63±0. 04
52.50±0.0 1
57.00±0.0 2
80.10±0.06 114.62±0.0 2
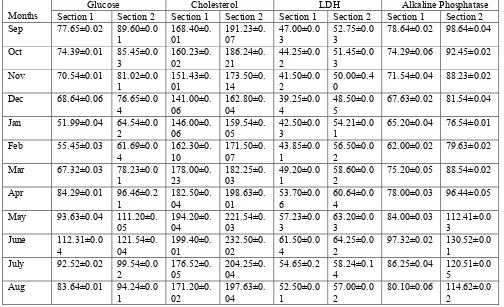
Table 2. showing the levels of Glucose, Chlolesterol,LDH, Alkaline Phosphatase, in serum of Fresh water fish Labeo boga from upstream non polluted section(Section 1) and downstream polluted section(Section 2).
Values of Glucose, LDH , Cholesterol are expressed as mg/dl while values of Alkaline phosphatase are expressed as U/L.
Months SGOT SGPT
Section 1 Section 2 Section 1 Section 2
Sep 26.54±0.04 32.50±0.05 28.65±0.12 34.30±0.01
Oct 23.20±0.04 31.54±0.06 26.50±0.01 32.00±0.04
Nov 22.50±0.06 30.90±0.06 24.00±0.04 29.50±0.03
Dec 19.50±0.01 29.80±0.05 23.50±0.06 31.91±0.23
Jan 23.50±0.05 31.50±0.03 20.20±0.02 33.52±0.12
Feb 26.00±0.05 33.00±0.06 24.50±0.01 32.80±0.03
Mar 29.50±0.01 34.00±0.04 26.84±0.02 34.75±0.06
Apr 28.94±0.02 35.60±0.05 29.50±0.11 37.50±0.04
May 32.20±0.05 38.00±0.04 33.45±0.01 40.75±0.05
Jun 34.30±0.04 39.50±0.03 36.84±0.06 43.25±0.01
Jul 31.80±0.05 36.23±0.04 32.80±0.06 38.20±0.12
Aug 28.40±0.02 35.43±0.21 31.40±0.01 36.25±0.20
Table 3. showing the levels of SGOT and SGPT in serum of fresh water fish from upstream non polluted
section(Section 1) and Downstream polluted section(Section 2).
Values of SGOT, SGPT are expressed as U/L.
Values are expressed as Mean ±S.D.
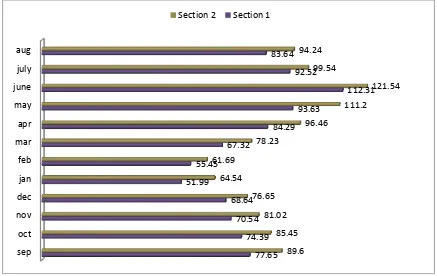
Fig showing the Glucose(mg/dl) variation in fish serum over the year in both non polluted(Secrtion 1) and
polluted section(Section 2) of River Tawi.
sep oct nov dec jan feb mar apr may june july aug
77.65 74.39 70.54 68.64 51.99
55.45 67.32
84.29 93.63
112.31 92.52
83.64
89.6 85.45 81.02 76.65 64.54 61.69
78.23
96.46
111.2 121.54 99.54
94.24
Fig showing the Cholesterol (mg/dl) variation in fish serum over the year in non polluted section( section
1) and polluted section( section 2) of River Tawi.
Fig showing the Variation in LDH(mg/dl) in fish serum in non polluted section(Section1) and polluted
section (Section 2) of River Tawi.
0 50 100 150 200 250
sep oct nov dec jan feb mar apr may june july aug
Section 1
Section 2
0 10 20 30 40 50 60 70
sep oct nov dec jan feb mar apr may june july aug
Section 1
Fig showing the Alkaline phosphatase(U/L) in fish serum over the year in non polluted section (Section 1)
and polluted section (Section 2) of River Tawi
Fig showing the SGOT(U/L) variation in fish serum over the year in non polluted section(section 1) and
polluted section( section 2) of River Tawi.
0 20 40 60 80 100 120 140
sep oct nov dec jan feb mar apr may june july aug
Section 1 Section 2
0 5 10 15 20 25 30 35 40
sep oct nov dec jan feb mar apr may june july aug
Section 1
Fig showing the SGPT( U/L) variation in fish serum over the year in both non polluted section( section 1)
and polluted section (section 2) of River Tawi.
The present investigation was an attempt to elucidate the impact of water quality on the biochemical composition of fish. Results obtained for some physico chemical parameters of water and serum biochemical parameters of fresh water fish Labeo boga are given in the table(1-3). pH values obtained for the section 1 ranged from 8.13±0.20 – 8.46±0.45 while for the section 2 ranged from 6.93±0.96 – 8.16±0.12 ; and DO content for the section 1 ranged from 7.13±0.35 – 8.6±0.60 , while for the section 2 ranged from 3.3±0.50 – 5.36±0.25. From the results, it becomes clear that serum biochemical parameters showed significant fluctuations between the seasons and also with the water quality. The water quality of an aquatic habitat determines the productivity and other parameters necessary for fish survival(Menezes et al 2006). In the present study, the physico chemical characteristics of both the sections were analysed and compared .The DO and pH parameters vary significantly (p<0.05) at the two studied sections and results(Table 1) revealed the low water quality of Section 2 (downstream section)as compared to the section 1(upstream section). The observations showed that pollutant load in section 2 (downstream), not only affected the water quality but also the biochemical profile of fish. It has been reported that environmental pollutants, disease causing agents and
starvation also alter the blood chemistry(Gabriel et al, 2004, Ramesh and Saravanan,2008).Fishes are excellent subjects for the study of various effects of contaminants in water since they can metabolize, concentrate and store water borne pollutants( Sreekala et al 2013).The measurement of serum biochemical parameters can be useful as diagnostic tools in toxicology to find the general health status and target organs affected by toxicants( Zikie et al 2001, Mc Donald and Grosell , 2006).
GLUCOSE:
Glucose content in serum of Fish at section 1 ranged from 51.99±0.04mg/dl – 112.31±0.04mg/dl while for the section 2, glucose content ranged from 61.69±0.04mg/dl – 121.54±0.04mg/dl. At both the sections Increased levels of Glucose marker has been obtained during summer season with the highest value obtained during june i.e 112.31±0.04mg/dl for section 1 and 121.54±0.04mg/dl for section 2. This might be due to increased temperature during summer and also due to less favourable water parameters, as revealed by DO and pH changes(Table 1) during the summer season between section 1 and section 2. While lower values were obtained during winter season for both sections, with
sep oct nov dec jan feb mar apr may june july aug
28.65 26.5
24 23.5
20.2
24.5 26.84
29.5
33.45 36.84
32.8 31.4 34.3
32
29.5 31.91
33.52 32.8 34.75
37.5
40.75 43.25
38.2
36.25
minimum value obtained was 51.99±0.04mg/dl for section 1 during Jan and 61.69±0.04mg/dl for section 2 during feb. Glucose content variations in fish serum in relation to season also supported by findings of various workers(Tondon and Joshi, 1975; Chandra,1986). From monsoon onwards upto winter, declining trend in serum Glucose concentration observed which could be due to less stress level in water as flooding effect of water during monsoon replenish the water quality to some extent; also during winter water deterioration is less as compared to summer. Present findings revealed the significant elevated levels of Glucose in fish serum at section 2(polluted section) as compared to section 1( non polluted section). High levels of blood glucose are caused by disorders in carbohydrate metabolism appearing in the condition of physical and chemical stresses. The elevation in the blood glucose level in fish serum at section 2 may be a response to the increased rate of glycogenolysis and gluconeogenesis. Hyperglycemic response in this study is an indication of disrupted carbohydrate metabolism possibly due to enhanced breakdown of liver glycogen. Similar results were suggested by Kumar et al , 2011. Also , elevated levels of serum Glucose at section 2 could be the response of fish to increased stress ; such finding was well supported by the findings of Dobsikora et al, 2006 in common carp and Omoregie et al 1990 in Tilapia ;on exposure of fish to stress.
Cholesterol:
Cholesterol concentration was ranged from 141.00±0.06mg/dl – 199.40±0.01mg/dl for section 1; while 159.54±0.05mg/dl – 232.50±0.02mg/dl for section 2. Cholesterol levels were found to be maximum during the summer season in both sections and minimum during winter. At both the sections during monsoon season(Jun-Aug), declining trend in serum cholesterol level as compared to summer season(Mar-May) observed which could be due to possible mobilization of cholesterol to the gonads to meet the energy requirements during spawning period. Cholesterol level was found to be more in section 2 as compared to section 1 for entire studied period, which could be due to elevated stress levels in section 2. Hypercholesteremia condition on exposure to stress also observed by Borges et al, 2007 for R. quelen on exposure to cypermethrin and by Yousef et al 2003 which might be due to the
accumulation of pollutants in the liver that disrupt the lipid metabolism and serum cholesterol levels. Yang and Chen ,2003 , Singh and Reddy 1990 also supported the increase in Serum cholesterol concentration in metal exposed fish.
Alkaline phosphatase
The values obtained for Alkaline phosphatase(ALP) at section 1 ranged from62.00±0.02U/L – 97.32±0.02U/L, while for the section 2, the levels of ALP ranged from 76.54±0.01U/L – 130.52±0.01U/L. For both the sections, higher values were obtained for ALP during summer months, while from monsoon onwards declining trend in ALP level observed, with minimum values obtained during winter months(Table 2). The difference in ALP levels at both the sections were found to be significant , which showed the marked response of fish to stress at section 2. Findings of various authors confirmed the increase in ALP levels on exposure to stress. Rajan , 1990 observed the activities of Alkaline phosphatase in different tissues of fish Labeo rohita and showed significant fluctuations when exposed to sublethal concentration of domestic sewage . Also, Atef et al (2005) observed significant elevations of ALP in Oreochromis niloticus on exposure to cadmium. Mandal et al 2010 observed increased levels of ALP in Labeo rohita in stressful condition
LDH , SGOT AND SGPT
the sensitivity of LDH to water temperature as reported by Bezerra et al 2014.
The SGOT levels in fish serum ranged from 19.50±0.01U/L – 34.30±0.04U/L for section 1 and 29.80± 0.05U/L- 39.50±0.03U/L for section 2. Also for section 1, the SGPT levels in fish serum ranged from 20.20±0.02U/L – 36.84±0.06U/L and for section 2 , the levels of SGPT ranged from 29.50±0.03U/L – 43.25±0.01U/L. The observations clearly revealed the fluctuation in SGOT and SGPT levels with respect to season, with higher values obtained for summer months and lowest during winter months. At section 2 , elevated levels of SGOT and SGPT observed as compared to section 1 , which clearly indicated the effect of pollution on biochemical composition and hence of fish health. Elevated SGOT levels in fish under stress has been reported by Joyee et al, 1989 in Clarias batrachus after exposure to pollutant(trichloroform). Also, similar observation was reported by Singh et al 2016. The altered pattern of SGOT indicates the distorted metabolism resulting from liver dysfunction or from cellular injuries to different tissues (Singh et al 2016). Similar observations were reported by Goel and Maya, 1986 in clarias batrachus; Verma et al 1981 in Mystus vittatus.The present elevation in SGPT level in all the studied seasons in Section 2 reflected increased activity of serum enzyme due to liver damage under stress. Present observations gained support from the findings of Verma et al 1981 for Mystus vittatus . SGOT and SGPT are found in liver and due to disease or injuries to cell , these enzymes are released into plasma and their high concentration in blood are indicator of abnormal physiology(Qadir et al, 2014). Jee et al (2005) found increase in activities of Serum SGOT and SGPT in Korean rockfish( Sebastes schlegel) exposed to cypermethrin. Similar observations were reported by Das and Mukherjee 2003.
Thus, the elevated levels of different examined serum biochemical constituents in fish serum at section 2 is parallel with pollution level at that section. Similar observation was reported by Osman (2013). Such biochemical studies could be of immense help in determining the health status of inhabiting organisms, and hence also reflected the quality status of water body.
IV.
REFERENCES
[1]. APHA (1985). Standard methods for the examination of water and wastewater. American Public Health Association. Sixteenth edition Washington, DC, 1-541
[2]. Atef MM (2005). Biochemical effects of short term cadmium exposure on the fresh water fish , Oreochromis niloticus. Biol. Sci. , 5:260-265 [3]. Bergmeyer HV, Horder M and Rej R (1986).
Approved recommendation on IFCC method for Glutamate Oxalo-acetate transaminase and Glutamate pyruvate transaminase. Journal of Clinical Chemistry and Clinical Biochemistry, 24: 481-489
[4]. Borges A, Scotti L V, Siqueira D R, Zanini R , Amaral F, Jurinitz D F and Wasserman G F(2007). Changes in hematological and serum biochemical values in Jundia R. quelen due to sublethal toxicity of cypermethrin. Chemosphere; 69:920-926
[5]. Borkovic SS , Pavlovic SZ, Kovacevic TB Tajn AS , Petrovic VM and Saicic ZS (2008). Antioxidant defence enzyme activities in hepatopancreas , gills and muscle of spiny cheek crayfish (Orconectes limosus) from the River Danube. Comp. Biochem. Physiol. Part C Toxicol. Pharmacol. 147:122-128. [6]. Bucher F and Hofer R(1990). Effect of domestic
wastewater on serum enzyme activities of brown trout(Salmo truta) . Comp. Biochem. Physiol;97:385-390.
[7]. carpio exposed to chloropyrifos. Int. J. integr. Biol., 3:80-86.
[8]. Chandra S(1986). Serum cholesterol levels of 22 species of fresh water fishes . Int. j. Acad. Ichthyol ;3:13-16.
[9]. Correl NV and Langley RW (1956). Glycogen determination in liver and muscle by use of anthrone reagent. Journal of Biological Chemistry, 26: 583-593.
[10].Das BK and Mukherjee SC(2003). Toxicity of Cypermethrin in Labeo rohita fingerlings: biochemical , enzymatic and haematological consequences. Comp. Biochem physiol, 134:109-121.
[12].Fazio F, Marafioti S, Torre A , Sanfilippo M, Panzera M and Faggio C(2013). Haematological and serum protein profiles of Mugilcephalus:effect of two different habitats. Ichthyol. Res.60:36-42. [13].Gabriel, V V, Ezeri G N O. and Opabunmi, O
O(2004). Influence of sex source health status and acclimation on haematological of Clarias gariepinus. Afri. J. Biotech., 3: 463-468.
[14].Goel KA and Maya (1986). Haematological anomalies in Clarias batrachus under the stress of rogor . Ad. Bios, 5:187-192
[15].Hillmann GZ (1971). Continuous photometric measurement of prostrate acid phosphatase, [16].Jee JH , Masroor F , Kang JC (2005). Responses of
Cypermethrin induced stress in haematological parameters of Korean rock fish, Sebastes schlegeli(Hildengorf).Aqua C Res, 36:898-905. [17].Joyee SR , Venkesteshwarlu VP , Janaiah C (1989).
Alteration in amino-transfreases of fresh water fish Clarias batrachus after exposure to trichlorofan. Environ. Ecol, 7(4):930-932.
[18].Kohanestani ZM, Hajimoradloo A , Ghorbani R , Yulghi S , Hoseini A and Molaee M(2013). Seasonal variations in hematological parametersof Alburnoides eichwaldii in Zaringol Stream-Golestan Province, Iran. World. J. Fish. Mari. Sci. 5: 121-1262
[19].Kumar P, Palanivel S , Mathan R and Sarasu(2011). Sublethal effects of Chromium on some Biochemical profiles of the fresh water Teleost , Cyprinus carpio. International Journal of Applied Biology and Pharmaceutical Technology.2(1)
[20].Mandal R , Mandal D , Mishra N and Bahadur A(2010). Effect of surfactants on phosphatase level of fresh water Labeo rohita . J. Environ. Biol , 31:395-398
[21].Maruthanayagam C and Sharmila G (2004). Haematobiochemical variations induced by the pesticide , Monocrotophos in Cyprinus carpio during the exposure and recovery periods. Nat.Environ .Poll. Tech, 3:491-494
[22].McDonald M D and Grosell M (2006). Maintaining osmotic balance with an aglomerular kidney. [23].Menezes S , Soraes A M V M , Guilhermino L and
Peck M R(2006). Biomarker responses of the estuarine brown shrimp Crangon crangon L. to
nontoxic stressor:temperature, salinity and handling stress effects. J. exp. Mar. Biol. Ecol. 335: 114-122 [24].Omoregie E, Ofodike E B C , keke R I (1990).
Tissue chemistry of O. niloticus exposed to the sublethal concentration of Gammalin-20 and Acetellice 25EC. J. Aquat. Sci; 5:33-36
[25].Osman AGM(2013). Biochemical and Physiological Biomarkers in Aquatic Environmental Research. Proceedings of Basic and Applied sciences , Hurghada , Egypt. 1(1).
[26].Qadir S, Latif A , Ali M and Iqbal F (2014). Effects of Imidacloprid on the haematological and serm biochemical profile of Labeo rohita. Pakistan J. Zool 46(4): 1085-1090.
[27].Rajan MR (1990). Acid and alkaline Phosphatase activity in different tissues of Labeo rohita(Hamilton) in relation to sublethal concentration of domestic sewage. J. Nat Conser., 2(2):121-131.
[28].Ramesh, M. and Saravanan, M (2008). Haematologicaland biochemical responses in freshwater fish Cyprinus
[29].Shalaby AME (2009). The opposing effects of Ascorbic acid (Vitamin c) on ochratoxin toxicity in Nile tilapia (Oreochromis niloticus). http://www.ag.arizona.edu/ista/ista6web/pdf/209.pd f. Rterieved: 05-04 -09.
[30].Singh H S and Reddy T V (1990).Effect of copper sulphate on hematology, blood chemistry and hematosomatic index of an Indian catfish Heteropnuestes fossilis and it’s recovery. Ecotoxic Environ Sat; 20:30-35
[31].Singh S, Rawat RS , Singh S and Sharma NN(2016). Studies on the liver marker enzymes (SGOT and SGPT) of fish Heteropnuestes fossilis (Bloch.) after famfos Intoxication . Journal of Advanced Research in Biology.
[32].Stadman TC (1957). Preparation and assay of cholesterol and ergasterol . In: Colonick SP and Kaplan NO, (Eds) “Method Enzymology”. 3( 39). Academic Press , New York
[33].Tondon R S and Joshi B D(1995). Studies on the physiology of blood of some fresh water fishes of India . Normal blood glucose and lactic acid levels. J. Indian Fish Soc. India;7:1-6.
[35].Venkataramana G V, Rani S and Murthy P S(2006). Impact of malathion on the biochemical parameters of gobiid fish, Glossogobius aiuris(Ham). J. Environ. Biol;27:119-122
[36].Verma SR, Kumar V and Dalela RC (1981). Acute toxicity of three newly formu;lated pesticides to fish Mystus vittatus . Ind. J. Environ. Health , 23:215-221
[37].Wells RM , Mcintyre RH , Morgan AK and Davis PS(1996). Physiological stress response in big gamefish after exposure: Observations on plasma chemistry and blood factors. Comp Biochen Physiol, 84:565-571.
[38].Yang J and Chen H C(2003). Effects of gallium on common carp , Cyprinus carpio ; Acute test serum biochemistry and erythrocyte morphology . Chemosphere; 53:877-882.
[39].Yousef M I, El-Demerdash F M, Kamel K I and Al-Salhen K S(2007).Changes in some hematological and biochemical indices of rabbits induced by isoflavones and cypermethrin. Toxicology; 189:23-234