© 2018 IJSRST | Volume 4 | Issue 7 | Print ISSN: 2395-6011 | Online ISSN: 2395-602X Themed Section: Science and Technology
The Comparative Analysis of The Filtering Schemes In Crop Disease Detection
Sampath Kumar S1, Rajeswari R2
1Assistant Professor, Department of Computer Science and Engineering, Sri Eshwar College of Engineering, Coimbatore, India 2Assistant Professor (Senior Grade), Department of Electrical and Electronics Engineering, Government college of Technology,
Coimbatore, India
ABSTRACT
The field of agriculture requires high technological improvement in the various states in the process of cultivation. The significant part of the national economy in India is based on the cultivation of rice crops. The rice crop may affected by the various diseases such as Sheath Blight, Bacterial Blight, Rice Blast, Sheath Rot, Bakanae and Brown Spot. These types of diseases are occurring by the fungus, bacteria or by the virus and these are more destructive and which lead to the financial loss in the farming industries. The Computer Aided Detection (CAD) system is mainly involved to automate the operations performed in various domains including the agriculture field. The crop disease detection is more important during the process of cultivation and maintaining the conditions of the crops. The disease detection process is assisted by the digital imaging process in the CAD technology, which is used to perform the analysis and the identification of the crop diseases. In the CAD system, the noise removal process should be involved to remove the noise pixel present in the captured digital image. In this work the comparative analysis is performed to exhibit the proposed Cross Central Filter for the noise removal process by combining the features of the Gaussian filter and the Hybrid Median Filter operations. The performance evaluation shows the proposed algorithm achieves better performance compared to the existing filtering algorithm such as Mean, Median, Gaussian and Wiener in terms of Mean Square Error (MSE), Mean Absolute Error (MAE), Peak Signal to Noise Ratio (PSNR), Structural Similarity Index (SSIM), Image Enhancement Factor (IEF).
Keywords: CAD, Cross Central Filter, Image Enhancement, Image Processing, Probabilistic Filtering.
I.
INTRODUCTIONIn agricultural development, the methodology of the agricultural value chain incorporates the production flow along with the exchanging of information from smallholder to the consumer. The agricultural value chain ensures the quality of the food generation process and transforming from the perception of giving sustenance with satisfactory nutritious value. The quality validation is performed to the food items by examining food products and by evaluating the farm fields for the disease. These validations are performed with the assistance of the computer based technologies such as CAD. The CAD system in
agricultural environment is developed by using the digital imaging process with the collaborated system in the form of image processing. In image processing, the digital images are captured and the corresponding image manipulation operations are performed in the captured image. The following manipulation techniques are applied to the digital image in the image processing systems.
Image pre-processing Image Enhancement Segmentation
the image data by reducing the distortions in the image. The image preprocessing is provides the denoised or noise-free digital image. The image enhancement improves the interpretability and the perception of information in the digital image by manipulating the image into lighter or darker which will increase or decrease the contrast.
The object identification in the digital image is performed by the process of the image partitioning into multiple regions or segments. The segmentation is mainly involved to simplify the image representation which typically locates the objects and its boundaries. The analysis and the information extraction in the digital image is performed with the assistance of the Classification phase in the image processing. The numerical properties of the digital images in terms of various features are analysed and differentiated in the process of the classification. The classification is employed in two phases: training and
testing. The characteristic features and the corresponding image properties are extracted with the unique description in the training phase. In testing phase the extracted features of the test image is compared against the reference pattern to identify the exact characterization of the image.
II.
RELATED WORKThe development of CAD system in multidisciplinary application such as fashion and dress pattern handling using image manipulation was discussed by Author Joyce et al (2013). The system allows the image drawing techniques and image scaling process to increase the degree of accuracy. The system allows the image drawing techniques and image scaling process to increase the degree of accuracy. The illustration and image pattern drawing process one applied by using the texture library with less difficulty.
Hitashi al (2012) presents a framework to detect the conceptual design for architecting the products with
number of subsystems and components. These components are comprise the properties of the hierarchical system with multidisciplinary of the design. The system is mainly forecasting on the decomposition of the hierarchical design with the management of consistency. It contains the functional level description and product level description with the image development. The rapid prototyping with the CAD technology for the process of tomography using the image processing technology is developed by Tabakovic et al (2015). The methodology was facilitated for the medical application such as surgical therapy planning for treatment process.
The recursive filtering with image fusion for hyperspectral image is proposed by Xudong et al (2014) to extract the deep features available in the input imagery. The feature extraction is based on the recursive filtering along with image fusion in multiple subset of the adjacent hyperspectral band. The fusion process is done by combining and compute average value for the multiple bands with transform domain recursive filtering. The support vector machine classifier is applied to process the feature with D-dimensional feature vector. The pixel wise classification is applied to build the quality index in the feature handling with kappa coefficient.
Bedi et al, 2013 studied the various methodology for improving the visual appearance of the image in terms of image enhancement. The log normal methodologies such as log reduction magnitude with logarithm transform, histogram shifty, content classification are discussed for vision based monitoring application. The histogram modification, content adaptive algorithm and discrete cosine transform with the retinex theory was deliberated for the image and video compression process.
The optimization process in the image denoising algorithm is discussed by Ling et al, 2014. The spatial domain methods such as local feller, Gaussian filter, anisotropic filter to avoid the blur effect are discussed by the authors. The transform domain methods for denoising the image using the discrete cosine transform, wavelet, wedgelets, curvelet and steerable wavelet are applied for significant improvement in the image filtering process. The Bayes least square with the Gaussian scale mixture used to remove the visual artefact which creates the disturbance in image pixel value. The principle component analysis for the spatial filter is evolved to characteristic the multi resolution sparsity and edge detection process during the denoising process.
The retinex theory based image enhancement technique is extended for highly illuminated visual perception is developed by Wei et al, 2014 with the certain process of halo effect in the non-multiscale Gaussian filtering with the dynamic range of modification and colour consistency are achieved in the extension. The reflection on some points are assumed in the implementation of max intensity channel is organized for the image enhancement. The gray-scale closing operation and the cross bilateral filtering is performed to obtain the illumination of image scene. This process was mainly used to achieve the satisfactory colour rendition with the relatively smoothened pixel points.
Li chen et al, 2012 proposed the bilateral filtering methodology for depth colour image enhancement. The bilateral filters improve the quality of depth pixel points and removed the wrong depth values by employing the region growing method. The multi fractal characters of the edge are extracted by applying the analysis of multi fractal theory (Yu Tianhe et al, 2012) for the infrared images. The classification process is executed with the fractal dimension of the images with the irregular degree of the image surface. The smoothened edge of the fractal dimension is calculated based on the gray charge between pixel points.
In the image enhancement process, the clipping and scaling are decided with the best combination of tuning parameter in object classification is developed by Lung et al, 2012. The opportunity cost method for image enhancement is involves the identification trade-off between clipping and scaling. The objective estimation is done by considering the peak signal to noise ratio as key factor for image quality. The image classification is employed with the help of pyramid structured wavelet transform by convolving the image with both low pass and high pass filters. Based on the estimation of the covariance in the sub band, the image objects are classified with the average entropy value.
III.
Mean and Median Filter in CAD
The spatial filtering operation in which the arithmetic mean operation is leads the significance to replace the center value. Mean filter is based on the low pass filter that allows the image signal value in terms of signal frequency which is less than the estimated mean value. The greater pixel vales are considered as the distortions in the image. The operation of the mean filter is performed in the following steps.
2. Based on the image resolution, pixel window size is selected to perform the filter operation.
3. Input image is divided into number of windows based on the window size and resolution of the image.
4. For each window, arithmetic mean value is computed by adding the pixel value and it is divided by the number of pixel placed inside the window.
5. The computed mean value is upper bound threshold to perform the filtering process.
6. For each pixel in the window, the pixel value is compared against the upper bound threshold, if it is lower than the threshold then the pixel value is replaced with the mean value
7. The same process is repeated for entire pixel window in the image.
[ ] ∑ ∑ [ ] [ ⁄ ]
[ ⁄ ] [ ⁄ ]
[ ⁄ ]
where n – number of rows m – number of columns r – size of window
The spatial filtering operation based on the median value instead of arithmetic mean value is performed in the median filter operation. This filter is also the low pass filter which performs the signal frequency replacement based on the arithmetic median value. Input image is converted into number of windows and the median filter operation is performed in each window. The following steps illustrate the median filter operation in the image.
1. Input image resolution is identified and represented as number of rows and columns. 2. The window size is selected based on the
resolution.
3. In each window, the input image signal frequencies are sorted in ascending order.
4. Based on the count, the median value is selected from the window.
5. For odd count exact median value is selected and for even count two middle values are selected and their average value is considered as the median value. The computed median value is upper bound threshold for the low pass filtering operation. 6. During the filtering operation, the pixel value in
the window is compared and replaced by the median value.
[ ] { [ ]} ⌊ ⁄ ⌋ [ ⁄ ] where n – number of rows
m – number of columns r – size of window
IV.
GAUSSIAN & WIENER FILTERThe filtering operation in the Gaussian filter is performed with the assistance of the Gaussian distribution. The Gaussian relationship is computed in the pixel window with the estimation of mean, variance, standard deviation. From the estimated mean and standard deviation, the upper bound threshold is computed as the expected value from the impulse signal of the image frequency. The larger pixel values are removed from the window to form the de-noised image.
( )
√
∑
√∑
where p – filtering bound n – size of window
m – mean value
– standard deviation
[ ] ∑ [ ] (6) [ [ ]] (7) [ [ ]] [ [ ] [ ] ] (8)
V.
CROSS CENTRAL FILTERCross Central filter (CCF) preserves the better performance compare to other filtering operation due to the intelligent operation of this filter. This filter is a band pass filter which combines the process of low pass and high pass filter. The lower and upper are estimated based on the input image signal. The input image pixel points are organized into MxM structures to process it efficiently. The operation is based on Gaussian functions for the formed structure. The structure is handled in three directions, horizontally, vertically and diagonally.
The input image pixel points are divided into N number of grouped structures with MxM matrix. These N groups are processed individually to identify the co-relationship between the input matrix. For each group, the Gaussian spatial relationship is estimated in terms of mean, variance and Gaussian function. This value is estimated in three directions and the value is marked as the upper bound value of the comparison. For lower bound value, the maximum variance value is identified by comparing the input signal value and estimated mean value. The absolute difference between these two values is marked as the lower bound value of the band pass filtering system.
VI.
PERFORMANCE EVALUATIONThe performance evaluation for the filtering operation is conducted using the Matlab software with the captured digital images. The crop image is used as the input to the system and the evaluation is conducted by validating the parameters such as Mean Squared Error (MSE), Mean Absolute Error (MAE), Peak Signal to-Noise Ratio (PSNR) and Image Enhancement
Factor (IEF) are used to validate the quality of the proposed system.
The Mean Squared Error (MSE) is the variation between the actual outcome and the expected outcome. This value indicates the deviational error of the output generated by the system.
The Mean Absolute Error (MAE) is the absolute variation between the actual outcome and the expected outcome. This value indicates the absolute behavioural error of the output generated by the system.
Peak Signal to-Noise Ratio is computed as the ratio between the image signal value and noise signal value present in the image. PSNR is computed from the value of the MSE.
Image Enhancement Factor (IEF) is indicates the quality improved after completing the filtering operation. It is computed as the ratio between the pixel value after completing the filtering process to the pixel value before applying the filtering operation in the digital image. This value represents the changes obtained in the image.
Fig. 8.1. MSE performance of Mean, Median, Gaussian, Wiener, CCF filters.
0 5 10 15 20 25 30 35
20 40 60 80
MSE
Noise Density
MSE
MEAN
MEDIAN
WIENER
GAUSSIAN
Fig. 8.1 – Fig. 8.4 indicate the performance evaluation of the filters for various noise density in terms of MSE, MAE, PSNR and IEF.
Fig. 8.2. MAE performance of Mean, Median, Gaussian, Wiener, CCF filters.
Fig. 8.3. PSNR performance of Mean, Median, Gaussian, Wiener, CCF filters.
Fig. 8.5 – Fig. 8.8 illustrates the average performance of the filter in terms of MSE, MAE, PSNR and IEF.
Fig. 8.4. IEF performance of Mean, Median, Gaussian, Wiener, CCF filters.
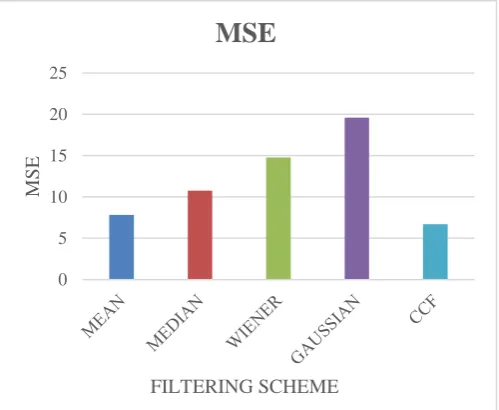
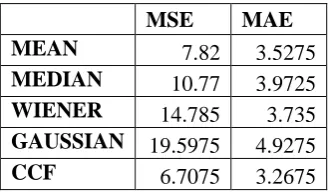
The existing filtering schemes obtain the MSE value as 7.82 to 19.59 whereas the proposed filtering scheme achieves the value as 6.7075. For MAE value, existing systems outcome as 3.52 to 4.92, whereas the proposed system achieves the performance as 3.26 in significant manner.
Fig. 8.5. Average MSE performance of Mean, Median, Gaussian, Wiener, CCF filters.
0 1 2 3 4 5 6 7 8
20 40 60 80
MA
E
NOISE DENSITY
MAE
MEAN
MEDIAN
WIENER
GAUSSIAN
CCF
44 46 48 50 52 54 56 58 60 62
20 40 60 80
P
SNR
NOISE DENSITY
PSNR
MEAN
MEDIAN
WIENER
GAUSSIAN
CCF
0 5 10 15 20 25 30
20 40 60 80
IEF
Noise Density
IEF
MEAN
MEDIAN
WIENER
GAUSSIAN
CCF
0 5 10 15 20 25
MSE
FILTERING SCHEME
Fig. 8.6. Average MAE performance of Mean, Median, Gaussian, Wiener, CCF filters.
Fig. 8.7. Average PSNR performance of Mean, Median, Gaussian, Wiener, CCF filters.
In PSNR evaluation the proposed system produces the value as 57.16433 whereas the existing system degraded with the 52.38 to 56.09. The IEF for the proposed system is achieved the value as 20.49, the existing system outcome the value as 0.46 to 18.057. In each evaluation the proposed system achieves the better performance compare to the existing system in both evaluation for various noise density and the for the average evaluation.
Fig. 8.8. Average IEF performance of Mean, Median, Gaussian, Wiener, CCF filters.
Table 1 Noise Density vs MSE
20 40 60 80
MEAN 3.97 6.49 9.12 11.7
MEDIAN 7.08 9.53 11.99 14.48
WIENER 5.91 11.69 17.67 23.87
GAUSSIAN 9.96 16.54 22.81 29.08
CCF 2.93 5.44 7.98 10.48
Table 2 Noise Density vs MAE
20 40 60 80
MEAN 1.5 2.89 4.25 5.47
MEDIAN 2.08 3.34 4.6 5.87
WIENER 1.59 3.04 4.45 5.86
GAUSSIAN 2.53 4.2 5.75 7.23
CCF 1.39 2.64 3.9 5.14
Table 3 Noise Density vs PSNR
20 40 60 80
MEAN 59.2424 56.5784 54.8819 53.6838
MEDIAN 56.4767 55.1865 54.1904 53.3708
WIENER 57.2650 54.2994 52.5040 51.1979
GAUSSIAN 54.9929 52.7927 51.3956 50.3412
CCF 60.3034 57.6206 55.9585 54.7747
0 1 2 3 4 5 6
MA
E
FILTERING SCHEME
MAE
49 50 51 52 53 54 55 56 57 58
P
SNR
FILTERING SCHEME
PSNR
0 5 10 15 20 25
IEF
FILTERING SCHEME
Table 4 Noise Density vs IEF
20 40 60 80
MEAN 9.1809 16.1703 21.4305 25.4464
MEDIAN 1.5103 3.00710 4.47035 5.93503
WIENER 0.9079 1.50616 1.91771 2.51666
GAUSSIAN 0.4169 0.47328 0.48625 0.50272
CCF 11.469 19.1900 23.9218 27.4006
The outcome of the performance evaluation for MSE, MAE, PSNR and IEF is depicted in Table-1 to Table-4 for noise density added in the image pixel from 20 to 80%.
Table 5 MSE and MAE Evaluation
MSE MAE
MEAN 7.82 3.5275
MEDIAN 10.77 3.9725
WIENER 14.785 3.735
GAUSSIAN 19.5975 4.9275
CCF 6.7075 3.2675
Table 6 IEF and PSNR Evaluation
IEF PSNR
MEAN 18.05706 56.09666
MEDIAN 3.730705 54.80615
WIENER 1.712122 53.81661
GAUSSIAN 0.469798 52.38063
CCF 20.49558 57.16433
The outcome of the average evaluation for MSE, MAE, PSNR and IEF are listed in Table-5 and Table-6.
VII.
ConclusionThe crop disease detection is more crucial task in the process of cultivation and maintaining the conditions of the crops. In this work, the CAD technology assisted technology is analysis and the crop disease identification by using the digital image. The image preprocessing should be involved to de-noise the digital image. The comparative analysis of proposed CCF filter against the various filtering scheme is
performed to exhibit the performance. The evaluation is made against the Mean, Median Gaussian and Wiener filter. The evaluation showed that the proposed system achieved the better performance in terms of MSE, MAE, PSNR and IEF by taking the crop image as input. In future the cognitive based learning process can be used to develop the classification method for the crop disease identification.
VIII.
REFERENCES
1.
Abhishek B. Mankar „Data Mining - An
Evolutionary
View
of
Agriculture‟,
International Journal of Application or
Innovation in Engineering & Management,
Volume 3, Issue 3, March 2014.
2.
Boureau Y.L, Bach F, LeCun Y & Ponce J,
„Learning mid-level features for recognition‟
Conference on Computer Vision and Pattern
Recognition, pages 2559-2566, 2010.
3.
Boureau, Y-Lan, Francis Bach, Yann LeCun,
and Jean Ponce. “Learning mid-level features
for recognition.” In Computer Vision and
Pattern Recognition (CVPR), 2010 IEEE
Conference on, pp. 2559-2566. IEEE, 2010.
4.Chen, Li, Hui Lin, and Shutao Li. “Depth
image enhancement for Kinect using region
growing and bilateral filter.” In Pattern
Recognition (ICPR), 2012 21st International
Conference on, pp. 3070-3073. IEEE, 2012.
5.Chen, Yunhao, Wei Su, Jing Li, and
Zhongping Sun. “Hierarchical object oriented
classification using very high resolution
imagery and LIDAR data over urban areas.”
Advances in Space Research 43, no. 7 (2009):
1101-1110.
6.
Faria, Fabio Augusto, Jefersson Alex dos
Santos, Anderson Rocha, and Ricardo da S.
Torres. “Automatic classifier fusion for
produce recognition.” In Graphics, Patterns
and
Images
(SIBGRAPI),
2012
25th
SIBGRAPI Conference on, pp. 252-259. IEEE,
2012.
International Journal of Computer Vision 68,
no. 3 (2006): 289-317.
8.
Hill, Gary J., Robert J. Wilkins, and Wendy
Hall. “Open and reconfigurable hypermedia
systems: A filter-based model.” (1992).
9.
Jiang, Zhiwei, Zhongxin Chen, Jin Chen, Jia
Liu, Jianqiang Ren, Zongnan Li, Liang Sun,
and He Li. “Application of crop model data
assimilation with a particle filter for
estimating regional winter wheat yields.”
IEEE Journal of Selected Topics in Applied
Earth Observations and Remote Sensing 7, no.
11 (2014): 4422-4431.
10.
Kang, Xudong, Shutao Li, and Jón Atli
Benediktsson.
“Feature
extraction
of
hyperspectral images with image fusion and
recursive filtering.” IEEE Transactions on
Geoscience and Remote Sensing 52, no. 6
(2014): 3742-3752.
11.
Mankar, Abhishek B., and Mayur S. Burange.
“Data Mining–An Evolutionary View of
Agriculture.”
International
Journal
of
Application or Innovation in Engineering and
Management (IJAIEM) 3, no. 3 (2014).
12.
Oppong, Joyce Adwoa, Vivian Biney-Aidoo,
and Eunice Antiaye. “Evaluating the benefits
of Computer Aided-Design (CAD) in Fashion
Education the case of Accra polytechnic.”
Journal of Education and Practice, www. iiste.
org ISSN (2013): 2222-1735.
13.
Shao, Ling, Ruomei Yan, Xuelong Li, and
Yan Liu. “From heuristic optimization to
dictionary
learning:
A
review
and
comprehensive
comparison
of
image
denoising algorithms.” IEEE Transactions on
Cybernetics 44, no. 7 (2014): 1001-1013.
14.Slingo, Julia M., Andrew J. Challinor, Brian J.
Hoskins,
and
Timothy
R.
Wheeler.
“Introduction: food crops in a changing
climate.” Philosophical Transactions of the
Royal Society B: Biological Sciences 360, no.
1463 (2005): 1983-1989.
15.
Sun, Wei, Long Han, Baolong Guo, Wenyan
Jia, and Mingui Sun. “A fast color image
enhancement algorithm based on Max
Intensity Channel.” Journal of modern optics
61, no. 6 (2014): 466-477.
16.
Tabakovic,
Saša
Z.,
Vitomir
S.
Konstantinovic,
Radivoje
Radosavljevic,
Dejan Movrin, Miodrag Hadžistevic, and Nur
Hatab. “Application of computer-aided
designing and rapid prototyping technologies
in reconstruction of blowout fractures of the
orbital floor.” Journal of Craniofacial Surgery
26, no. 5 (2015): 1558-1563.
17.
Tianhe, Yu, Jia Lijuan, Zhang Dianlong, and
Gao Shuang. “Enhancement of infrared image
using multi-fractal based on human visual
system.” In Measurement, Information and
Control (MIC), 2012 International Conference
on, vol. 2, pp. 622-625. IEEE, 2012.
18.