www.nat-hazards-earth-syst-sci.net/6/621/2006/ © Author(s) 2006. This work is licensed under a Creative Commons License.
and Earth
System Sciences
Data management and GIS in the Center for Disaster Management
and Risk Reduction Technology (CEDIM): from integrated spatial
data to the mapping of risk
P. K¨ohler1, M. M ¨uller1,2, M. Sanders1, and J. W¨achter1
1GeoForschungsZentrum Potsdam (GFZ), Data and Computing Centre, Telegrafenberg, 14473 Potsdam, Germany 2Center for Disaster Management and Risk Reduction Technology (CEDIM), 76128 Karlsruhe, Germany
Received: 22 December 2005 – Revised: 1 June 2006 – Accepted: 1 June 2006 – Published: 14 July 2006
Abstract. The project “Risk Map Germany” of the Center for Disaster Management and Risk Reduction Technology (CEDIM) aims at the examination of existing and the devel-opment of new approaches for integrated risk assessment as well as the realisation of risk analyses for selected threats and regions. Hazard, vulnerability and risk maps display the results and provide valuable information for planning, insur-ances, emergency management, science and the public.
This article describes the development of the basic infor-mation infrastructure for CEDIM and the “Risk Map Ger-many” providing components for the networking of partici-pating institutions, for common data management, data dis-semination and publication. While a web based project plat-form offers inplat-formation and communication facilities for all the project members and also the presentation of CEDIM to the public, an integrated data base is prepared as foun-dation for cross-discipline but common risk assessment. It is made available by the spatial data service “CEDIM Data Center” which allows the project members to inform them-selves about the characteristics of existing data and its appli-cability for their specific tasks by exploring GIS functionali-ties. Suitable data can be downloaded and further processed in their own work environment. The components’ alignment with the principles of Spatial Data Infrastructures is required to accomplish the suppositions for long-term availability and accessibility of data, information and services.
1 Introduction
1.1 CEDIM and the “Risk Map Germany”
In 2002 the Center for Disaster Management and Risk Re-duction Technology (CEDIM) was founded as a virtual
in-Correspondence to: P. K¨ohler
(p.koehler@gfz-potsdam.de)
stitution of both the GeoForschungsZentrum Potsdam (GFZ) and the University of Karlsruhe. Its goal is the analysis of risks due to different natural and anthropogenic disasters as well as the development of methods and tools for risk re-duction. Participating disciplines range from geology, geo-physics and engineering to economics, actuarial science and geoinformatics.
The first project “Risk Map Germany” aims at the com-mon and integrated identification, quantification and evalu-ation of risks for human beings, society and infrastructures due to earthquakes, floods, storms and man-made hazards. During the first three years, new approaches of risk assess-ment are developed and applied to those threats taking the federal state Baden-W¨urttemberg as an example (Thieken et al., 2006; Kleist et al., 2006; Tyagunov et al., 2006; B¨uchele et al., 2006; Heneka et al., 20061; Borst and Werner, 20062) and tending to the attainment of the comparability of risk analyses. The investigations after all result in the visualisa-tion of risk in the form of digital risk maps which will be published in the course of 2006. Long-term, the developed procedures shall be applied to further regions in Germany. 1.2 Sub-project “Data management and GIS”
The heterogeneity of threats and the dependencies of hazard, vulnerability and risk require a broad base of related data and information while performing their assessments. Neverthe-less, the base data have to be up to the grade of the particular scientific discipline. Instructions and tools have to be intro-duced to handle this data in an appropriate and common way. 1Heneka, P., Hofherr, T., Ruck, B., and Kottmeier, C.: Storm
damage risk in Germany, Nat. Hazards Earth Syst. Sci., in review, 2006.
2Borst, D., Jung, D., Murshed, S. M., and Werner, U.:
This was part of the sub-project “Data management and ge-ographic information systems (GIS)”.
In the first instance the sub-project was responsible for the development of an information infrastructure which enables and ensures the use and exchange of data for interdisciplinary scientific work as well as networking between the two insti-tutions University of Karlsruhe and GeoForschungsZentrum Potsdam. Having had established a solid foundation of base data, the usage of GIS as a working tool, the realisation of data dissemination strategies as well as networking tools the team worked on the mapping of risk. Current risk mapping procedures were investigated and evaluated, further devel-oped and introduced in cooperation with the particular sub-projects (M¨uller et al., 20063). In general, during the whole runtime of the project the working group warrants the overall support in data handling and GIS.
In the following sections the work and results of the sub-project “Data management and GIS” are described in detail.
2 Basic principles of data and information management
2.1 Conceptual design of a vital information infrastructure CEDIM as a virtual institution relies upon common and standardised mechanisms of information and data manage-ment as well as networking. Above all, this is essential for the projects being executed by partners of different disci-plines and at different locations. Therefore, openness and virtual collaboration up to the broad exchange of scientific results and know-how require a institution and cross-discipline framework. The basic supply of relevant data and information, the implementation of concerted conceptions as well as the tools for data and information handling, exchange and presentation have to be implemented.
In Longman’s Dictionary for Contemporary English an infrastructure, in general, is described as “the systems and structures which are necessary for the operation of a coun-try or an organisation” (Longman, 1987). In CEDIM and the project “Risk Map Germany” the main operational processes are based on data as a raw material which is prepared, mod-ified and processed by different procedures to, finally, ex-tract and deduct valuable information relating to the specific tasks. To create the basic principles for a long-term CEDIM wide framework for this approach of data and information handling the model of an information infrastructure is relied upon. According to Renkema (1996) the information infras-tructure of an organisation is the whole of people, means and procedures in the field of information technology, appointed by the organisation for shared usage. The United States’ Federal Emergency Management Agency (FEMA) imparts 3M¨uller, M., Vorogushyn, S., Maier, P., Thieken, A. H., Kron,
A., B¨uchele, B., Petrow, T., and W¨achter, J.: “CEDIM Risk Ex-plorer” – A mapserver solution in the Project “Risk Map Germany” at CEDIM, Nat. Hazards Earth Syst. Sci., in review, 2006.
a similar underlying understanding but substantiates it with regard to information technology in the field of disaster man-agement (FEMA, 2001). In CEDIM, the FEMA information infrastructure model was adopted and adjusted according to scientific projects similar to those in the context of CEDIM as described in detail by K¨ohler and W¨achter (2006). It com-prises the following levels:
1. Fulfilment of the users’ requirements in their particular surroundings
2. Provision of applications and information systems for the processing of tasks and questions
3. Development of an application-oriented data base 4. Development of a foundational technological
infrastruc-ture
In consideration of the project’s objectives and the particu-lar fields of work the project groups’ requirements have to be assessed (level 1). The realisation of integrated risk anal-yses depends on the one hand on discipline and cross-institution work and on the other hand on common data man-agement. This results in the need of sharing know-how, data, methods and tools. The provision of general information and scientific results to the public as well as potential external partners should be implied, too.
To fulfil the given tasks specific tools and applications are needed (level 2). In this context, geographic informa-tion systems as well as web based services for data distribu-tion are widely used, but also modelling and simuladistribu-tion sys-tems may be operated to gain hazard and risk information. Manifold reference, environmental and socio-economic data build the input for the assessment of risks according to dif-ferent threats. The development of an application-oriented data base (level 3) comprises the collection and acquisition of data from various public and private data providers as well as extensive integration and harmonisation processes due to non-standardised data structures and formats.
The combination of different data, applications and ser-vices is realised by an open technological infrastructure (level 4). The adoption of standards in the fields of data, pro-cedures and system interfaces helps to overcome proprietary and inflexible difficulties in workflows and interactions.
Each level of the information infrastructure consists of several strategies and components. This modular approach leads to the infrastructure model being extensible, update-able and transferupdate-able. First strategies and modules could be designed and implemented in the context of the “Risk Map Germany” and later supplemented and enlarged towards the overall CEDIM infrastructure.
2.2 Incentives by Spatial Data Infrastructures
products will be also spatially referenced information, so-called geoinformation. The required infrastructure denotes a range of measures ensuring data appliance according to the needs of the particular user community.
This is taken up by Spatial Data Infrastructures (SDI) which build frameworks aiming at the facilitation and optimi-sation of accessibility and usability of spatial data and infor-mation for arbitrary application fields. SDI realisation takes place by the introduction of overall organisational and infor-mation technological strategies at different levels. Thereby, the implementation of approved standards for data, metadata, software and interfaces is essential to enable exchange and reusability of spatial data and is seen as the main pillar of a successful infrastructure (Nebert, 2004).
Internet services following the principles of SDI are used to facilitate the access to and the usage of digital geoin-formation not only in the field of risk assessment (Man-sourian et al., 2005). These web services as well as fur-ther spatial information technologies like GIS, spatially en-abled data bases etc. presume a high grade of interoper-ability between the different interacting products and soft-ware components. According to IEEE (1990) interoperabil-ity means the “abilinteroperabil-ity of two or more systems or compo-nents to exchange information and to use the information that has been exchanged”. Purves et al. (2005) describe in-teroperability as providing a “route to reuse of software and data across a wide range of services”. Technical standards contributing to interoperability emanate from standardisation bodies like the World Wide Web Consortium (W3C, http: //www.w3.org), the International Standardisation Organisa-tion (ISO, http://www.iso.org) and the Open Geospatial Con-sortium (OGC, http://www.opengeospatial.org) whereas or-ganisational and implementation strategies among others are concerted at superior initiatives like the INfrastructure for SPatial InfoRmation in Europe (INSPIRE, http://inspire.jrc. it/) on European and the Geodateninfrastruktur Deutschland (GDI-DE, http://www.imagi.de/en/e gdi de/e f gdi de.html) on national level.
SDI may span various institutions working in the same dis-cipline, various disciplines in one institution, various actors at one location or region or distributed communities work-ing cross-discipline, cross-location through to cross-border. Within CEDIM in the first step the infrastructure was limited to the project wide network as only an eligible user circle has access to project data and information. However, the infras-tructure components also are the foundation for the scientific products’ provision to external partners and to the public. Thus, the alignment of data and information management in-side CEDIM with the SDI approach took place via the active participation in current SDI initiatives and the implementa-tion of agreed convenimplementa-tions and standards.
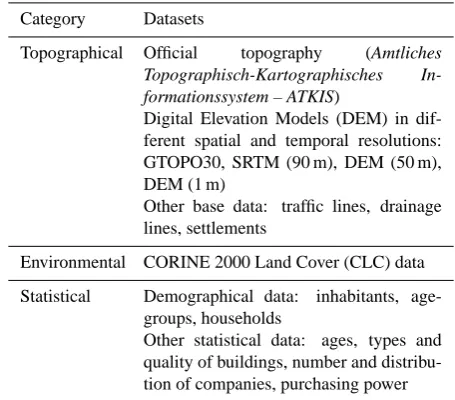
Table 1. Overview of the spatial data stock in CEDIM.
Category Datasets
Topographical Official topography (Amtliches Topographisch-Kartographisches In-formationssystem – ATKIS)
Digital Elevation Models (DEM) in dif-ferent spatial and temporal resolutions: GTOPO30, SRTM (90 m), DEM (50 m), DEM (1 m)
Other base data: traffic lines, drainage lines, settlements
Environmental CORINE 2000 Land Cover (CLC) data
Statistical Demographical data: inhabitants, age-groups, households
Other statistical data: ages, types and quality of buildings, number and distribu-tion of companies, purchasing power
3 Realisation: Using web technologies and GIS for the integration and dissemination of spatial data and in-formation
3.1 Implementation of a web based project platform To form a representation of CEDIM outwards and at the same time to allow cooperation and networking inside the insti-tution a bilingual (German, English) web presentation has been established at http://www.cedim.de. The web presen-tation was designed and maintained by sub-project “Data management and GIS” at GFZ Potsdam and is adminis-trated via the content management system RedDot at the University of Karlsruhe. General information like descrip-tions and actual notices concerning the CEDIM as a whole as well as the different projects, and also events, press re-leases and public documents can be provided to interested parties from science, politics, industry and the general pub-lic. On the other hand an internal area is reserved to the project community. The open source groupware PHProjekt (http://www.phprojekt.com) was implemented to allow com-mon document management, the announcement and coordi-nation of common appointments, the exchange of informa-tion and discussions etc. for authorised users.
3.2 Integration of data
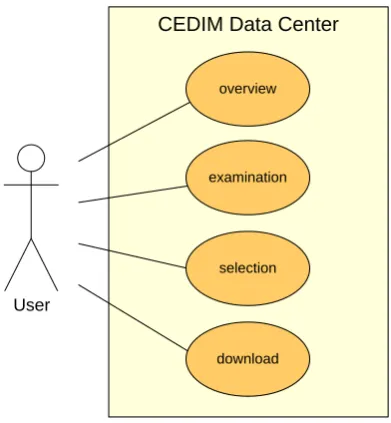
CEDIM Data Center
AnwenderUser
overview
examination
selection
download
Fig. 1. User searching for data – Use Case Diagram.
and risk calculations (Gr¨unthal et al., 2006). According to the results of a survey by the sub-project “Data management and GIS” on the scientists’ demands suitable data had been centrally acquired. Table 1 shows the main data sets used in the project “Risk Map Germany” which are available Ger-man wide and for Baden-W¨urttemberg, respectively.
As usual, datasets are hold by diverse public authorities and private data providers and vary among others in formats, reference systems, spatial and temporal resolutions as well as documentation (G¨artner et al., 2001). Thus, data had to be harmonised to reach a uniform and common data supply to the particular research groups of CEDIM which is mainly important with regard to the aspired comparability of the re-sults of risk analyses. The measures of data harmonisation and integration included
– transformations of the map datum in relation to a uni-form map projection,
– conversions of different file formats to one common for-mat,
– transformations from raw data to readable and inter-pretable data,
– the elimination of erroneous geometry types,
– the adjustment of different geometries and
– the completion and combination of the spatial data and the tables of the thematic and statistical data and calcu-lations.
Finally, all the data were projected in a common map pro-jection and coordinate system. In doing so, the reference
Fig. 2. User searching for data – Activity Diagram.
system was selected according to the recommendations of the Arbeitsgemeinschaft der Vermessungsverwaltungen der
L¨ander der Bundesrepublik Deutschland (AdV) and
IN-SPIRE. These initiatives aim at establishing uniform guide-lines for the collection, management and handling of spatial data in Germany and whole over Europe, respectively (AdV, 2002, INSPIRE, 2004). The Shape format of the Environ-mental Systems Research Institute (ESRI) is selected as the common file format as GIS products of ESRI are in use in all the sub-projects and, moreover, the Shape format widely is accepted as a “quasi-standard”.
3.3 Dissemination of data via the “CEDIM Data Center” Having had acquired, harmonised and integrated the hetero-geneous data stock in the following the datasets had to be disseminated. The sub-projects and working groups should be able to access base data as well as intermediary scientific outputs independent from their particular location and dis-cipline. Later, final results like risk information and maps should be supplied to potential users via an open accessible platform. GIS and internet technology merged in form of spatial web services (Peng and Tsou, 2003) provided the rel-evant features to fulfil this demand and to allow broad access and usage of data and information.
3.3.1 Software specification and selection
A sophisticated web service was needed to enable the re-search teams to access the different datasets. A require-ment analysis was done to collect the demands on features and functions of the service. Thus, in particular comprehen-sive information on available datasets and comfortable func-tionalities of searching and selection are considered as deci-sive. Important software requirements like permanent oper-ational availability, good performance and user-friendly han-dling have to be maintained as well.
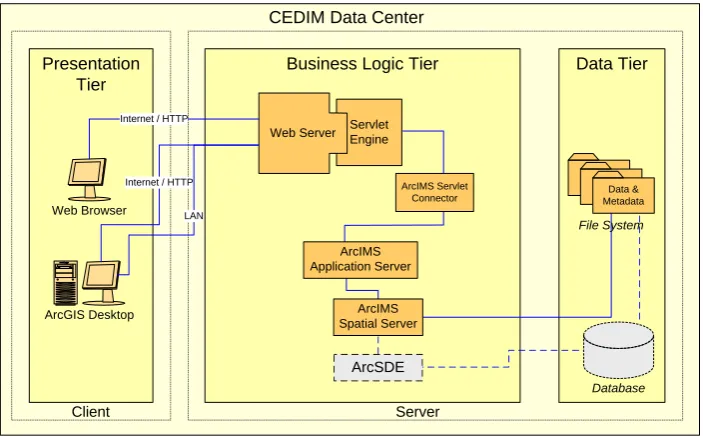
Data Tier Presentation
Tier
Business Logic Tier
Servlet Engine
Database
Web Server
ArcIMS Servlet Connector
Server Client
ArcGIS Desktop Web Browser
Internet / HTTP
Internet / HTTP
LAN
Data & Metadata
File System
CEDIM Data Center
ArcIMS Application Server
ArcIMS Spatial Server
ArcSDE
Fig. 3. Logical architecture of the “CEDIM Data Center”.
information to decide on data applicability (“examination”) and, at last, he needs to select (“selection”) and to download the most suitable data (“download”).
Figure 2 describes the related workflows taking the sce-nario “overview” as an example. Starting from a list of theme categories which refer to the topic of the subordinate data the user selects the category that fits best to his demand. Subse-quently he’s provided with a list of the particular data of that category. On the basis of the dataset title and, if required, by the selection of the related overview map showing the dataset’s spatial range he may decide on its possible suitabil-ity. If it seems to be suitable he would continue data retrieval by a detailed examination of the dataset, otherwise he has to start searching again with the list of categories.
The variety of the available web enabled GIS products to be used as foundation for the CEDIM data service is im-mense. Studying the software market and surveys on com-mercial and open-source products as well as comparing three approved internet map services against the background of the outlined requirements lead to the choice of a commer-cial internet GIS software (Sanders, 20044). The Internet Map Service (IMS) ArcIMS by ESRI provides substantial functionality, simple implementation and the compatibility with the desktop products and file formats used in the context of CEDIM. Moreover, the possibility to access the data via ESRI’s GIS software ArcGIS and an internet link but leave them at the original data base while working with them is also an important factor (see Sect. 3.3.2 and ESRI, 2004).
4Sanders, M.: Webbasierte Bereitstellung raumbezogener Daten
f¨ur das Katastrophenmanagement – Konzeption und Umsetzung des “Data Center” im Center for Disaster Management and Risk Reduc-tion Technology (CEDIM), unpublished diploma thesis, 2004.
3.3.2 Web service implementation
The architecture of the “CEDIM Data Center” was designed as a client/server model. The different components were im-plemented in a three tier scheme shown in Fig. 3. The data tier represents data organisation and storage. At the cur-rent state of the project “Risk Map Germany” the integrated data stock is organised via the file system. Nevertheless, the service was extensibly designed and enables future develop-ments towards a comfortable solution based on a geographic data base (see Sect. 3.3.3 and Fig. 3, grey coloured objects). The business logic tier consists of the main applications map server and web server realising the access to and display of data according to the user’s spatial request. Finally, the pre-sentation tier consists of either a web browser or a desktop GIS and the corresponding graphical user interface (GUI) to enable the user to interact with the CEDIM Data Center in the course of his request.
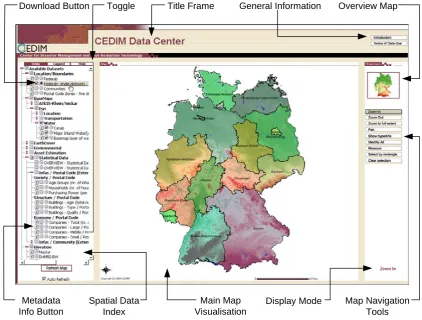
Download Button Toggle Title Frame General Information Overview Map
Metadata Info Button
Spatial Data Index
Main Map Visualisation
Display Mode Map Navigation Tools
Fig. 4. Graphical User Interface of the “CEDIM Data Center”.
that are generated by ArcGIS automatically and are seen as useful.
The GUI was designed in the style of the CEDIM website and represents a combination of different components: The “data catalogue module” structures the available datasets in form of data categories and allows the user to get an overview (compare Sect. 3.3.1 and Fig. 2). On the one hand a well-structured directory facilitates data management via the file system. On the other hand the representation of the structure by a corresponding index and file tree via the GUI supports the user to enter available data sets. The descriptive meta-data are part of that module, too. The “visualisation module” takes on the mapping of the particular dataset by example. The “data retrieval module” allows the user to select a partic-ular dataset and to download it to his local working station. The specific features of the described modules are shown at Fig. 4.
The functionality of the “CEDIM Data Center” can be de-scribed as follows: The user accesses the service via the internal area of the CEDIM website via a web browser as client. By selecting a data set from the index he places his request to the map service. The chosen data set is read out from the file system and delivered to the ArcIMS. The map service generates a corresponding raster image file which is
transmitted via the servlet engine/web server combination to the web browser. The map presentation shows the user the appearance and formation of the data. For more detailed in-formation on the data set the user can query the associated metadata via the data index. Examining the attributes of the particular dataset using simple queries facilitates the deci-sion on data applicability. Finally, the provided download functions complete the data retrieval.
Alternatively, it is possible to use a local ArcGIS imple-mentation as client instead a web browser. The user may connect with the service and embed the required data directly into his GIS application. This is useful, if the user already knows which data sets he needs. Otherwise, in some cases data portrayal during one working session is sufficient but is not required in future sessions. In this way, local storage of the data is also possible, but is not mandatory.
initiative following the international approved standard ISO 19115. This example adds valuable input for the current and future conceptions in the framework of CEDIM: Based on this standardised and approved metadata profile, a CEDIM metadata profile has been developed which allows the stan-dardised documentation of data and maps.
Furthermore, with a growing amount of data and with the intended opening of a web service like the “CEDIM Data Center” to contain the project’s results to the public the im-plementation of a more sophisticated search facility. The user shall be able to search for data by defining search cri-teria related to his particular demands. The existing meta-data component will be extended and the Data Center be added through a so-called catalogue service. In the first step, a stylesheet based on the eXtensible Stylesheet Language (XSL) was already provided to the project members to be integrated into their GIS applications. The scientists now are able to access a template which allows the documenta-tion of their results in form of data and maps directly via their local GIS according to the CEDIM metadata profile. In a second step the implementation of a Web Catalog Service (CSW) following the approved standard of the Open Geospa-tial Consortium is planned. Such a service provides further functionalities for data retrieval and decision-making on the applicability of data for specific questions inside the project. At the same time, the service could be requested by other OGC compliant services and the mapping products found by any interested party.
Regarding the expected long-term increase of data and maps clarity and maintainability can hardly be preserved by a structured data organisation via the file system. Therefore, a spatial database will be implemented optimising the data tier of the “CEDIM Data Center”. Existing data will be ported to the data base and made accessible by the service via the Spatial Data Engine (ArcSDE) as gateway. The use of such a database enables homogeneous and consistent data manage-ment avoiding redundancy and providing performance gains and the foundation for extended functionalities of the ser-vice, e.g. the dynamic generation of risk maps according to the requirements of external users.
4 Conclusions
The generation of a comprehensive data base is the essen-tial precondition for the formulation of vulnerability and risk assessment. Various data resources were composed and har-monised. By using GIS existing data and information are processed to deduce valuable results contributing to a signif-icant assessment of vulnerability and risk on the one side and serving as an input for further processing stages of other sci-entific groups on the other side. Base data as well as selected scientific results were made available by a spatial data server with selected visualisation, GIS and export facilities to en-able the interdisciplinary use and exchange of relevant data
in CEDIM and beyond. The “CEDIM Data Center” offers a comprehensive possibility to the project members to decide on the suitability and usability of various data for their par-ticular work. If one decides to use one or more data sets the required data can be downloaded and used in the own work-ing environment.
With the establishment of the integrated data base, the “CEDIM Data Center” and also the web based information and communication platform the headstone of common data and information management as well as of networking in the project “Risk Map Germany” was realised. These basic components of the CEDIM comprehensive information in-frastructure accompany and support the specific work pack-ages researching in the fields of earthquakes, floods, storms and man-made hazards. Project members are able to publish ideas and concepts and to share documents, discussions and activities as well as access and use valuable data. Current and future items have to be based on the common informa-tion framework.
Last but not least, the “CEDIM Data Center” builds the foundation for the “CEDIM Risk Explorer” that is used to publish the final hazard, vulnerability and risk maps in the scale up to 1:25000 to the interested public and users from insurance companies, authorities, research etc. M¨uller et al. (2006)3describe this service in detail.
The principles of Spatial Data Infrastructures must form the basis for open data and information management. The design of information architectures based on the usage of in-ternet technology, standardised data, metadata and interfaces guarantees interoperability and unrestricted exchange of in-formation.
Acknowledgements. This work is part of the project “Risk Map Germany” of the Center for Disaster Management and Risk Reduc-tion Technology (http://www.cedim.de), a joint venture between the GeoForschungsZentrum Potsdam (GFZ) and the Technical University of Karlsruhe (TH). We thank the GFZ Potsdam and the TH Karlsruhe for financial support. We also thank the Spatial Data Infrastructure Brandenburg for valuable input.
Edited by: A. Thieken Reviewed by: three referees
References
Arbeitsgemeinschaft der Vermessungsverwaltungen der L¨ander der Bundesrepublik Deutschland (AdV): Geodateninfrastruktur in Deutschland (GDI) – Positionspapier der AdV, ZfV, 2002(2), 90– 96, 2002.
B¨uchele, B., Kreibich, H., Kron, A., Thieken, A. H., Ihringer, J., Oberle, P., Merz, B., and Nestmann, F.: Flood-risk mapping: contributions towards an enhanced assessment of extreme events and associated risks, Nat. Hazards Earth Syst. Sci., 6, 485–503, 2006,
ESRI: ArcIMS 9.0 Architecture and Functionality – An ESRI White Paper. E. Press, http://www.esri.com/library/whitepapers/pdfs/ arcims9-architecture.pdf, 2004.
Federal Emergency Management Agency (FEMA): Information Technology Architecture, Version 2.0 – The road to e-FEMA (Volume 1), http://www.fema.gov/pdf/library/it vol1.pdf, 2001. G¨artner, H., Bergmann, A., and Schmidt, J.: Object-oriented
mod-eling of data sources as a tool for the integration of hetero-geneous geoscientific information, Computers & Geosciences, 27(8), 975–985, 2001.
Gr¨unthal, G., Thieken, A. H., Schwarz, J., Radtke, K. S., Smolka, A., and Merz, B.: Comparative risk assessment for the City of Cologne, Germany – storms, floods, earthquakes, Nat. Hazards, 38(1–2), 21–44, doi:10.1007/s11069-005-8598-0, 2006. Institute of Electrical and Electronics Engineers (IEEE): IEEE
Stan-dard Computer Dictionary: A Compilation of IEEE StanStan-dard Computer Glossaries, 1990.
Infrastructure for Spatial Information in Europe (INSPIRE): Reference Data and Metadata Position Paper. http://www.ec-gis. org/inspire/reports/position papers/inspire rdm pp v4 3 en.pdf, 2004.
Kleist, L., Thieken, A., K¨ohler, P., M¨uller, M., Seifert, I., Borst, D., and Werner, U.: Estimation of the regional stock of residential buildings as a basis for comparative risk assessment for Germany, Nat. Hazards Earth Syst. Sci., 6, 541–552, 2006,
http://www.nat-hazards-earth-syst-sci.net/6/541/2006/.
K¨ohler, P. and W¨achter, J.: Towards an open information infrastruc-ture for disaster research and management: Data management and information systems inside DFNK, Nat. Hazards, 38(1–2), 141–157, doi:10.1007/s11069-005-8606-4, 2006.
Longman Dictionary of Contemporary English, 1987.
Mansourian, A., Rajabifard, A., and Zoej, M. J. V.: Development of a Web-Based GIS Using SDI for Disaster Management, in: Geo-information for Disaster Management, edited by: van Oosterom, P., Zlatanova, S., and Fendel, E. M., Springer, Berlin Heidelberg, 599–608, 2006.
Nebert, D. D. (Ed): Developing Spatial Data Infrastructures: The SDI Cookbook, Version 2.0, http://www.gsdi.org/docs2004/ Cookbook/cookbookV2.0.pdf, 2004.
Peng, Z.-R. and Tsou, M.-H.: Internet GIS: Distributed Geographic Information Services for the Internet and Wireless Networks, 2003.
Purves, R. S., Medyckyj-Scott, D. J., and Mackaness, W. A.: The e-MapScholar project – an example of interoperability in GI-Science education, Computers & Geosciences, 31(2), 189–198, 2005.
Renkema, T. J. W.: Investing in the information infrastructure: guidelines for decision making in organisations, Dissertation (in Dutch), Eindhoven University of Technology, Eindhoven, The Netherlands, 1996.
Thieken, A. H., M¨uller, M., Kleist, L., Seifert, I., Borst, D., and Werner, U.: Regionalisation of asset values for risk analyses, Nat. Hazards Earth Syst. Sci., 6, 167–178, 2006,
http://www.nat-hazards-earth-syst-sci.net/6/167/2006/.
Tyagunov, S., Gr¨unthal, G., Wahlstr¨om, R., Stempniewski, L., and Zschau, J.: Seismic Risk Mapping for Germany, Nat. Hazards Earth Syst. Sci., 6, 573–586, 2006,