http://www.sciencepublishinggroup.com/j/ijema doi: 10.11648/j.ijema.20190701.14
ISSN: 2328-7659 (Print); ISSN: 2328-7667 (Online)
Temporal and Spatial Distribution of SO
2
in the Process of
Haze in North China Based on Remote Sensing Data
Chang Ruoying, Zhao Jun
*, Li Wen, Jia Jingjing
College of Geography and Environmental Science, Northwest Normal University, Lanzhou, China
Email address:
*
Corresponding author
To cite this article:
Chang Ruoying, Zhao Jun, Li Wen, Jia Jingjing. Temporal and Spatial Distribution of SO2 in the Process of Haze in North China Based on
Remote Sensing Data. International Journal of Environmental Monitoring and Analysis. Vol. 7, No. 1, 2019, pp. 27-33. doi: 10.11648/j.ijema.20190701.14
Received: April 21, 2019; Accepted: May 22, 2019; Published: June 15, 2019
Abstract:
Based on the data sources of OMI data and haze data in North China, this paper studies the spatial distribution characteristics of SO2 column amounts in North China from 2015 to 2017, and compares the relationship between SO2 columnamounts and haze. Corresponding analysis reveals the objective regularity of its existence. The results revealed that: 1) spatially, the value of SO2 column is distributed higher in south and lower in north. In time, the amount of SO2 column is
characterized by winter > autumn > spring > summer; 2) during the haze event, SO2 increased first and then decreased. The
correlation analysis between the monthly average concentration of SO2 and the frequency of haze weather, showed that there is
a high correlation between the SO2 concentration and the frequency of haze occurrence, and there is consistency in the
space-time distribution; 3) The haze in North China is affected by meteorological and climatic factors and human activities. Coordination within the region is an important means to control air quality. To clarify the spatial and temporal distribution of SO2 during the haze weather in North China is conductive to smooth progress of haze events control in North China.
Keywords:
Atmospheric Remote Sensing, SO2, Haze, North China1. Introduction
Sulfur dioxide (SO2), a common sulfur oxide, is one of the
major pollutants in the atmosphere. Sulfur dioxide in the atmosphere can form sulfuric acid mist or sulphate aerosol by oxidation and moisture in the air that reduce visibility, affect cloud formation, and lead to acid rain and deposition, is an important precursor of environmental acidification. [1] It is one of the influencing factors leading to the occurrence of haze and it has significant impacts on the environment and climate at global. [2] It is very serious impact to human production, life and health. Anthropogenic sources of SO2,
consisting primarily of fossil fuel burning, metal smelting, and oil and gas refining. The remainder of SO2 emissions
come from natural sources volcanic eruptions and degassing and sea spray. [3-5]
Haze, also known as ash, refers to the phenomenon that the air formed by a large amount of smoke, fine particles, water vapor in the air, and other non-aqueous substances is
generally turbid. Haze weather will affect traffic, increase air pollution, and even pose a threat to human health, seriously affecting production and life. [6] In the past 10 years, due to the rapid expansion of the economic scale and the acceleration of industrialization and urbanization, the haze in North China has occurred frequently, which has aroused widespread concern in all walks of life.
In recent years, domestic and foreign scholars have done a lot of research on the SO2 and haze. Studies have shown that
the SO2 amounts in China is increasing year by year, and the
large number of pollutants emission and to the meteorological and climatic conditions of the area. [11-14]
This paper attempts to use the OMI data to retrieve the SO2 column amounts product data, and to analyze the
temporal and spatial distribution of SO2 column amounts
during the haze in North China from 2015 to 2017, and to reveal the objective relationship between them.
2. Data and Methods
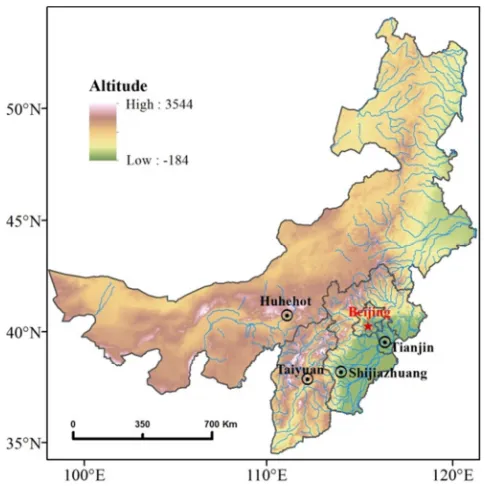
North China includes the city of Beijing, the city of Tianjin, Hebei province, Shanxi province, and Inner Mongolia autonomous region, and covers an area of 1,565,900 km2. The population was approximately 174.79 million by the end of 2017. North China is an important center of administrative, economic and cultural. The southeastern part of the region belongs to the North China Plain, with flat terrain, multiple beaches and wetlands along the coast; the southwest belongs to the Loess Plateau, with high terrain and degree of relief is large; the northern part is the Inner Mongolia Plateau with undulating terrain; the climate is temperate continental monsoon climate with four distinct seasons. Spring is characterized by warm and cold, high temperature and rainy in summer, pleasantly cool and dry in autumn, and cold and dry in winter. [15]
Figure 1. The geomorphologic map of the North China region.
2.1. Data
The Ozone Monitoring Instrument (OMI) is a trace gases detector mounted on the Aura satellite and was jointly developed by the National Aeronautics and Space Administration (NASA) and the Finnish Meteorological Society (FMI). The Level-2 OMSO2 data from the NASA
GES DISC database (http://mirador.gsfc.nasa.gov/) is used. It can be collected for free on the official website. This data reflects the atmospheric boundary layer SO2_PBL (Column Amount SO2_PBL), which is mainly used for the study of SO2 pollution in near-surface atmosphere. [16]
2.2. Methods
The unit for trace gases in the atmosphere by satellite is Dobson Unit (DU). The unit of SO2 concentration in the
Chinese Climate Gazette is µg/m3. The two units are not uniform when comparing together. Therefore, the remote sensing data and the ground observation data are normalized and dimensionless. [17] Formula is as follows:
(1)
Where Yi is nondimensionalize data; Xi is unprocessed raw
data.
VASAN software is used to convert Level-2 OMSO2 data to shapefile data. This paper filters the study area and sets the cloud parameter to 0.3 to obtain the SO2 vertical column
amounts. The Kriging method is used to rasterize the SO2
shapefile data to obtain 0.125°×0.125°raster data.
3. Result and Discussion
3.1. Temporal and Spatial Distribution Characteristics of SO2 Column
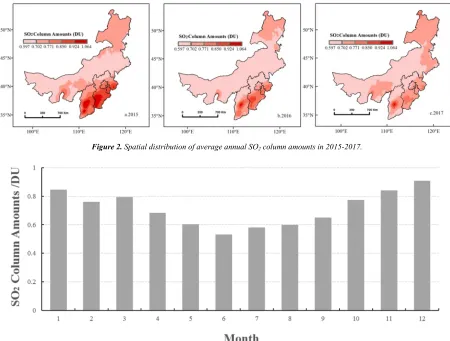
OMI data were used to calculate the average annual SO2
distribution of the planetary boundary Layer in North China during 2015-2017 (Figure 2). Figure 2 shows that the distribution of SO2 annual column amounts in the planetary
boundary layer in North China is uneven, with high in the southeast, slightly higher in the north, and lower in the middle. Among them, the SO2 annual column amounts of the
North China Plain is significantly higher than other areas; the SO2 column amounts has a tendency to decrease year by
year.
Affected by regional emissions and climatic factors, the SO2 column has obvious seasonal variation. According to the
distribution of SO2 monthly average column amounts in
North China from 2015 to 2017 (Figure 3), the SO2 column
in North China is the highest in winter, followed by spring and autumn, and lowest in summer. The maximum amounts appears in December, and the minimum in June; the annual change is U-shaped.
The reason for the high amounts of SO2 column in winter
in this area is that in the winter heating period, the consumption of coal and natural gas increases, and the SO2
emission increases accordingly. Second, the winter climate is dry and less rain, which makes it easy for SO2 to stay in the
Figure 2. Spatial distribution of average annual SO2 column amounts in 2015-2017.
Figure 3. the average monthly of SO2 column in the North China in 2015-2017.
3.2. Temporal and Spatial Distribution Characteristics of Haze
According to the 2015-2017 China Climate Bulletin issued by the China Meteorological Administration, there are eleven large-scale and persistent haze events over China in 2015, 8 times in 2016 and 5 times in 2017. High-intensity haze has appeared each year from 2015 to 2017, which not only lasts for a long time, has high intensity, but has a wide range of influences and rapid development of the process. It is accompanied by the combination of strong fog and severe aerosol, low visibility and serious pollution.
According to the environmental bulletin of the five provinces of North China in 2015-2017, the frequency of haze events has the characteristics of winter > autumn > spring > summer, and is most concentrated in November, December and January. At the same time, the frequency of haze events in the five provinces varies (Figure 4). The frequency of haze in Hebei, Beijing and Tianjin is higher, and that in Inner Mongolia is lower, which is consistent with the annual average spatial distribution of SO2, and the overall is
high in the south and low in the north.
3.3. Correlation Analysis Between Haze Events and SO2
Column
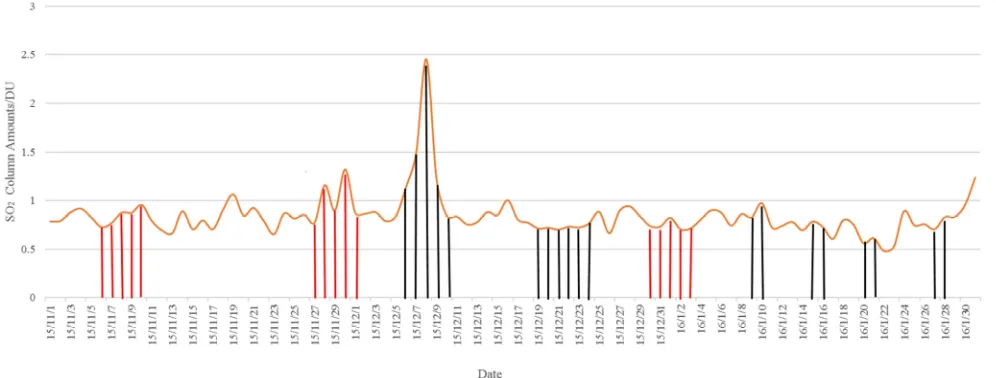
According to the 2015 National Climate Bulletin issued by the China Meteorological Administration, large-scale and persistent haze events occurred in most parts of North China from Nov of 2015 to Jan of 2016. Figure 5 is a broken line diagram showing the variation of SO2 column amounts
during the haze events in winter of 2015. Figure 5 shows that
there were 11 haze occurrences in the winter of 2015. During the haze, the SO2 column amounts began to increase with the
occurrence of haze, and then decreased after reaching the peak until the end of the events. The overall change was first increased and then decreased. At the same time, during the occurrence of persistent haze, the amounts of the SO2 column
will change continuously as the haze continues to form several peaks.
Figure 5. Changes in SO2 column amounts during severe haze during the winter of 2015.
The reason for the change of SO2 column amounts during
haze is that the SO2 in the initial phase of haze beginning
creases greatly in natural conditions, and the SO2
concentrations increases; then a large amount of SO2 reacts
with ultraviolet rays in sunlight to generate a large number of secondary pollutants (eg. Sulfate, sulfite), and led to secondary aerosol formation, suspended in the air, which results the reduction of visibility and the aggravation of haze.[18] In the case of weak illumination, SO2 interacts with
water molecules in the atmosphere, competing with water to adsorb, and synergistically acts on the oxidation of SO2. The
formation of suspended matter leads to further worsen of
haze.
Taking Beijing city, Tianjin city and other provincial capitals as examples, this paper calculates the monthly average concentrations of SO2 at each site, and the number of
days of haze events in each month, then analyzes the statistically relationship between them. The results are showed as follows (Table 1). Table 1 demonstrates significantly positive correlation between SO2 concentrations
and the amounts of haze events. Except for Hohhot, which is moderately correlated, the other four cities are highly positively correlated.
Table 1. Linear regression results of SO2 column concentration and monthly haze days.
Beijing Tianjin Shijiazhuang Taiyuan Huhehot
R2 0.5623 0.6337 0.6401 0.6324 0.394
Coefficient 1.0557 -1.18 -1.9426 -1.5734 -0.4566
Slope 0.4126 0.2266 0.2258 0.0792 0.064
3.4. Analysis of the Causes of Haze in Winter
Studies have shown that the haze in autumn and winter in North China is severe, mainly related to the meteorological and climatic conditions of the region and the anthropogenic pollutant emissions in the region. [19-24] The following two aspects are studied separately.
3.4.1. Meteorological Factors
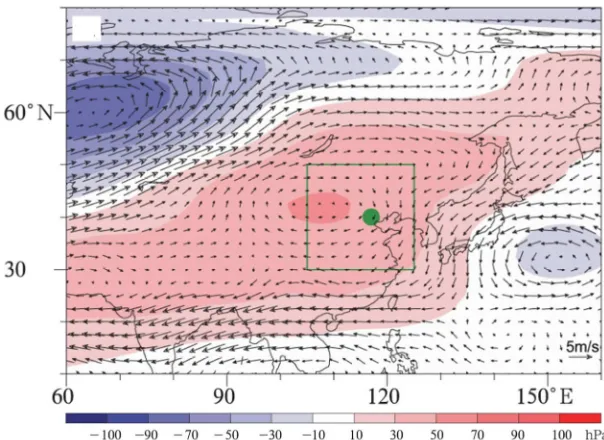
(The green rectangle in the picture indicates “North China”, and the green point is Beijing's latitude and longitude: 40°N, 117°E)
Figure 6. Composite wind (unit: m/s) and geopotential height (unit: hpa) at 500 hpa.
It can be seen from the Figur that the atmosphere in North China is in a static condition, the wind speed near the surface is reduced and the pressure gradientforce is low. In the autumn and winter seasons in North China, there is low temperature, dry and less rain, and the winter monsoon is prevalent. The area is located west of Taihang Mountain and east of Bohai Bay, the winter monsoon is blocked by the Taihang Mountains, led to the reduction of the wind speed, which is not conducive to the diffusion of SO2 and will cause
the concentrated accumulation of SO2. As a result, the SO2
column is too high. [26] At the same time, the easterly airflow from the sea brings a lot of water steam, which makes a higher near-surface humidity and a lower visibility, and the SO2 concentration rises sharply, which aggravates the
pollution situation.
3.4.2. Human Factors
Anthropogenic emissions are another important reason for increasing the accumulation of haze and SO2. For example,
during the period of “The Chinese People’s Anti-Japanese War and the 70th Anniversary of the Victory of the World Anti-Fascist War” held in Beijing on September 3, 2015, in order to ensure the succeed celebrate of the military parade and the air quality in the surrounding areas, the relevant departments from August began to take extremely strict pollution control measures on the surrounding areas of Beijing, strictly control various pollutants emissions.
This paper selects the concentration of major pollutants in the early stage of the military parade, the period of emission reduction, the day of the military parade and the later period of military parade. The results are shown in Table 2.
Table 2. The concentration of pollutants in the air quality control before, during and after the air quality of the parade is compared.
Earlier stage Emission reduction period Activity day Later stage
Times 08.01~08.19 08.20~09.03 09.03 09.04~09.18
PM2.5 (µg/m3) 60.95 17.93 15.00 50.80
PM10 (µg/m3) 86.53 32.2 30.00 64.73
CO (mg/m3) 0.93 0.55 0.50 0.83
NO2 (µg/m3) 36.21 22.73 19.00 42.47
SO2 (µg/m3) 3.84 2.33 2.00 4.8
Table 2 shows that the concentration of air pollutants change, the concentrations of PM2.5 and PM10 decrease by
75.39% and 65.33%, and the other three pollutants decrease by 46.24%, 47.53%, and 47.91%. The sources of these air pollutants are mostly fossil fuel burning, industrial processes and contrived production emission. On the day of the military parade, the concentration of various pollutants is lowest. Simultaneously, the air quality in Beijing, Tianjin, Hebei and other places shows an excellent grade. However, after the military parade, the control measures were abolished, and the
concentration of pollutants rose again. SO2 and NO2
rebounded the most, even exceeding the pre-reduction period, indicating that human activities have a significant impact on the air quality in North China, artificial control of emission reduction can effectively improve the region air quality.
4. Conclusion
1.There is a significant spatial difference between the SO2
The overall is high in the south and low in the north. The SO2 column amounts and the haze events in the
North China Plain are the highest; the SO2
concentration and the frequency of haze occurrence for winter > autumn> spring > summer. They are consistent in time.
2.The SO2 change during haze has a significant
correlation with the haze process; in the continuous haze process, multiple peaks appear in the SO2 column.
Correlation analysis shows that the SO2 concentration
has a high positive correlation with the frequency of haze, and SO2 is also one of the important factors
leading to the further increase of haze.
3.The wind speed is small in autumn and winter in North China, and the air pressure is stable, which is not conducive to the diffusion of SO2 and easy to form haze.
At the same time, the artificially SO2 emission in North
China is too high, resulting in an increase in the frequency of haze and a large number of severe haze. 4.With the introduction of more and more air pollution
control policies, the amounts of SO2 column in North
China has been decreasing year by year.
Acknowledgements
The DEM data used for topography is derived from http://www.gscloud.cn/. The ground observation data in this paper is from https://www.aqistudy.cn/. The data on the occurrence of the haze events comes from the Environmental Climate Bulletin (2015-2017) issued by the China Meteorological Administration.
References
[1] Fioletov, V. E., McLinden, C. A., Krotkov, N, et al. Lifetimes and emissions of SO2 from point sources estimated from OMI [J].
Geophysical Research Letters, 2015, 42 (6): 1969-1976.
[2] Li C, Joiner J, Krotkov N A, et al. A fast and sensitive new satellite SO2 retrieval algorithm based on principal component
analysis: Application to the ozone monitoring instrument [J]. Geophysical Research Letters, 2013, 40 (23): 6314-6318. [3] Fioletov, V. E., McLinden, C. A., Krotkov, N, et al. A global
catalogue of large SO2 sources and emissions derived from the Ozone Monitoring Instrument [J]. Atmospheric Chemistry and Physics, 2016, 16 (18), 11497-11519.
[4] Zhang Y, Li C, Krotkov N A, et al. Continuation of long-term global SO2 pollution monitoring from OMI to OMPS [J].
Atmospheric Measurement Techniques, 2017, 10 (4): 1-21. [5] Fioletov V E, Mclinden C A, Krotkov N, et al. A global
catalogue of large SO2 sources and emissions derived from the
Ozone Monitoring Instrument [J]. Atmospheric Chemistry and Physics, 2016, 16 (18): 11497-11519.
[6] Gao M, Guttikunda S K, Carmichael G R, et al. Health impacts and economic losses assessment of the 2013 severe haze event in Beijing area [J]. Science of The Total Environment, 2015, 511: 553-561.
[7] Gao Y B, Mei S Y, Ma J J, et al. Spatiotemporal Variations of SO2 over China by OMI Observations During 2005~2012 [J].
Journal of Atmospheric & Environmental Optics, 2016. [8] Zhao J, Zhang B C, Fan J P, et al. The Analysis of SO2 Value
Changes in the Atmospheric Boundary Layer over Lanzhou and Surrounding Areas based on the OMI Product [J]. Remote Sensing Technology and Application, 2011, 26 (6): 808-813. [9] Wu P, Ding Y H, Liu Y J et al. Influence of the East Asian
winter monsoon and atmospheric humidity on the wintertime haze frequency over central-eastern China [J]. Acta Meteorologica Sinica. 2016, 74 (3): 352-366.
[10] Zhang Y J, Zhang P Q, Wang J, et al. Climatic Characteristics of Persistent Haze Events over Jingjinji During 1981 – 2013 [J]. Meteorological Monthly. 2015, 41 (3): 311-318.
[11] Wu D, Wu X J, Li F, et al. Temporal and spatial variation of haze during 1951-2005 in Chinese mainland [J]. Acta Meteorologica Sinica. 2010, 68 (5): 680-688.
[12] Wu P, Ding Y H, Liu Y J. Atmospheric circulation and dynamic mechanism for persistent haze events in the Beijing– Tianjin–Hebei region [J]. Advances in Atmospheric Sciences, 2017, 34 (4): 429-440.
[13] Ding Y H, Wu P, Liu Y J, et al. Environmental and Dynamic Conditions for the Occurrence of Persistent Haze Events in North China [J]. Engineering, 2017, 3 (2): 266-271.
[14] Wang Y S, Liu Z R, Ji D S, et al. Formation of haze pollution in Beijing-Tianjin-Hebei region and their control strategies [J]. Bulletin of Chinese Academy of Sciences, 2013 (3): 353-363. [15] Krotkov N A, Carn S A, Krueger A J, et al. Band residual
difference algorithm for retrieval of SO2 from the aura ozone
monitoring instrument (OMI)[J]. IEEE Transactions on Geoscience & Remote Sensing, 2006, 44 (5): 1259-1266. [16] Livingston J M, Redemann J, Russell P B, et al. Comparison
of aerosol optical depths from the Ozone Monitoring Instrument (OMI) on Aura with results from airborne sunphotometry, other space and ground measurements during MILAGRO/INTEX-B [J]. Atmospheric Chemistry & Physics, 2009, 9 (2): 537-540.
[17] Kang C Y, Zhao J, Song G F, et al. Study on the spatial of SO2
in China’s atmospheric boundary layer based on OMI data [J]. China Environmental Science. 2018, 38 (2): 435-443. [18] Liu W J, Han Y X, Wang J, et al. Aerosol optical properties
during one typical haze event over October 2010 in Beijing [J]. China Environmental Science, 2015, 35 (07), 1931-1937. [19] Fedkin, N., Li C., Dickerson R·Dickerson., et al. Linking
improvements in sulfur dioxide emissions to decreasing sulfate wet deposition by combining satellite and surface observations with trajectory analysis. [J] Atmospheric Environment. 2018. 11. 039
[20] Wang H J, Chen H P, Liu J P. Arctic Sea Ice Decline Intensified Haze Pollution in Eastern China [J]. Atmos Ocean Sci Lett. 2015, 8 (1): 1-9.
[22] Zhou J B, Li Z G, Lu N, et. al. Online Sources about Atmospheric Fine Particles During the 70th Anniversary of Victory Parade in Shijiazhuang [J]. Environmental Science. 2016, 37 (8): 2855-2862.
[23] Wang L, Hu B, Mao G, et al. Impact of emission controls on air quality in Beijing during APEC 2014: lidar ceilometer observations [J]. Atmospheric Chemistry and Physics, 2015, 15 (9): 13173-13209.
[24] Wang L T, Wei Z, Yang J, et al. The 2013 severe haze over southern Hebei, China: model evaluation, source
apportionment, and policy implications [J]. Atmospheric Chemistry and Physics, 2014, 14 (6): 3151-3173.
[25] Yan Z W, Pei L, Zhou T J, et al. Unusually clear sky in Beijing during winter 2017 and the underlying large-scale climatic anomalies: With implication for "haze-climate" study [J]. Acta Meteorologica Sinica, 2018, 76 (05): 156-163.