http://www.sciencepublishinggroup.com/j/ijepe doi: 10.11648/j.ijepe.20170606.12
ISSN: 2326-957X (Print); ISSN: 2326-960X (Online)
Maximum Power Point Tracking of Photovoltaic Generators
Partially Shaded Using a Hybrid Artificial Neural Network
and Particle Swarm Optimization Algorithm
Said Zakaria Said
1, 4, *, Lamine Thiaw
2, Cyrus Wekesa Wabuge
31
Department of Electrical Engineering, Pan African University for Basic Sciences Technology and Innovation, Nairobi, Kenya 2Department of Electrical and Information Engineering, University of Nairobi, Nairobi, Kenya
3Department of Electrical Engineering, Ecole Superieure Polytechnique, Chekh Anta Diop University, Dakar, Senegal 4
Department of Mechanical Engineering, University Polytechnic Institute of Mongo, Ndjamena, Chad
Email address:
[email protected] (S. Z. Said), [email protected] (L. Thiaw), [email protected] (C. W. Wabuge) *Corresponding author
To cite this article:
Said Zakaria Said, Lamine Thiaw, Cyrus Wekesa Wabuge. Maximum Power Point Tracking of Photovoltaic Generators Partially Shaded Using a Hybrid Artificial Neural Network and Particle Swarm Optimization Algorithm. International Journal of Energy and Power Engineering. Vol. 6, No. 6, 2017, pp. 91-99. doi: 10.11648/j.ijepe.20170606.12
Received: October 10, 2017; Accepted: October 23, 2017; Published: December 7, 2017
Abstract:
This paper addresses the research methodology for Maximum Power Point Tracking (MPPT). Photovoltaic (PV) Generators may receive different level of solar irradiance and temperature, such as partially shaded by clouds, tree leaves or nearby building. Under partial shaded conditions, several peak power points can occur when the PV module is shaded, which would significantly reduce the energy produced by PV Generators without proper control. Therefore, a Maximum Power Point Tracking (MPPT) Algorithm is used to extract the maximum available PV power from the PV array. However, the common used conventional MPPT algorithms are unable to detect global peak (GP) power point with the presence of several local peaks (LP). In this paper, a hybrid Particle Swarm Optimization and Artificial Neural Network (PSO-ANN) algorithm is proposed to detect the global peak power. MATLAB/Simulink is used to simulate a PV system which consists of PV Generators, DC–DC boost converter, a hybrid PSO-ANN Algorithm, and a resistive load. The simulation results are compared and discussed. The proposed algorithm should perform well to detect the Global Peak of the PV array even under partial shaded conditions.Keywords:
Maximum Power Point Tracking, Particle Swarm Optimization, Artificial Neural Network, Photovoltaic Generators1. Introduction
Photovoltaic (PV) is one of the most promising renewable sources due to its environmental friendliness and low maintenance cost [1, 2]. The Photovoltaic Generators output characteristics are nonlinear as it always varies with solar irradiance and module temperature. Due to these characteristics, a maximum power point tracking (MPPT) controller is utilized to extract the maximum available power from PV array. The maximum power point tracking (MPPT) based on Hybrid Artificial Neural Network and Particle
Swarm Optimization Algorithm is used to control the duty cycle of the DC-DC converter.
irradiance condition.
Recently, the MPPT research trend has been focusing on partially shaded condition (PSC) [4, 5]. Practically, multiple PV modules will be connected in series to create a solar farm with desired voltage and capacity of loading current. The PSC is inevitable because each PV module in the array will receive different levels of sunlight intensity and temperature due to shadow effects from clouds, buildings, trees, etc. Under the non-uniform irradiance conditions, multiple peaks will appear in the P-V characteristic graph as well as I-V
curve of the PV generators. The complication of the characteristics is depending on the orientation of the PV generators and the shading patterns. The occurrence of multiple MPPs will cause the conventional MPPT algorithms to trap at the local MPP. Therefore, several artificial intelligence (AI) techniques have been introduced for adapting conventional MPPT algorithms to allocate the Global MPP (GMPP) and consequently optimizing the power generation of PV array [6].
Particle Swarm Optimization (PSO) is a global gradient less stochastic search method. It is used to search for continuous variable for optimization problems [7, 8]. Artificial Neural Network (ANN) is an information processing paradigm, which is based on the functional concepts of biological nervous systems. It works best to deal with nonlinear dependence between the inputs and outputs [9, 13]. In this study, a hybrid ANN and PSO method is proposed to extract the GP under partial shaded condition. The ANN algorithm initializes the optimal voltage Vopt
initial value at the prevailing solar irradiance, temperature and PV current. This initial voltage is then fed into the PSO to reach the (Global Peak) GP location. ANN acts as a platform to aid the PSO algorithm to locate GP in a smaller range. Therefore, PSO can reach the true GP without having to sweep over the wide range of PV current which ultimately cut short the computational time. This avoids the operating point from lingering at LP and guarantees the reach of GP.
Therefore, this paper aims to formulate a Hybrid PSO and ANN algorithm to acquire the optimum operating point for the PV system in order to extract maximum power from the PV generators. In this study, the PV array is formed by four PV modules connected in series. The hybrid PSO-ANN algorithm is developed to track the Global MPP for having faster tracking speed and more stable output power.
2. Physical Basis and Mathematical
Model of Photovoltaic
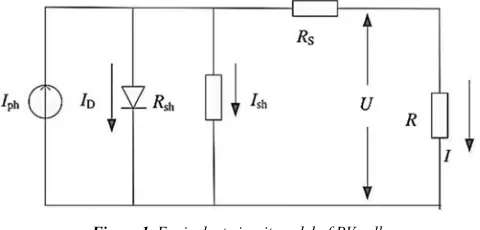
The PV cell is made up of semiconductor materials which can convert solar irradiance into electrical energy. A PV module is used to convert sunlight into direct current and thus facilitates the conversion of light energy to electric energy. Based on the electronics theory of semiconductor p-n junction, it can be described by a current source [9].
1 (1)
Where I0 is the PV cell reverse saturation current (its
magnitude is 10−4 A), q is the electronic charge of an electron (1.6 × 10⁻¹⁹ C), T is the temperature of the PV cell, k is Boltzmann’s constant (1.38 × 10⁻²³ J/K), A is the ideality factor (1.2 for Si-mono), I the PV cell output current, and is the PV generated current, U the PV cell output voltage, and the equalized resistors that related to the temperature.
Figure 1. Equivalent circuit model of PV cell.
So, the PV cell output characteristic equation can be expressed as:
1 ! "#$%& 1 ' (2)
! (1 ) * ( +)
,+- * ;
, $$/0%& 1 ln 1 4 3/03& (3)
Since U ∈ 70, +:;< and +) is the MPP voltage, the PV array output power is:
= > 1 ! "#$%& 1 ' (4)
Where is short-circuit current (A), +- is open-circuit voltage, ) is the MPP current, +) is the MPP voltage, C1 and C2 can be described as constants.
The efficiency of PV cell depends on not only internal shunt resistance but also irradiance, array temperature and load. Here set ?@A, +-?@A, +) ?@A, and ) ?@A as the PV parameters under standard test conditions (STC) are Irradiance Sref = 1000 W/m2and circumstance temperature
Tref = 25°C, then ISC, VOC, Um and Im could be calculated
by:
B" ?@A∙B?@AB 1 D E ∙ ∆G (5)
+H" +H"?@A∙ IJ D K ∙ ∆L 1 M ∙ ∆G (6)
) )NOP∙ B?@AB 1 D E ∙ ∆G (7)
+) +)NOP ∙ IJ D K ∙ ∆L 1 M ∙ ∆G (8)
where ∆S = (S/Sref −1), ∆T = (T−Tref), and typical values of a,
3. The MPPT Method Based on Hybrid
ANN and PSO Algorithm
3.1. Particle Swarm Optimization Algorithm
Particle swarm optimization (PSO) is inspired by social and cooperative behaviour displayed by various species to fill their needs in the search space. The algorithm is guided by personal experience or personal best (Pbest), overall experience global best (Gbest) and the present movement of the particles to decide their next positions in the search space. Further, the experiences are accelerated by two factors c1 and
c2, and two random numbers generated between [0, 1]
whereas the present movement is multiplied by an inertia factor w varying between [wmin, wmax] [11].
The initial population (swarm) of size N and dimension D
is denoted as X = [X1, X2,..., XN ]T, where ′T′ denotes the
transpose operator. Each individual (particle) Xi (i = 1, 2,...,
N) is given as Xi=[Xi,1, Xi,2,..., Xi,D]. Also, the initial velocity
of the population is denoted as V=[V1, V2,..., VN ]T. Thus, the
velocity of each particle Xi (i = 1, 2,..., N) is given as Vi=[Vi,1,
Vi,2,..., Vi,D]. The index i varies from 1 to N whereas the index
j varies from 1 to D. The detailed algorithms of various methods are described below for completeness.
+ ! Q+ D M
!R!S=K TU V W D M,R,SXK TU V W (9)
V ! V D + ! (10)
In equation (9), =K TU,Y represents personal best jth
component of ith individual, whereas XK TUY represents jth
component of the best individual of population up to iteration
k. Figure 2 shows the search mechanism of PSO in multidimensional search space [12, 14].
Figure 2. PSO search mechanism in multidimensional search space.
The different steps of PSO are as follows [15]:
Step 1: Set parameters Wmin and Wmax, c1 and c2 of PSO
Step 2: Initialize population of particles having positions X
and velocities V
Step 3: Set iteration k = 1
Step 4: Calculate fitness of particles Z = [(V ), ∀] and find the index of the best particle b,
Step 5: Select =K TU = V ∀] and XK TU = V^ Step 6: Q = Q)_`−a/bcd a/ef
3gON/bc × U R
Step 7: Update velocity and position of particles
+ != Q × + + M
!REJi() × S=K TU − V W + M,REJi × (XK TU − V )
V != V + + !
Step 8: Evaluate fitness Z != [(V !), ∀] and find the index of the best particle b1,
Step 9: Update =K TU of population ∀], If Z^!!> Z^) then =K TU != V ! else =K TU != =K TU ,
Step 10: Update XK TU of population If Z^!!> Z^) then XK TU != =K TU^ ! else XK TU != XK TU ,
Step 11: Print optimum solution as XK TU .
The parameters used in the PSO algorithm are considered as follows:
1. Inertial weight: Q)_` = 0.9 to Q) m= 0.4 2. Acceleration factors (c1 and c2): c1=1.2 to c2=1.6 3. Population size: 10 to 100
4. Maximum iteration (MaxIt): 50 to 1000 5. Initial velocity: 10% of position
3.2. Artificial Neural Network Algorithm
Artificial Neural Network (ANN) is a type of computational model based on the functional aspects of biological neural networks. It is the method deduced from how the human brain performs computations [16, 17].
Feedforward networks consist of a series of layers. The first layer has a connection from the network input. Each subsequent layer has a connection from the previous layer. The final layer produces the network output [18].
Figure 3. Structure of the Feedforward ANN algorithm.
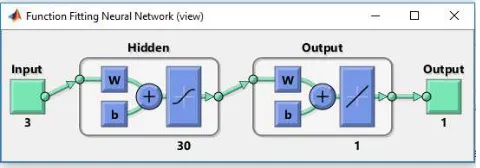
In this paper, feedforward neural network is used with the most widely recommended, backpropagation method the
fitnet (figure 3). The fitting networks are feedforward neural networks (feedforward net) used to fit an input-output relationship. The transfer functions for the hidden layer are the “sigmoid function” and the transfer functions for the output layer “purelin function”.
The inputs of the ANN algorithm are the solar radiation G, the temperature T and the PV short-circuit current o, and the output of the algorithm is the voltage + o.
graphs of the mean squared error (MSE) against number of epochs (figure 6). It can be noticed that train set error, and validation set error have same characteristics as the blue line converge to the best for the 15089 epochs graph. Its best validation performance is 0.0073655. Therefore, 15089 epochs are chosen for the ANN algorithm.
Figure 4. The block diagram of the specification of ANN algorithm in the simulation.
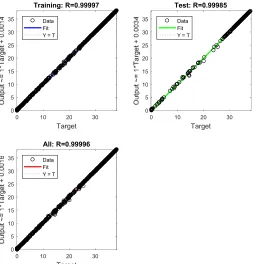
The best regression results have been obtained with the combination of the Feed-forward backpropagation learning algorithm and the Bayesian Regularization (BR) training function. The fact that the regression values given in the table
are close to 100% indicates that the artificial neural network correctly predicts the output parameters of the PV system. The high rate of prediction also depends on the learning algorithm and the training function.
Figure 5. Best Regression for Feed-forward Back propagation with BR training function.
Figure 6. Graph of MSE against number of epochs for ANN algorithm.
4. Modeling and Simulation Setup
The simulation setup consists of four (04) PV modules connected in series to form the PV array as shown in figure 7. The module data and model parameters of the described PV module 1Soltech 1STH-215-Polycrystalline solar panel are tabulated in Table 1. The inputs of the PV array are the values of solar irradiance and temperature.
Table 1. The specifications of 1Soltech 1STH-215-Polycrystalline PV module.
Module data & Parameters Symbol Typical value Open circuit voltage Voc 36.9 V Short circuit current Isc 8.09 A Maximum power voltage Vmp 29.6 V Maximum power current Imp 7.58 A Maximum Power Pmax 224.368 W Temp. coefficient of current Ki 0.12%/°C
0 10 20 30
Target
0 5 10 15 20 25 30 35
Training: R=0.99997
Data Fit Y = T
0 10 20 30
Target
0 5 10 15 20 25 30 35
Test: R=0.99985
Data Fit Y = T
0 10 20 30
Target
0 5 10 15 20 25 30 35
All: R=0.99996
Module data & Parameters Symbol Typical value Temp. coefficient of voltage Kv -0.36%/°C Number of solar cell Ncell 60 Light generated current IL 8.1056 A Shunt resistance Rsh 333.95 ohms Series resistance Rs 0.37039 ohms Irradiance at STC G 1000 W/m2 Temperature at STC T 25°C
The input of the DC-DC boost converter is the PV voltage which is generated by the PV array. The proposed hybrid PSO-ANN algorithm worked with PID controller to control the PWM block. The feedforward neural network algorithm consists of three inputs (solar irradiance G, Temperature T and the PV current p for the four PV modules) and one output (PV voltage +p).
Figure 7. Simulink model of the PSO-ANN MPPT PV system in MATLAB/Simulink.
5. Simulation Results and
Discussion
Figure 9 shows that, in case III, the PV modules are partially shaded at only two different levels of solar radiation and temperature, hence there were two peaks in the P-V characteristic curve and the Global Maximum Power Point occurs at the first peak (Global Peak). The case I exhibits three peaks because it receives three different levels of irradiance and the Global Maximum Power Point occurs at the last peak (Global Peak). Whereas, In cases II and IV, all the four PV modules receive different levels of solar radiation and temperature, therefore four peaks are established in the P-V characteristic curves for each case.
The case I has the highest GMPP because it receives more average insolation on its PV panels. The I-V characteristics curves for the four Cases are shown in figure 10.
The P-V and I-V characteristics curves of the photovoltaic generators connected in series generated in the first simulation are shown in figure 8. The PV array was fully illuminated at Standard Test Condition (STC), hence the maximum power generated at 897.313 W. The proposed hybrid PSO-ANN algorithm is tested for four different shading patterns. The corresponding maximum power of PV generators for each case is recorded in Table 2.
Table 2. Shading patterns for series-connected PV generators.
Case Ambient Conditions Global Peak Pmax (W)
PV 1 PV 2 PV 3 PV 4
Case I 1000 W/m
2 1000 W/m2 900 W/m2 800 W/m2
784.9260
25°C 25°C 20°C 19°C
Case II 800 W/m 2
700 W/m2 400 W/m2 200 W/m2
313.5360
32°C 29°C 26°C 24°C
Case III 600 W/m
2 600 W/m2 250 W/m2 250 W/m2
261.7500
28°C 28°C 25°C 25°C
Case IV 900 W/m
2 500 W/m2 1000 W/m2 800 W/m2
551.5869
35°C 27°C 40°C 30°C
Figure 9. The P-V characteristics curves of PV generators at PSC.
0 20 40 60 80 100 120 140 160
PV Voltage(V)
0 100 200 300 400 500 600 700 800
900 P-V characteristic curve
Case I Case II Case III Case IV
GMPP
LMPP Local MPP peak
Figure 10. The I-V characteristics curve of PV generators at PSC.
The tracking efficiency of the MPPT algorithm is given by equation (11).
q = (=rss ⁄=)_`)× 100 (11)
The performance of the proposed hybrid ANN-PSO algorithm maximum power point tracking of PV generators is shown in Figure 11. The proposed algorithm can always detect the maximum power even when the PV generators are partially shaded. So, the results show that the tracking efficiency of the PSO-ANN algorithm for each case is in the range of 92.70%. Hence, the proposed algorithm can always reach to MPP if there is a change of solar irradiance and temperature.
Figure 11. Performance of ANN-PSO output power of PV generators.
Be
st
Po
w
e
r
(W
5.1. PV Generators at Standard Test Conditions
Under a normal condition (STC), when the entire strings PV or the PV array receive a uniform irradiance and temperature, the typical P-V curve shows a single MPP, which is the peak power as illustrated in the curves of figure 8. This can be made also for different radiation and temperature of the PV generators. At the standard test and constant conditions, the Power output of PV module is directly proportional to solar radiation. Results above show that the voltage and current output both increase when the irradiations are increased. These increases lead to the increasing value in power output of PV panel. Hence, in order to select the best location to install PV module, the strength of solar radiation need to be considered.
5.2. Effects of Partial Shading Condition
However, when partial shading occurs in one of the modules composing the PV generators array, the shaded modules will not be able to produce as much current as the unshaded modules, causing the so called “hot-spot heating”. This problem can be solved by inserting bypass diode across the PV cells, however this bypass diode will create multiple peaks in the P–V characteristic curve. To reach a given power and supply with high current, PV strings must be connected in parallel. Each string is formed of a specific PV module. Number of PV module are connected in series in order to obtain the required voltage. Therefore, a staircase current waveform is created on the I–V curve, while the corresponding P–V curve is characterized by multiple maxima points, as depicted in curves of figures 9 and 10.
6. Conclusion
In the case where the PV array is partially shaded, hot spot will occur in the shaded PV cells. This problem can be solved by inserting bypass diode across the PV cells, however this bypass diode will create multiple peaks in the P–V characteristic curve. Some conventional MPPT algorithms are incapable to detect the GP, hence the PV system are unable to extract the maximum PV power. The performance of the proposed particle swarm optimization with artificial neural network (ANN-PSO) is investigated when the PV generators perform under standard test and partially shaded conditions. In this work, PV array is modeled based on four (04) series connected PV modules. The developed ANN-PSO algorithm is tested under four different cases and its performance in optimizing the output power is given. The simulation results showed that the hybrid ANN-PSO algorithm is able to optimize the generation of PV system by tracking the Global Maximum Power Point (GMPP) when the ambient conditions (solar radiation and temperature) are changed. Furthermore, the proposed hybrid algorithm can control the PV system to perform at a more precise operating voltage. The hybrid ANN-PSO algorithm can always detect the Global Peak (GP), track the GMPP and provides better
steady state during standard test and partial shading conditions. Besides that also, environmental factors and local climate such as humidity, temperature and wind also need to be considered as it will affect the output power of PV module for the further research on the performances of PV generators.
References
[1] Brito MAG, Galotto L Jr, Sampaio LP, Melo GA, Canesin CA (2013) Evaluation of the main MPPT techniques for photovoltaic applications. IEEE Trans Industr Electron 60 (3):1156–1167.
[2] Thiaw, L., Sow, G., & Fall, S. (2014). Application of Neural Networks Technique in Renewable Energy Systems. https://doi.org/10.1109/SIMS.2014.12.
[3] M. G. Villalva, J. R. Gazoli and E. Ruppert F. “Analysis and simulation of the P&O MPPT algorithm using a linearized array model”. Power electronics conference, 2009, Brazil. pp 189 – 195.
[4] Xu W, Mu C, Jin J (2014) Novel linear iteration maximum power point tracking algorithm for photovoltaic power generation. IEEE Trans Appl Supercond 24 (5):1–6.
[5] Ji YH, Jung DY, Kim JG, Kim JH, Lee TW, Won CY (2011) A real maximum power point tracking method for mismatching compensation in PV array under partially shaded conditions. IEEE Trans Power Electron 26 (4):1001–1009. [6] Blanes JM, Toledo FJ, Montero S, Garrigós A (2013) In-site
real-time photovoltaic I-V curves and maximum power point estimator. IEEE Trans Power Electron 28 (3):1234–1240. [7] A. K. Rai, N. D. Kaushika, B. Singh, N. Agarwal, Simulation
model of ANN based maximum power point tracking controller for solar PV system, Solar Energy Materials and Solar Cells, 95 (2), pp. 773778, 2011.
[8] A. A. Kulaksız, ve R. Akkaya, Training Data Optimization for ANNs using Genetic Algorithms to Enhance MPPT Efficiency of a Stand-alone PV System, Turkish Journal of Electrical Engineering & Computer Sciences, 20 (2), pp. 241-254, 2012. [9] Hartmann LV, Vitorino MA, Correa MBR, Lima AMN (2013) Combining model-based and heuristic techniques for fast tracking the maximum-power point of photovoltaic systems.
IEEE Trans Power Electron 28 (6):2875–2885.
[10] M. Miyatake, M. veerachary, F. Toriumi, N. Fujii, and H. Ko, “Maximum power point tracking of multiple photovoltaic arrays: a PSO approach,” IEEE Trans. Aerosp. Electron. Syst., vol. 47, no. 1, pp. 367–380, Jan. 2011.
[11] K. L. Lian, J. H. Jhang, and I. S. Tian, “A maximum power point tracking method based on perturb-and-observe combined with particle swarm optimization,” IEEE J. Photovoltaics, vol. 4, no. 2, pp. 626–633, Mar. 2014.
[12] R. B. A. Koad and A. F. Zobaa, “Comparison between the conventional methods and PSO based MPPT algorithm for photovoltaic systems,” World Academy of Science, Engineering and Technology, International Science Index 88,
[13] Punitha K.; Devaraj D.; Sakthivel S., Artificial neural network based modified incremental conductance algorithm for maximum power point tracking in photovoltaic system under partial shading conditions, In: Energy Vol. 62, December 2013, Page (s): 330-340.
[14] M. Abdulkadir, A. S. Samosir, and A. H. M. Yatim, “Modelling and simulation of maximum power point tracking of photovoltaic system in Simulink model,” in Proceedings of the IEEE International Conference on Power and Energy (PECon’12), pp. 325–330, Kota Kinabalu, Malaysia, December 2012.
[15] M. Miyatake, F. Toriumi, T. Endo, and N. Fujii, “A novel maximum power point tracker controlling several converters connected to photovoltaic arrays with particle swarm optimization technique,” in Proceedings of the European Conference onPower Electronics and Applications (EPE ’07), pp. 1–10, Aalborg, Denmark, September 2007.
[16] Lyden S, Haque ME (2015) Maximum Power Point Tracking techniques for photovoltaic systems: a comprehensive review and comparative analysis. Renew Sustain Energy Rev
52:1504–1518.
[17] R. Ramaprabha and B. L. Mathur, “Genetic Algorithm based Maximum Power Point Tracking for Partially Shaded Solar Photovoltaic Array,” International Journal of Research and Reviews in Information Sciences, vol. 2, no. 1, 2012, pp. 161-163.