In Press: Biosystems. Accepted 19/12/2017. Submitted manuscript copy
A test of the adaptive network explanation of functional disorders using a machine learning analysis of symptoms
Christos Melidis PhD1,3 Susan L. Denham PhD2,3 Michael E. Hyland PhD2,3
1 School of Computing, Electronics and Mathematics 2 School of Psychology
3 University of Plymouth, UK
Corresponding Author: Professor Michael Hyland, School of Psychology, Plymouth University, PL4 8AA, UK. Email [email protected]
Telephone +44 1752 584835/584800 Number of references: 60
Number of Tables: 2 Number of Figures: 2 Number of appendices: 1 Number of words: 2854
Word Length of Abstract: 286 words Keywords
Abstract
The classification and etiology of functional disorders is controversial. Evidence supports both psychological and biological (disease) models that show, respectively, that
functional disorders should be classified as one (bodily distress syndrome) and many (e.g., irritable bowel syndrome (IBS), fibromyalgia syndrome (FMS), and chronic fatigue syndrome (CFS)). Two network models (symptom network and adaptive network) can explain the specificity and covariation of symptomatology, but only the adaptive network model can explain the covariation of the somatic symptoms of functional disorders. The adaptive network model is based on the premise that a network of biological mechanisms has emergent properties and can exhibit adaptation. The purpose of this study was to test the predictions that symptom similarity increases with pathology and that network
connection strengths vary with pathology, as this would be consistent with the notion that functional disorder pathology arises from network adaptation. We conducted a symptom internet survey followed by machine learning analysis. Participants were 1751 people reporting IBS, FMS or CFS diagnosis who completed a 61-item symptom questionnaire. Eleven symptom clusters were identified. Differences in symptom clusters between IBS, FMS and CFS groups decreased as overall symptom frequency increased. The strength of outgoing connections between clusters varied as a function of symptom frequency and single versus multiple diagnoses. The findings suggest that the pathology of functional disorders involves an increase in the activity and causal connections between several symptom causing mechanisms. The data provide support for the proposal that the body is capable of complex adaptation and that functional disorders result when rules that
normally improve adaptation create maladaptive change.
Introduction
Functional disorders, e.g., irritable bowel syndrome (IBS), chronic fatigue syndrome (CFS), fibromyalgia syndrome (FMS), are a challenge to patients, doctors, society and medical science. Patients experience debilitating symptoms and prognosis is poor[1-3]. Treatment options are limited and patients sometimes reject the treatment offered[4-5]. Communication with patients with CFS and FMS can be difficult[6]. Functional disorders impose economic burdens on patients and on health care systems[7]. Although the symptoms of functional disorders are classified as medically unexplained symptoms (MUS), two types of explanation have been proposed.
The first type of explanation is that functional disorders are a type of mental illness explained by psychological theories, and should be referred to as somatoform disorders and treated by psychiatrists and psychologists[8-10]. Psychological/psychiatric theories include
somatization (mental distress becomes bodily distress) and cognitive theories (illness
cognitions cause maladaptive behavior). These “top down” theories explain the psychological antecedents and psychological co-morbidities of functional disorders, and lead to the
prediction that there is just one type of functional disorder which varies along several dimensions[11]. Some evidence supports this prediction. There is considerable overlap and similarity between the symptoms of different functional disorders[12], findings that support this ‘lumper’ hypothesis. The lumper hypothesis implies that different functional disorders should be combined in a single diagnostic category, for example, bodily distress
syndrome[13,14].
The second type of explanation is that functional disorders are examples of yet to be identified diseases, each disorder being a different disease, i.e., a ‘splitter’ hypothesis. A number of biological differences, immune, neurological and endocrine[15-22], have been discovered and continue to be discovered between healthy individuals and those with
functional disorders, but they do not differ consistently between functional disorders. Despite this failure, there remains a hope that a specific pathophysiology will be discovered for each functional disorder, i.e. different functional disorders have different causes and symptoms. In summary, some symptom evidence supports the splitter hypothesis as it does the lumper hypothesis. The result of a considerable body of evidence is that there is consensus in favor of a combination of the lumper and splitter hypotheses and therefore a combination of psychological and disease mechanisms [23,24].
There are two network theories that can explain the data that supports both specificity (splitter) and commonality (lumper) of functional disorder symptomatology. The first is based on the premise that symptoms are part of a causal network, where one symptom can cause another. For example, anxiety causes sleep problems, which then causes fatigue that then causes depression. The symptom network theory has been used extensively for mental disorders[25-28]. The symptom network approach is made plausible by the observation that there is some rationale for a causal relationship between one psychological symptom and another. That rationale is lacking with functional disorders which include not only
psychological symptoms but also somatic symptoms. For example, it is difficult to see why constipation should lead to diarrhea which is a feature of IBS, or why diarrhea and
commonality of functional disorder symptoms can be explained in terms of a network of interconnected symptoms, the symptom network cannot explain why some other symptoms are part of that commonality.
The second network theory, the adaptive network theory, is based on the premise that symptom clusters are caused by biological mechanisms where different biological
mechanisms lead to different clusters of symptoms. These biological mechanisms are not disease specific in that any one cluster can influence more than one disease – i.e., the biological mechanisms lack the specific pathophysiology required for disease classification. These biological mechanisms are themselves connected by a network, such that each
symptom cluster is the result of a putative biological mechanism that then form parts of a network [31 - 33]. Although the adaptive network theory shares with the disease concept the idea that symptoms are caused by biological mechanisms (including non-specific the
immune, endocrine, and neurological abnormalities observed in functional disorders), there are three differences with standard disease explanations.
The first difference is that whereas there is weak causality between disease mechanisms the causality between the symptom-causing functional disorder mechanisms are assumed to strongly connected. Weak causality is known to exist between disease mechanisms. For example, specific inflammation in chronic obstructive pulmonary disease ‘overspills’ into the non-specific inflammatory system, increasing the risk of other diseases that have an
inflammatory component[34]. Raised levels of non-specific inflammatory mediators are also observed in functional disorders so the causal mechanisms between diseases and between functional disorders may be the same. However, in the case of diseases, the inter-disease causal connections are relatively weak, so although co-morbidity between diseases occurs, each disease can be classified and treated as a discrete pathophysiology. In the case of functional disorders, the causal connections are assumed to be strong, so that pathology in one mechanism tends to drive pathology in others thereby creating the overlap in
symptomatology observed with functional disorders. A network of interconnected
mechanisms will provide a single explanation for both the ‘lumper’ and ‘splitter’ hypotheses as well as the lack of specificity of biological abnormalities which is one of the defining features of functional disorders.
The second difference with current disease explanations is that psychoneuroimmunological mechanisms[35,36] form part of the network of causally connected mechanisms. The
inclusion of psychoneuroimmunological mechanisms has two consequences. First, it explains the psychological antecedents and co-morbidities of functional disorder within a biological model. That is, there is a non-dualist interpretation of psychology theory where
psychological events are parallel descriptions of the underlying biology, and neither causes nor is caused by the other in the strict sense of causal connection. Instead psychological events are properties of a biological system, and these properties have no ontological status (and therefore have no causal effects) separately from biology. Second, because
psychoneuroimmunological mechanisms and behaviorally mediated causal pathways are known to contribute to disease mechanisms[35,36], psychological factors can be said to contribute to the etiology of functional disorders in the same way that that psychological factors contribute to disease.
underlying biology of the individual mechanisms. Network structures can exhibit rule following behavior, for example, learning rules. Stephen Wolfram [37] has shown that
programs based on the repetition of simple rules can produce highly complex results, and that rule-following cellular automata produce complex outcomes that cannot be predicted
mathematically from an initial state. As physical science is predicated on mathematical prediction, Wolfram argues that the complex patterns that emerge from the repetition of simple rules requires “a new kind of science”. The adaptive network theory assumes that functional disorders can be explained through the new kind of science proposed by Wolfram, namely, where the complexity of functional disorders arises from the repetition of rules, and where outcome cannot be determined from the initial biological state. Specifically, the theory suggests that the body follows self-organizational rules that are normally adaptive but under specific circumstances create illness, these circumstances typically arising when the body receives conflicting information on a regular basis. These rules and their outcomes are
emergent properties of a biological system and therefore need an explanation at that emergent level.
The adaptive network theory has been used to explain diseases[38,39] and the functional disorders which are the focus of this paper, in particular, chronic fatigue syndrome (CFS) and fibromyalgia syndrome (FMS)[40,41]. The theory is supported by evidence that risk factors, which include biological and psychological variables associated with these disorders, are those predicted by the theory. However, these risk factors can also be explained separately by biological and psychological theories, and therefore existing evidence supports not only the adaptive network theory but also a combination of biological and psychological theories. The present paper does not address the rules themselves, but the more fundamental question of whether there is evidence for a network that could exhibit the rules suggested elsewhere. In this paper we describe and test two predictions of the adaptive network theory, and explore the implications of our findings in terms of how a network might adapt to create the
pathology of functional disorders.
Predictions of network theory
The adaptive network theory assumes that symptom causing mechanisms are causally connected, and that the pathology in any one mechanism can be represented by the activity level of that mechanism as a ‘node’ in a network. Strong interconnectivity causes the activity in any one node to spread to other nodes, so as the level of activity in any one node increases, it will tend to modulate activation levels in nodes to which it is connected. However, as the activation of all nodes increases, the modulatory connections too become more active and eventually differentiation between symptom clusters is lost. Without knowing the underlying biology, which currently remains obscure, it is possible to model the properties of the
network only through its outputs (i.e., inferences from symptom clusters rather than biology), leading to the prediction that symptomatology across groups of patients should become more similar as pathology increases. This prediction is also shared by the symptom network theory, but as noted above, the symptom network theory cannot predict the association of
biologically disparate somatic symptoms.
that connection strengths between the nodes of a network vary with pathology, as this will provide evidence that pathology is associated with network adaptation.
Methods Procedure
Participants were contacted via patient self-help websites for IBS (IBS network), FM
(Fibromyalgia Association and UK Fibromyalgia) and CFS (Action for ME) and gave online informed consent to completing a questionnaire study on their symptoms. Participants were asked to indicate whether they had been given a diagnosis of IBS, FM or CFS ‘by a doctor’ (more than one answer was permitted), and they then completed the online questionnaire. The 61-symptom frequency questionnaire was based on an existing population
questionnaire[42], but with modifications to include items specific to IBS, FM and CFS (for items see Table 1). The website was open between 10/01/15 and 13/04/16. Institutional (University of Plymouth) ethical approval was given. Participants indicated the frequency of the symptoms they experienced on a 6 point scale, 0= never or almost never, 1 = less than 3 or 4 times per year, 2 = every month or so, 3 = every week or so, 4 = more than once per week, 5 = every day. We used normalized symptom frequency as data for training a network model of symptom relationships. The data set is available from the authors on request.
Machine learning
To determine the network structure, we adopted a two-step approach, using machine learning methods for each that required minimal prior assumptions. In the first step, we clustered symptoms to form the nodes of the network, and in the second step, we determined the connections between these nodes based on similarities in the activation patterns of the symptom clusters. For the first step, we used the K-Means algorithm [44] to determine the symptom clusters as this algorithm needs no assumptions about relationships between
symptoms nor the appropriate size for each of the clusters; i.e., the clustering is determined as far as possible by the data (i.e. participants symptomatology). The only completely free parameter is the tolerance for determining cluster convergence. The other parameter required by K-Means is the number of clusters, which was derived from the data using the silhouette method [43]. No explicit regularization was performed at this stage, although to some extent an implicit regularization arises from number of clusters used. In the second step, the clusters were treated as nodes in a network. Connection strengths between the nodes were calculated using the Generalized Hebbian Learning algorithm [45]. To avoid, overfitting of the data, the network weights are regularized following an L2-regularisation [68]. The only free parameter for this algorithm is the learning rate.
The resulting trained network, with nodes corresponding to clusters of symptoms, and connections between nodes determined by co-activations of nodes, essentially provides a descriptor of the symptoms and their relationships irrespective of any particular disorder. Although not completely data-driven, our proposed approach requires the choice of only two parameters. However, while we found the method to be robust to small variations in these parameters, we did not conduct a formal sensitivity analysis of the parameters. (See Appendix for full description).
Statistics
There is no direct measure of pathology. We therefore used two indicators of pathology as proxy: (1) frequency of symptoms, high versus low symptom frequency, (based on a median scale score of 0.64, see Table 2 for interpretation), and (2) single versus multiple functional disorder diagnosis (one diagnosis of either IBS, FMS or IBS versus two or three diagnoses). As we hypothesize that symptom similarity should increase with multiple diagnoses, the test of whether symptom similarity increases with pathology is restricted to the single diagnosis participants only and a comparison made between those with high versus low symptom frequency for each of the three single diagnoses.
The activation level of the symptom clusters was calculated for each of the participants with a single diagnosis, where the activation level for each symptom cluster was calculated as the mean of the scaled frequencies of the symptoms associated with that cluster for that
participant. The 3-way interaction (symptom cluster x severity x diagnosis) in an analysis of variance with Greenhouse-Geisser correction was used to test whether the degree of
difference in cluster activation levels differed as a function of high versus low symptom frequency. This was followed by one-way analysis of variance (IBS versus FMS versus CFS) for each symptom cluster with partial eta squared calculated as effect size to illustrate the degree of difference between cluster activation levels for the different diagnoses. Analysis was conducted using SPSS version 23.
Testing whether connection strengths vary with severity
Participants were allocated to four groups: low symptom frequency single diagnosis, high symptom frequency single diagnosis, low symptom frequency multiple diagnosis and high symptom frequency multiple diagnosis. The directed connections strengths between the multi-symptom clusters were calculated separately for all four groups. Difference in connection strength as a function of severity was tested by treating the total connection strengths for each symptom cluster as cases and comparing clusters across groups of participants by within-sample t-tests.
Results Participants
Completed questionnaires were received from 1751 participants (1592 female, mean age = 50 years, age range 16-88 years) of whom 900 participants reported a single diagnosis of either IBS, FMS or CFS and the remainder some combination of two or all of these diagnoses. The median score used to allocate participants to high or low severity groups was 0.64 (see Table 2 for interpretation). The numbers in each of the four groups used to compare connection strength across groups were: low symptom frequency single diagnosis (n = 617), high
symptom frequency single diagnosis (n = 283), low symptom frequency multiple diagnosis (n = 254) and high symptom frequency multiple diagnosis (n = 595). The 107 participants who returned varying degrees of incomplete questionnaires were excluded from the analysis; there were an additional 296 hits on the website with no data entered.
Symptom clusters
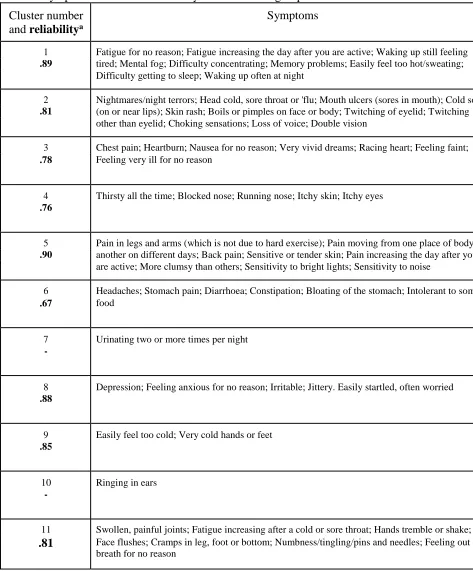
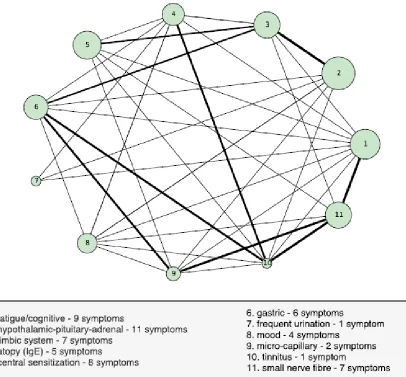
The machine learning procedure produced 11 clusters of symptoms (see Table 1 and Figure 1), based on covariation of symptoms across the total population of 1751. Of these 11 clusters, two clusters contained single symptoms. Alpha coefficients for the remaining 9 clusters with >1 symptom are shown in Table 1.
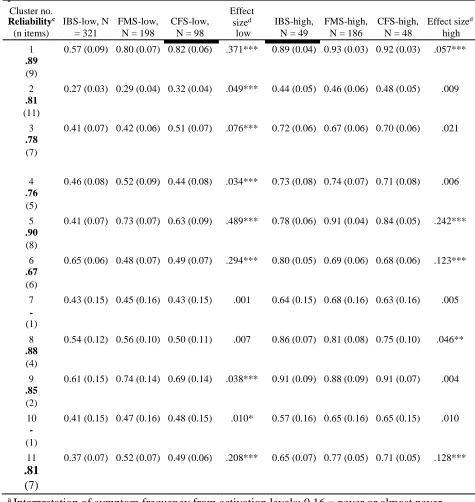
The mean activation levels for single diagnosis high and low severity groups (defined by symptom frequency) for each of the 11 symptom clusters is shown in Table 2. Although there is evidence of diagnostic specificity in both high and low severity groups, the degree of difference between diagnostic categories is significantly (p < .001) less in the high versus the low severity groups. Table 2 shows that the effect size of difference between diagnoses is greater for low versus high severity in 7 of the 11 clusters, the reverse is true for 2 clusters, and there is no difference for one cluster.
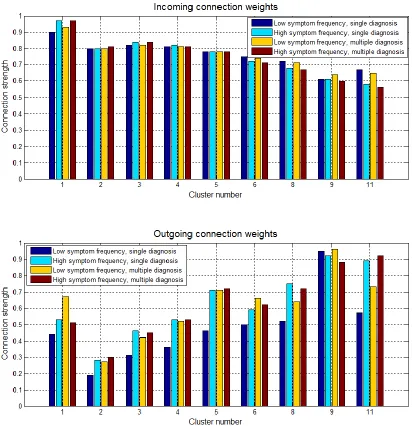
Changes in connection strength with severity
The total absolute incoming and outgoing connection strengths for each of the 9 symptom clusters is shown in Figure 2. There are no significant differences between incoming connection strengths. Outgoing connection strengths are significantly lower in the low symptom frequency single diagnosis groups when compared with the other three groups (p
between .005 and < .001).
Discussion
The symptoms of functional disorders correlate in groups, i.e., symptom clusters, suggestive of common causal mechanisms were found. A machine learning procedure identified 11 clusters of symptoms of which 9 had clinically meaningful groups of symptoms. Symptom cluster 6 comprises gastric symptoms plus headaches, indicating involvement of the lower gastric tract but with some neurological input. Cluster 5 comprises selected pain symptoms plus skin sensitivity and sensitivity to light and noise, consistent with central
sensitization[15]. Cluster 9 represents symptoms of perceived cold and may involve a mechanism of micro-capillary abnormality [30]. The symptoms of cluster 2 appear to be associated with hypothalamic-pituitary-adrenal (HPA) axis activation reduced cellular immunity associated with long term stress[46]. Cluster 3 comprises a variety of symptoms that are known to be associated with the limbic system [47-49]. The symptoms of cluster 4 are associated with atopic disease. Cluster 8 is a group of mood symptoms, and cluster 11 symptoms may involve small nerve fiber neuropathy[50-53].
Two of the clusters have only one symptom consistent with a specific biological mechanism, but other putative mechanisms are not linked to any one disease. There is considerable
variation in the type mechanism hypothesized for each cluster. For example, the symptoms of cluster 4 are all associated with atopic or allergic diseases. The biomarkers of atopy, raised levels of IgE, and raised levels of IgE, are found in allergic asthma, eczema and rhinitis. In the case of cluster 2, the putative biological mechanism is a causal sequence of several biomarkers. Stress leads to autonomic (sympathetic) arousal, which causes raised cortisol levels, which have an immunosuppressive effect on cellular immunity, predisposing to a range of disease caused by infection as well as other widespread effects of autonomic arousal. The biological mechanisms that are inferred from the symptom clusters are therefore highly variable, but despite this variability, they make sense both in terms of disease mechanisms (e.g., IgE) and the non-specific autonomic, endocrine and immune abnormalities that have been observed in functional disorders [15-22].
finding is consistent with both symptom network and adaptive network theories. Although the symptom network theory has considerable support in the case of mental disorders [25-28], it has difficulty explaining the covariation of some somatic symptoms, including the
covariations found here in some of the symptom clusters (e.g., diarrhea and constipation). The second finding was that outgoing connection strengths were lower for participants who had the lowest indicators of pathology (i.e., single diagnosis and low symptoms frequency). This finding suggests that the structure of the network changes with pathology. Taking the first and second findings together, the results suggest that increased pathology involves (a) greater activity in the nodes of the network and (b) increased connection strength between the nodes. We do not know why change in connection strength is limited to outgoing
connections, but it would appear that as pathology increases, so each of the different mechanisms becomes more sensitized to the activity of its neighbors. Given that sensory sensitization is a feature of functional disorders, it is interesting that the pathology of functional disorders also appears to involve sensitization between biological mechanisms.
Limitations
The method for identifying symptom clusters is known to be methodology dependent. For example, several studies have used exploratory factor analysis to identify functional disorder symptom clusters. These studies produce different numbers and groupings of symptoms [54- 58]. There are two possible interpretations for the variation in findings. One is that it a methodological problem that is solved only by finding the ‘correct’ methodology. The other, the one we prefer, is that the underlying biological network structure makes it possible to have different, equally valid, groupings of symptoms. For example, cluster 4 (atopy) is linked to just one biomarker, and the atopic symptom cluster is retained if our data are subjected to factor analysis (principal axis, 11 factors, varimax rotation). However, with the same factor analysis, the symptoms of cluster 2 are separated into different factors
representing autonomic and immune related symptoms. That is, the combined autonomic- immune causal sequence identified in the machine learning analysis is not found in the factor analysis. Similarly, the pain symptoms and sensitivity to light and noise of cluster 5 are both linked to central sensitivity, but these two types of symptoms form separate clusters in the factor analysis, consistent with central sensitivity differing between modalities. Variability of interpretation follows if, in a network of mechanisms, it is possible to group those symptoms and therefore mechanisms in different ways. Some symptom clusters will be the result of just one mechanism and these will tend to be consistent across methodologies. However, where symptom clusters depend on interconnected mechanisms, then different methodologies will reveal different types of interconnection. Our results show that it is possible to provide a useful description of our data in terms of 11 clusters of symptoms – not that there really are 11 and only 11 clusters.
The number of clusters will have comparatively little bearing on tests of difference between the high and low severity participants. However, correlations obtained from subpopulations are known to differ from correlations of the total population. The comparison of different subpopulations raises the possibility of bias in any statistical analysis of symptom
association. We have been unable to determine the direction of any bias, but the possibility of bias need to be acknowledged.
are also consistent with the hypothesis that symptoms cause symptoms. The network of symptom clusters found in this study could be made up of clusters from two sources: symptom-symptom clusters and biological mechanism-symptom clusters. Additionally, any of the putative functional disorder mechanisms may be causally connected to disease
mechanisms. A study where there is a combination of symptom analysis with biomarkers will provide a better understanding of the underlying biological mechanisms than the present study which is limited only to symptoms. Nevertheless, this study does provide useful pointers towards biological markers of likely interest.
From networks to rule following adaptation
Our research was motivated by the hypothesis that functional disorders are the consequence of network adaptation. It is known that the body can adapt – examples include simple adaptation to repeated stress (biomarkers of stress increase with repeated stress) and drug tolerance effects (drugs become less effective over time) – but a network provides the possibility of more complex forms of adaptation, in particular where there are conflicting inputs[41]. One proposal is that if a person persists in activities that create fatigue or pain, then the symptoms of fatigue and pain potentiate, doing so because the system is designed to optimize control feedback loops[32,33,40,41]. The hypothesis that symptoms potentiate when they fail to alter behavior has also been proposed separately in relation to affective
disorders[59-61, and this compensation rule [41] is consistent with other forms of data[62- 64]. Whereas the present study provides no information about whether these algorithms are correct, it does provide evidence of a network capable of complex rule following, and suggests that rules may differ between mild and more severe patients with functional disorders. Thus, it contributes towards a new understanding of the cause and treatment of functional disorders.
In summary, the data are consistent with both the symptom network and adaptive network theories and show that the covariation of symptoms of functional disorders cannot be
explained through a single common cause of somatization – though somatization may still be occurring. The symptom network theory cannot explain the covariation of all the symptoms assessed in this study and requires the addition of a biological explanation for at least one symptom. However, the symptom network theory is not incompatible with the adaptive network theory as symptom networks are likely to reflect both types of causality. Our finding make plausible the proposal that the body is a biological network that follows rules of
adaptation. The hypothesis that the body exhibits complex adaptation provides a new way of conceptualizing functional disorders, one that emphasizes the role of lifestyle. Although the importance of lifestyle is emphasized in current guidelines[65,66], this study might provide a further impetus for exploring the importance of temporal patterning in the development of pathology and recovery, and might provide a useful guide for therapeutic practice[67]. Acknowledgements
Sarah Bruckgraber helped collect the data. We thank the patients and patient support groups for providing the data, and for two anonymous reviewers for helpful comments on earlier drafts.
Funders: The first author was supported by an internal university grant awarded to the second and third authors.
Prior presentations: none
References
1. Andréll P, Schultz T, Mannerkorpi K, Nordeman P, Börjesson M, Mannheimer C. Health-related quality of life in fibromyalgia and refractory angina pectoris: A comparison between two chronic non-malignant pain disorders. Journal of Rehabilitation Medicine. 2014;46:341-7.
2. Hvidberg MF, Brinth LS, Olesen AV, Petersen KD, Ehlers L. The health-related quality of life for patients with myalgic encephalomyelitis/chronic fatigue syndrome (ME/CFS). PloS one. 2015;10(7):e0132421.
3. Walitt B, Fitzcharles MA, Hassett AL, Katz RS, Häuser W, Wolfe F. The longitudinal outcome of fibromyalgia: a study of 1555 patients. J Rhueumatol. 2011;38:2238-46.
4. Chambers D, Bagnall AM, Hempel S, Forbes C. Interventions for the treatment, management and rehabilitation of patients with chronic fatigue syndrome/myalgic encephalomyelitis: an updated systematic review. J R Soc Med. 2006;99:506-20. 5. Fitzcharles MA, Ste-Marie PA, Goldenberg DL, Pereira JX, Abbey S, Choinière M, Ko G, Moulin DE, Panopalis P, Proulx J, Shir Y. 2012 Canadian guidelines for the diagnosis and management of fibromyalgia syndrome: executive summary. Pain Research and Management. 2013;18:119-26.
6. Stone J, Wojcik W, Durrance D, Carson A. What should we say to patients with symptoms unexplained by disease? The" number needed to offend". BMJ.
2002;325(7378):1449-1450.
7. Skaer TL. Fibromyalgia: disease synopsis, medication cost effectiveness and economic burden. Pharmacoeconomics. 2014;32:457-66.
8. Barsky AJ, Borus JF. Functional somatic syndromes. Ann Intern Med 1999; 130:910–921.
9. De Gucht V, Fischler B. Somatization: a critical review of conceptual and methodological issues. Psychosomatics. 2002;43:1-9.
10. Wessely , S. , Hotopf , M. and Sharpe , M. ( 1998 ). Chronic Fatigue and ItsSyndromes. New York : Oxford University Press .
11. Wessely S, Nimnuan C, Sharpe M. Functional somatic syndromes: one or many? Lancet. 1999: 354; 936-939.
12. Aaron LA, Buchwald D. A review of the evidence for overlap among
unexplained clinical conditions. Ann Intern Med. 2001;134:868-81.
13. Fink P, Schröder A. One single diagnosis, bodily distress syndrome,
succeeded to capture 10 diagnostic categories of functional somatic syndromes and somatoform disorders. J Psychosom Res. 2010;68:415-26.
14. Budtz-Lilly A, Schröder A, Rask MT, Fink P, Vestergaard M, Rosendal M.
Bodily distress syndrome: A new diagnosis for functional disorders in primary care? BMC family practice. 2015;16:180.
15. Woolf CJ. Central sensitization: implications for the diagnosis and treatment of pain. Pain 2011;152: S2-15.
16. Cleare AJ. The neuroendocrinology of chronic fatigue syndrome. Endocr Rev 2003;24:236-52.
signatures in ME/CFS are present early in the course of illness. Science Advances 2015:e1400121.
19. Maes M, Leunis JC, Geffard M, Berk M. Evidence for the existence of Myalgic Encephalomyelitis/Chronic Fatigue Syndrome (ME/CFS) with and without abdominal discomfort (irritable bowel) syndrome. Neuroendocrinology Letters 2014; 35:445-53.
20. Sarzi-Puttini PI, Atzeni F, Diana A, Doria A, Furlan R. Increased neural sympathetic activation in fibromyalgia syndrome. Ann NY Acad Sci.
2006;1069:109-17.
21. Freeman R, Komaroff AL. Does the chronic fatigue syndrome involve the autonomic nervous system? JAMA 1997;102:357-64.
22. Fukudo S. IBS: Autonomic dysregulation in IBS. Nature Reviews Gastroenterology and Hepatology. 2013;10:569-71.
23. Kanaan RA, Lepine JP, Wessely SC. The association or otherwise of the functional somatic syndromes. Psychosom Med 2007;69:855–859.
24. Lacourt T, Houtveen J, van Doornen,L. “Functional somatic syndromes, one or many?”: An answer by cluster analysis. J Psychosom Res 2013;74:6-11.
25. Borsboom D, Cramer AO. Network analysis: an integrative approach to the
structure of psychopathology. Annual review of clinical psychology. 2013;9:91-121.
26. Borsboom D. A network theory of mental disorders. World Psychiatry.
2017;16:5-13.
27. Nuijten MB, Deserno MK, Cramer AO, Borsboom D. Mental disorders as
complex networks: An introduction and overview of a network approach to psychopathology. Clinical Neuropsychiatry. 2016;13(4/5):68-76.
28. Fried EI, van Borkulo CD, Cramer AO, Boschloo L, Schoevers RA,
Borsboom D. Mental disorders as networks of problems: A review of recent insights. Soc Psychiatr Epidemiol 2017;52:1-10.
29. Thaller M, Hyland ME, Kandasamy R, Sadler M. Is patient acceptance of
the diagnosis of psychogenic nonepileptic seizures linked to symptomatology? Journal of clinical and experimental neuropsychology. 2016;38(3):338-40. 30. Scolnik M, Vasta B, Hart DJ, Shipley JA, McHugh NJ, Pauling JD. Symptoms of Raynaud’s phenomenon (RP) in fibromyalgia syndrome are similar to those reported in primary RP despite differences in objective assessment of digital microvascular function and morphology. Rheumatol Int. 2016;36:1371-1377.
31. Hyland ME. Network origins of anxiety and depression. Behavioral and
Brain Sciences. 2010 Jun;33(2-3):161-2.
32. Hyland ME. The origins of health and disease. Cambridge: Cambridge University Press, 2011.
33. Hyland ME. A New Paradigm to Explain Functional Disorders and the Adaptive Network Theory of Chronic Fatigue Syndrome and Fibromyalgia
Syndrome. In Sullivan GB, Cresswell J, Ellis B, Morgan M, Schraube E. Resistance and renewal in theoretical psychology. Concord, ON: Captus University
Publications. (2017).
34. Sinden NJ, Stockley RA. Systemic inflammation and comorbidity in
COPD: a result of ‘overspill’ of inflammatory mediators from the lungs? Review of the evidence. Thorax 2010;65:930-936
36. Kemeny ME, Schedlowski M. Understanding the interaction between psychosocial stress and immune-related diseases: a stepwise progression. Brain Behav Immun 2007;21:1009-1018.
37. Wolfram S. A new kind of science. Champaign: Wolfram media; 2002 Jan.
38. Hyland ME. A connectionist theory of asthma. Clinical and Experimental
Allergy. 1999;29:1467-73.
39. Hyland ME. A two‐phase network theory of atopy and asthma causation: a
possible solution to the impact of genes, hygiene and air quality. Clinical & Experimental Allergy. 2001;31:1485-92.
40. Hyland ME. Extended network learning error: A new way of
conceptualising chronic fatigue syndrome. Psychology and Health. 2001;16(3):273- 87.
41. Hyland ME. The intelligent body and its discontents. J Health Psychol
2002;7:21-32.
42. Pennebaker JW. The Psychology of Physical Symptoms. New York: Springer-Verlag, 1982.
43. Rousseeuw PJ. Silhouettes: a graphical aid to the interpretation and validation of cluster analysis. Journal of Computational and Applied Mathematics. 1987;20:53-65.
44. Jain AK. Data clustering: 50 years beyond K-means. Pattern recognition letters. 2010;31:651-66.
45. Hebb DO. The organization of behavior: A neuropsychological theory. Psychology Press; 2005.
46. Segerstrom SC, Miller GE. Psychological stress and the human immune
system: a meta-analytic study of 30 years of inquiry. Psychol Bull. 2004 ;130:601- 630.
47. Carter CS, Servan-Schreiber D, Perlstein WM. Anxiety disorders and the
syndrome of chest pain with normal coronary arteries: prevalence and pathophysiology. J Clin Psychiatry. 1996;58:70-3.
48. Takeda N, Morita M, Horii A, Nishiike S, Kitahara T, Uno A. Neural
mechanisms of motion sickness. J Med Invest. 2001;48:44-59.
49. Peterson ND, Henke PG, Hayes Z. Limbic system function and dream
content in university students. J Neuropsychiatry Clin Neuroci. 2002;14:283-828.
50. Hoeijmakers JG, Faber CG, Lauria G, Merkies IS, Waxman SG. Small-
fibre neuropathies—advances in diagnosis, pathophysiology and management. Nature Reviews Neurology. 2012;8:369-79.
51. Lopate G, Pestronk A, Al‐Lozi M, Lynch T, Florence J, Miller T, Levine T, Rampy T, Beson B, Ramneantu I. Peripheral neuropathy in an outpatient cohort of patients with Sjögren's syndrome. Muscle Nerve. 2006;33:672-6.
52. Rosenberg NR, Slotema CW, Hoogendijk JE, Vermeulen M. Follow up of
patients with signs and symptoms of polyneuropathy not confirmed by
electrophysiological studies. Journal of Neurology, Neurosurgery & Psychiatry. 2005;76:879-81.
53. Üçeyler N, Zeller D, Kahn AK, Kewenig S, Kittel-Schneider S, Schmid A,
Casanova-Molla J, Reiners K, Sommer C. Small fibre pathology in patients with fibromyalgia syndrome. Brain. 2013;136:1857-1867.
54. Brown AA, Jason LA. Validating a measure of myalgic
55. Friedberg F, Dechene L, McKenzie MJ, Fontanetta R. Symptom patterns in long-duration chronic fatigue syndrome. J Psychosom Res. 2000;48:59–68.
56. Nisenbaum R, Reyes M, Mawle AC, Reeves WC. Factor analysis of unexplained severe fatigue and interrelated symptoms. 1998;148:72–77 57. Tsai CJ. Factor analysis of the clustering of common somatic symptoms: a preliminary study. BMC Health Services Research. 2010; 10. 160.
58. López-Pousa S, Garre-Olmo J, de Gracia M, Ribot J, Calvó-Perxas L,
Vilalta-Franch J. Development of a multidimensional measure of fibromyalgia symptomatology: The comprehensive rating scale for fibromyalgia
symptomatology. J Psychosom Res. 2013; 74: 384-392.
59. Carver CS, Scheier MF. Control theory: A useful conceptual framework for
personality–social, clinical, and health psychology. Psychol Bull. 1982;92:111-135.
60. Hyland ME. Control theory interpretation of psychological mechanisms of
depression: comparison and integration of several theories. Psychol Bull. 1987;102:109-121.
61. Carver CS, Scheier MF. Origins and functions of positive and negative
affect: A control-process view. Psychol Rev. 1990;97:19-35.
62. Katsarava Z, Obermann M. Medication overuse headache. Topics in Pain
Management. 2013;29:1-7.
63. Kempke, S., Luyten, P., Claes, S., Goossens, L., Bekaert, P., Van Wambeke, P. & Van Houdenhove, B. (2013). Self-critical perfectionism and its relationship to fatigue and pain in the daily flow of life in patients with chronic fatigue syndrome. Psychol Med, 43, 995–1002
64. Hyland ME, Hinton C, Hill C, Whalley B, Jones RC, Davies AF.
Explaining unexplained pain to fibromyalgia patients: finding a narrative that is acceptable to patients and provides a rationale for evidence based interventions. Brit J Pain 2016;10:156-161.
65. Fitzcharles MA, Ste-Marie PA, Goldenberg DL, Pereira JX, Abbey S,
Choinière M, Ko G, Moulin DE, Panopalis P, Proulx J, Shir Y. 2012 Canadian guidelines for the diagnosis and management of fibromyalgia syndrome: executive summary. Pain Res Manage. 2013;18:119-26.
66. Baker R, Shaw EJ. Diagnosis and management of chronic fatigue syndrome
or myalgic encephalomyelitis (or encephalopathy): summary of NICE guidance. BMJ:. 2007;335:446-448.
67. Davies T. I129 Body reprogramming for functional disorders: A new
paradigm. Rheum 2016, 55(suppl 1), i25-i25.
Table 1. Symptom clusters and reliability of each cluster group Cluster number
and reliabilitya
Symptoms
1 Fatigue for no reason; Fatigue increasing the day after you are active; Waking up still feeling .89 tired; Mental fog; Difficulty concentrating; Memory problems; Easily feel too hot/sweating;
Difficulty getting to sleep; Waking up often at night
2 Nightmares/night terrors; Head cold, sore throat or 'flu; Mouth ulcers (sores in mouth); Cold sores .81 (on or near lips); Skin rash; Boils or pimples on face or body; Twitching of eyelid; Twitching
other than eyelid; Choking sensations; Loss of voice; Double vision
3 Chest pain; Heartburn; Nausea for no reason; Very vivid dreams; Racing heart; Feeling faint; .78 Feeling very ill for no reason
4 .76
Thirsty all the time; Blocked nose; Running nose; Itchy skin; Itchy eyes
5 Pain in legs and arms (which is not due to hard exercise); Pain moving from one place of body to .90 another on different days; Back pain; Sensitive or tender skin; Pain increasing the day after you
are active; More clumsy than others; Sensitivity to bright lights; Sensitivity to noise
6 Headaches; Stomach pain; Diarrhoea; Constipation; Bloating of the stomach; Intolerant to some .67 food
7 -
Urinating two or more times per night
8 .88
Depression; Feeling anxious for no reason; Irritable; Jittery. Easily startled, often worried
9 .85
Easily feel too cold; Very cold hands or feet
10 -
Ringing in ears
11 Swollen, painful joints; Fatigue increasing after a cold or sore throat; Hands tremble or shake;
.81 Face flushes; Cramps in leg, foot or bottom; Numbness/tingling/pins and needles; Feeling out of breath for no reason
Table 2. Mean (standard deviations) of activation levelsa of groups of participantsb when presented to the clusters and cluster characteristics.
Cluster no.
Reliabilityc IBS-low, N FMS-low, CFS-low,
Effect
sized IBS-high, FMS-high, CFS-high, Effect sized (n items) = 321 N = 198 N = 98 low N = 49 N = 186 N = 48 high
1 0.57 (0.09) 0.80 (0.07) 0.82 (0.06) .371*** 0.89 (0.04) 0.93 (0.03) 0.92 (0.03) .057*** .89
(9)
2 0.27 (0.03) 0.29 (0.04) 0.32 (0.04) .049*** 0.44 (0.05) 0.46 (0.06) 0.48 (0.05) .009 .81
(11)
3 0.41 (0.07) 0.42 (0.06) 0.51 (0.07) .076*** 0.72 (0.06) 0.67 (0.06) 0.70 (0.06) .021 .78
(7)
4 0.46 (0.08) 0.52 (0.09) 0.44 (0.08) .034*** 0.73 (0.08) 0.74 (0.07) 0.71 (0.08) .006 .76
(5)
5 0.41 (0.07) 0.73 (0.07) 0.63 (0.09) .489*** 0.78 (0.06) 0.91 (0.04) 0.84 (0.05) .242*** .90
(8)
6 0.65 (0.06) 0.48 (0.07) 0.49 (0.07) .294*** 0.80 (0.05) 0.69 (0.06) 0.68 (0.06) .123*** .67
(6)
7 0.43 (0.15) 0.45 (0.16) 0.43 (0.15) .001 0.64 (0.15) 0.68 (0.16) 0.63 (0.16) .005 -
(1)
8 0.54 (0.12) 0.56 (0.10) 0.50 (0.11) .007 0.86 (0.07) 0.81 (0.08) 0.75 (0.10) .046** .88
(4)
9 0.61 (0.15) 0.74 (0.14) 0.69 (0.14) .038*** 0.91 (0.09) 0.88 (0.09) 0.91 (0.07) .004 .85
(2)
10 0.41 (0.15) 0.47 (0.16) 0.48 (0.15) .010* 0.57 (0.16) 0.65 (0.16) 0.65 (0.15) .010 -
(1)
11 0.37 (0.07) 0.52 (0.07) 0.49 (0.06) .208*** 0.65 (0.07) 0.77 (0.05) 0.71 (0.05) .128***
.81
(7)
a Interpretation of symptom frequency from activation levels: 0.16 = never or almost never, 0.33 = less than 3 or 4 times per year, 0.5 = every month or so, 0.66 = every week or so, 0.83 = more than once per week, 1.0 = every day.
b Activation levels calculated for those 900 participants who report only one diagnosis. c Reliability (alpha coefficients) calculated from the total 1751 sample.
Figure 1. Figure 1 shows the network created by our algorithm. Each node in the graph,
Appendix
Finding the symptom clusters
Each symptom was treated as a point, p, in an m-dimensional space, where m is the number of participants in the dataset. The distance, 𝑑(𝑝𝑎, 𝑝𝑏) between two points, 𝑝𝑎, 𝑝𝑏 was defined as:
𝑑(𝑝𝑎, 𝑝𝑏) = √∑𝑚 ( 𝑝𝑎 −𝑝𝑏 )2 [1]
𝑖=1 𝑖 𝑖
Symptoms were clustered based on the frequency of their co-occurrence across participants. This approach resulted in a set of network nodes, each characterized as a cluster of
symptoms. To find the symptom clusters, the K-Means[44] algorithm was used. This is a well-known method that has been widely used across a range of fields [31]. The principle underlying the algorithm is to cluster the data into n groups by minimizing the within-cluster sum-of-squares.
The algorithm consists of the following steps:
1.Start with initial guesses for cluster centres; random points in the feature space. 2.For each symptom vector, find the closest cluster centre (partitioning step). 3.Replace the centroid of each cluster by the average of the symptom vectors in its partition
4.Iterate 1+2 until convergence
The only free parameter is the tolerance for determining cluster convergence ( = 0.0001). The other parameter required by K-Means is the number of clusters, n. The best choice for n
was determined from the data using the silhouette method [43]. The result of this stage of processing was a set of 𝑛 = 11 symptom clusters, each of which had similar variance across the set of patients.
Determining the network’s connectivity
Having clustered the symptoms to form the nodes of the network, the next step was to form the connections between the nodes. Each node has the potential to connect to every other node. The strengths of the connections between them regulate the activation propagated between the connected nodes when the completed network is activated with the participant data.
At this stage, instead of considering each symptom as a point in the data space, each patient was treated as a 61-dimensional point, q, with 61 features corresponding to their scaled questionnaire responses. To determine the network connectivity, the data relating to each participant was used as input to the network. In what follows the term ‘presenting a
𝑘=1,𝑘≠𝑗
Following presentation of each item, the connection strengths between all pairs of nodes i and
j (where i, j = 1:n, i ≠ j) was calculated according to the Generalized Hebbian Algorithm [33]:
∆𝑤𝑖𝑗 = 𝜀(𝑦𝑖𝑥𝑗− 𝑦𝑖∑𝑛 𝑤𝑘𝑗𝑦𝑘) [2]
where 𝑤𝑖𝑗is the connection strength from node i to j, and 𝜖is the learning rate; 𝜖, the only free parameter in this stage was set to 0.01. The input vector, 𝑥, is the initial activation of the nodes derived from the participant's data. The output vector, 𝑦, represents the activation of the nodes based on the propagation of the initial activation throughout the network.
In detail, presentation of each participant to the network proceeds as follows. First the initial activations of the nodes are determined by the participant's scaled symptom scores. Each node is activated by sum of its associated symptom scores from that participant; i.e. for node
𝑖:
𝑥𝑖 = tanh [ 1 ∑𝑁𝑖 𝑞𝑘 ] [3]
𝑁𝑖 𝑘=1
where 𝑁𝑖 is the number of symptoms in cluster 𝑖and 𝑞𝑘 is the scaled magnitude of each symptom. The hyperbolic tangent function, tanh, constrains the initial activation values to lie in the range [0,1] and ensures that each cluster contributes equally to the initialization of the network regardless of the number of symptoms associated with it. After presentation of all participants, the connection strengths are normalized:
𝑤 = 𝑤𝑖𝑗 [4]
𝑖𝑗 𝑛
𝑘,𝑙=1,𝑘≠𝑙𝑤𝑘𝑙2
The resulting trained network, with nodes corresponding to clusters of symptoms, and connections between nodes determined by co-occurrences of symptoms, essentially provides a descriptor of the symptoms and their relationships, irrespective of any particular disorder.