Published online January 10, 2013 (http://www.sciencepublishinggroup.com/j/ijnfs) doi: 10.11648/j.ijnfs.20130201.13
An optimized method for profiling glucosinolate content
in Brassica enabling plant line selection and Quantitative
Trait Locus mapping
Reem Issa
1,*, Guy Barker
2, Andrew Marsh
1, Susan E. Slade
2, Paul Taylor
11
Department of Chemistry, University of Warwick, Coventry, CV4 7AL, UK 2
School of life sciences, University of Warwick, Coventry, CV4 7AL, UK
Email address:
[email protected] (R. Issa)
To cite this article:
Reem Issa, Guy Barker, Andrew Marsh, Susan E. Slade, Paul Taylor. An Optimized Method for Profiling Glucosinolate Content in Brassica Enabling Plant Line Selection and Quantitative Trait Locus Mapping. International Journal of Nutrition and Food Sciences. Vol. 2, No. 1, 2013, pp. 10-16. doi: 10.11648/j.ijnfs.20130201.13
Abstract:
A reproducible and robust enzymatic desulfation reaction utilizing Sulfatase enzyme from Helix pomatia type H1, was developed and used in conjunction with an optimized HPLC-UV/ESI-MS/MS method developed in this study, for complete separation and identification of desulfated glucosinolates, extracted from 89 AGDH mapping population derived from a cross between rapid cycling Brassica oleracea lines; A12DH and GD33DH with high resolution for quantification measurements were used. In addition, we have demonstrated the first use of two internal standards during the preparation of the plant material for analysis, which significantly improved the reproducibility of the quantitative measurements. The quantitative data were then used for the identification of significant Quantitative Trait Loci (QTL) for individual glucosi-nolates and for key points in their biosynthesis, revealed for the presence of major gene effect near the top of B. oleracea linkage group 9 (LG9), associated with aliphatic glucosinolate synthesis. Moreover, a number of novel QTLs were also identified, which control the synthesis of glucosinolates.Keywords:
Brassicaceae; HPLC-UV/ESI-MS/MS; QTL; Glucosinolates; Sulfatase1. Introduction
The Brassicaceae family consists of vegetable crops of agricultural and nutritional importance due to their phyto-chemical content, of which the active compounds glucosi-nolates are of most interest in this and related studies [1, 2]. The genus Brassica contains a number of important agri-cultural species, such as rape seed (B. napus), cabbage (B. oleracea), turnip rape (B.rapa) and mustard (B. nigra, B. juncea and B. carinata) [3], which are linked with genomic relationship referred to as the triangle of U [4]. Genes af-fecting glucosinolate biosynthesis have been previously identified in Arabidopsis [5, 6, 7] and in other Brassica species such as in B. rapa [8]. Consequently, information developed in any chosen Brassica can be applied to other Brassica species as a result of the close relatedness of the species [9, 10, 11, 8, 12].
The glucosinolates are a uniform class of ß-thioglucosides grouped into three major groups, namely aliphatic, indolic and aromatic glucosinolates, according to their side-chain
structure (R) (Figure 1), which represent the precursor amino acids involved in the biosynthesis of the individual compound [13] via independent metabolic pathways, and share a common set of enzymes that is involved in the core structure formation of glucosinolates under genetic control [14].
Figure 1. The general structure of glucosinolate [13, 14].
goi-trogenic and growth retardation activity on animals, but no similar effect on humans was detected [17]. It is also known that some cabbage aphids feed on cruciferous plants and are able to store glucosinolates in their intact form, which they can later use for defence against attack from other herbivores causing tissue damage [18]. Therefore, the need for im-proving plant metabolomics research through different analytical and genetic tools are necessary to ensure relative compositions of metabolites to toxic or sensorial unaccept-able compounds are optimal and under control [19].
Therefore, in this study we aim to genetically map regions regulating the synthesis of individual glucosinolates in B. Oleracea mapping populations, with the aim of using such information to optimize the glucosinolates content in vege-table crops.
2. Results & Discussion
2.1. Development of An Optimized Method for Glucosi-nolate Extraction and Desulaftion
The average peak area (APA) for desulfated glucosino-lates in the UV chromatograms, obtained from the concen-trations dependant desulfation reactions, showed the desul-fated glucosinolates were eluting reproducibly from the HPLC column in replicates. By increasing Sulfatase enzyme solution concentration, an increase in the APA for the de-sulfated glucosinolates (desulfoglucoraphanin, desulfoglu-cobrassicin, 4-methoxyglucobrassicin and desulfo-neoglucobrassicin) was observed, until the measurements plateaued within the range 1.25-3.75 U/ mL, which indicated that the desulfation reaction of these glucosinolates had reached equilibrium, except for desul-fo-4-methoxyglucobrassicin, the APA showed a plateau at enzyme solution concentration range of 3.75-5 U/ mL, within this range, desulfation of 4-methoxyglucobrassicin (as well as all other glucosinolates in the extract) reached equilibrium. For maximum desulfation reaction, a solution of Sulfatase enzyme contains 10 U/ mL was used for de-sulfation of glucosinolates in all plant samples.
A suitable IS1 should be chosen based on the lack of en-dogenous glucosinolate in the plant material. Therefore, glucotropaeolin was used as "IS1" rather than singrin, which is naturally synthesised in these plants population. At ratio of 0.3g dry leaf material to 2 µ moles of IS1, the UV chro-matogram showed peak for IS1, with an APA was within the range observed from endogenous desulfated glucosinolates in the plant lines. Therefore, this level of IS1 was determined to be the optimal concentration and used for the quantitative measurements.
The relative peak area (RPA) for individual compounds was calculated based on IS1 peak, the standard deviation in three technical replicates, and the % of the ratio of standard deviation to the RPA showed significant variations were observed, which may lead to inaccurate or imprecise quan-titative measurements. However, when sinigrin was used as "IS2" added to each sample prior to injection into the HPLC,
and was used as a base peak for the quantitative measure-ment of glucosinolates. The results show less variation was obtained between the technical trials (Table 1).
Table 1. Variations in the relative peaks area obtained from UV chroma-tograms, based on IS1 and IS2. RPA: relative peak area, STDEV: standard deviation, and % STDEV/RPA: ratio of standard deviation to relative peak.
Compounds
RPA based on IS1
RPA based on
IS2
STDEV based on
IS1
STDEV based on IS2
% STDEV / RPA based on IS1
% STDEV / RP based on IS2
IS2 ---- 1.0 ---- 0.0 ---- ----
IS1 1.0 0.0775 0.0 0.0027 ---- 3.5%
Desulfoglucora-phanin 0.0696 0.0761 0.0072 0.0066 10% 8.7%
Desulfoglucobras-sicin 1.6842 0.0317 0.2434 0.0029 14% 9.0%
Desul-fo4-methoxygluco brassicin
2.4499 0.1111 0.2135 0.0057 9% 5.0%
Desulfoneogluco-brassicin 2.7687 0.1257 0.2983 0.0126 10% 10.0%
The desulfated glucosinolates were all identified by their characteristic m/z values, that is presenting their [M+H]+ and [M+Na]+ ions [20]. Confirmation of their identity using MS/MS fragmentation method, produces a typical fragment ion for all desulfated glucosinolates with the general formula of [M+H-C6H10O5] + and the observation of fragment ion with 162.1 Da less than the precursor ion (Table 2). Fur-thermore, other structure specific fragments dependent on the R side chain, were used for structural determination of desulfated glucosinolates that have the same m/z value [21, 22].
Table 2. Desulfated glucosinolates detected from different AGDH plant lines identified with their RT and m/z using MS and MS/MS fragmentation method. Additional structure-specific fragments were used to distinguish desulfated glucosinolates with identical molecular weight.
Desulfated glucosinolates
RT (min)
[M+ Na] +
(m/z)
[M+ H] +
(m/z)
MS/MS typical fragment ion
(m/z)
MS/MS other characteristic fragment ion
(m/z)
Desulfoglucora-phanin 8.5 380.0 358.0 196.0
Desulfoprogoitrin 8.7 330.0 310.0 148.0
Desulfosinigrin 11.2 302.0 280.0 118.0 Desulfogluco-
napin 16.3 316.0 294.0 132.0
Desulfogluco-
brassicin 22.2 391.0 369.0 207.0
Desulfo-4 -methoxyglucobra ssin
23.5 421.0 399.0 237.0 160.0 [R] +
Desulfone-
oglucobrassicin 27.0 421.0 399.0 237.0
2.2. Selected AGDH plant lines of biological interest
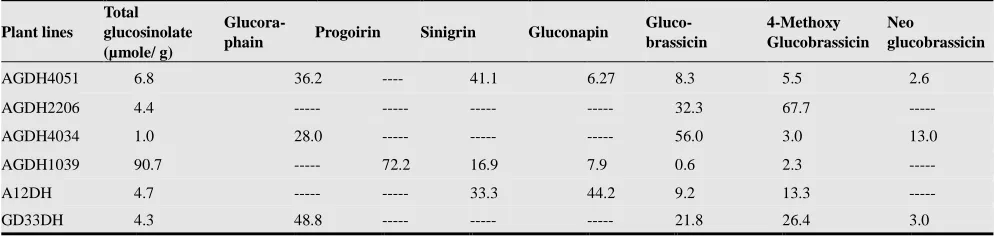
Investigating the plant lines selected based on their glu-cosinolate profiles, revealed some interesting plant lines that have potential biological applications including medical, agricultural, economic and consumer acceptance (Table 3).
The highest content of total glucosinolates observed among all the analysed plant lines in this population, was for AGDH1039, composed mainly of progoitrin. The disad-vantages of these vegetable crops are not only the bitter taste [13], but also the toxic effect of the hydrolysis product de-rived from progoitrin [23].
Table 3. Comparison between 6 selected plant lines of biological interest; showing the content for individual glucosinolate as a percentage of the total glucosinolate content.
Plant lines
Total glucosinolate (µmole/ g)
Glucora-phain Progoirin Sinigrin Gluconapin
Gluco- brassicin
4-Methoxy Glucobrassicin
Neo
glucobrassicin
AGDH4051 6.8 36.2 ---- 41.1 6.27 8.3 5.5 2.6
AGDH2206 4.4 --- --- --- --- 32.3 67.7 ---
AGDH4034 1.0 28.0 --- --- --- 56.0 3.0 13.0
AGDH1039 90.7 --- 72.2 16.9 7.9 0.6 2.3 ---
A12DH 4.7 --- --- 33.3 44.2 9.2 13.3 ---
GD33DH 4.3 48.8 --- --- --- 21.8 26.4 3.0
The plant line AGDH2206 was found to have the highest total indolic glucosinolate content, with no detectable con-tent of any of the aliphatic glucosinolates. Also, it was found to contain the highest content of 4-methoxyglucobrassicin, in addition to its relatively high content of glucobrassicin. This suggested potential anti-fungal defensive activity for this plant material, which is important for agricultural ap-plications as an organic bio-fumigant [24]. Moreover, the dietary benefit of glucobrassicin is known to decrease the risk for breast cancer [25].
The lowest content of aliphatic glucosinolates was found in the plant line AGDH4034. Such a vegetable crop would have higher consumer acceptance because of the good taste, but with minimum health benefits due to its low total glu-cosinolate content. However, it has the highest relative composition of glucobrassicin to its total glucosinolates content.
In this study, the parental plant line GD33DH synthesised glucosinolates with the highest percentage of glucoraphanin. Studies on the health promoting effects of individual prod-ucts derived from glucoraphanin hydrolysis, the most im-portant of which is sulforane, are the focus of the clinical research to find potential cancer prevention and/ or treat-ment compounds. In addition, glucoraphanin may help protect from serious chronic diseases affecting the cardi-ovascular or the nervous system [25]. The benefit of pro-ducing this plant crops is that the hydrolysis product sulfo-ran is not volatile and so, will not affect the flavour or the aroma of the vegetables [26].
The plant line AG4051 was found to synthesis a combi-nation of glucoraphanin and sinigrin at the highest content compared to the AGDH plant lines, when progoitrin was not observed. In addition to the previously discussed benefits of glucoraphanin, sinigrin is known as a powerful biofumi-gant glucosinolate, due to the production of the hydrolysis product allyl isothiocyanate [9, 27]. Also it is a precursor for isothiocyanate, known for its anticancer activity [17, 28].
Therefore, this plant line is considered important for de-veloping a crop for a healthy diet in addition to the other possible agricultural applications. On the other hand, a vegetable crop with this glucosinolate profile is considered a safe material for feeding animals due to the natural absence of progoitrin.
The parental plant line A12DH, was found to synthesis glucosinolates with a highest composition for gluconapin within all AGDH plant lines, followed by sinigrin (gluco-sinolates containing alkene bonds). Such plant has the dis-advantage of the bitter taste [13], however they are known for their health benefits.
2.3. Comparison of QTLs Mapped for Glucosinolates on the AGDH Genetic Map with Corresponding Regions of A. Thaliana and B. Rapa
In this study, the QTL identified on LG8 which controls the content of aliphatic glucosinolates, showed co-linearity with the position of CYP79F1/F2 gene (coding for enzymes catalysing the core structure formation of aliphatic gluco-sinolates) [5], which has been previously identified at a similar position in Arabidopsis [29]. The QTLs controlling the content of aliphatic glucosinolates were mapped on LG7 and on LG9, suggesting the presence of potential CYP79F1/F2 like gene at the same positions.
The positions of the Gls-ALK and Gls-OH genes (coding for enzymes catalysing double bond formation and hydrox-ylation reactions on the R group side chain respectively) have been previously identified in the Brassica genome on LG9 by Gao & coworkers [30] and Kliebenstein & co-workers [5]. Comparative analysis of QTLs identified in this study, that control the synthesis of progoitrin mapped on LG3, showed co-linearity with regions on the Arabidopsis genome where the Gls-OH gene has been mapped. Similar QTLs mapped on LG7 and LG8 suggested the presence of potential Gls-OH like genes, which have not been yet iden-tified in Brassica or Arabidopsis co-linear regions. The Gls-ALK gene has been identified at the co-linear region for the QTLs mapped on LG9, which control the synthesis of sinigrin and gluconapin. Therefore, similar QTLs mapped on LG3, LG5, LG7 and LG8, control the synthesis of glu-cosinolates with a double bond in their side chain, suggest-ing the presence of potential Gls-ALK like genes underlysuggest-ing these QTLs.
The QTLs mapped on LG1 controlling the synthesis of glucobrassicin, showed co-linearity with regions on the Arabidopsis genome, where the CYP83B1 gene (controlling the core structure formation of indolic glucosinolates) has been identified [11]. Therefore, the QTLs mapped on LG2, LG5 and LG9 control the synthesis of total indolic gluco-sinolates, neoglucobrassicin, and total indolic glucosinolates and glucobrassicin respectively, suggesting the presence of potential CYP83B1 like genes to occur at the same positions. However, QTL for the synthesis of nuoglucobrassicin mapped on LG5, where the genen(s) controls conversion of glucobrassicin into neuglucobrassicin has not been yet identified. Therefore, comparative analysis investigating QTLs that have been identified in B. oleracea, B. rapa, and A. thaliana re-inforced that the QTLs observed in this study were important in determining glucosinolate content and were in agreement with other published results [30, 27, 5, 11, 8]. In addition, previously identified genes and gene regu-lators in Arabidopsis, would propose potential genes un-derlying the QTLs in the C genome which hasn’t been de-termined yet.
2.4. QTL for Potential Major Gene Effect Controlling Aliphatic Glucosinolate Content
Interestingly, the QTLs for gluconapin and the sum of gluconapin and sinigrin were highly significant (p<0.001), and were located on LG9 near to each other. The frequency distribution within the trait analysed in the AGDH lines, suggested the presence of a potential gene with a major effect on this trait underling these QTLs.
Approximately half the plant lines produced a detectable level of gluconapin and half did not, while 35% of the plant lines produced a detectable level of sinigrin and 65% did not. In addition, by comparing the concentrations of gluconapin with those of progoitrin, two expression patterns of these traits were observed, in which either progoitrin was ex-pressed at much higher concentrations than that of its
pre-cursor gluconapin, or not being expressed at all. Therefore, a possibility of having the same effect on the other glucosi-nolates linked to the same biosynthetic pathway was pro-posed. Furthermore, gluconapin showed linkage to LG9 and mapped convincingly as a single locus at 9 cM, indicating that a major gene controlling the content of gluconapin is associated with this locus. This result agrees with other previous results, were a single dominant Mendelian gene in B. oleracea controls the production of alkene side chain glucosinolates, has been mapped on LG9, at the interval between the markers pW157 and pW137 at 12.3 and 23.4cM, respectively [27].
As expected, mapping QTLs of aliphatic glucosinolates using data model that removes the major gene effect; a QTL for progoitrin was observed within the same interval of the previously identified QTL for gluconapin on LG9, and was in agreement with that described by Mithen & coworkers [31], where the Gls-ALK gene has been mapped on chro-mosome At4 in A. thaliana as a single dominant Mendelian gene. The previously mapped QTL for progoitrin in B. ole-racea by Gao & coworkers [30] was at a position co-linear with the Gls-OH gene position on chromosome At2 in A. Thaliana, whose phenotype is the presence or absence of progoitrin. These two potential genes were proposed at a region co-linear with the top region of LG9 in the AGDH linkage map used in this study [5, 29, 32, 33] , which sup-ported the prediction of a potential major gene underling the observed QTLs, controlling the synthesis of gluconapin and progoitrin.
The same comparative analysis with Arabidopsis was applied for investigation of QTLs that control the glucosi-nolates content, where a potential major gene effect was proposed. Consequently, QTLs mapped on LG5 and LG7 coding for the content of aliphatic glucosinolates with 3 or 4 carbon side chains, proposed potential MAM gene like family, which has not been yet identified in the Brassica or Arabidopsis co-linear region, to underlies these QTLs. In addition, QTLs mapped on LG3, LG5 and LG7, which control the synthesis of glucosinolates with alkenyl side chains, proposed potential Gls-ALK like genes at similar positions underlying these QTLs, while a QTL controls the synthesis of progoitrin mapped on LG7, proposed potential Gls-OH like genes at a similar position.
3. Experimental
3.1. General Material
Glucotropaeolin (benzyl glucosinolate) from Applichem. Sinigrin (2-propenyl glucosinolate), Ba(OAc) 2, Pb(OAc)2 .
3H2O and Sulfatase (aryl sulfohydrolases, (EC 3.1.6.1)
3.2. The Genetic Map
The 89 AGDH mapping population is derived from a cross between rapid cycling B. oleracea line; A12DH (var. alboglabra) as the female parent and the broccoli line GD33DH (var. italica) as the male parent [34]. Several ver-sions of the genetic map for this population have been pub-lished [34, 35, 33] . The map has been recently updated with the addition of a number of SSR markers and mapped gene loci (GR Teakle, University of Warwick, unpublished re-sults). A subset of markers distributed at approximately 10 centi-Morgan (cM) intervals, selected based on having the most complete genotype information was used [36].
3.3. Plant Material
The AGDH population was grown under controlled en-vironmental conditions; with each plant line was represented by three genetically identical plants. Young fully expanded healthy leaves were collected at the bud initiation stage from the three plants as a bulk material, and were mixed in order to pool homogeneous plant material.
3.4. Extraction & Desulaftion of Glucosinolates
Optimization of the Desulaftion Reaction Conditions:Five fractions of GD33DH each of 0.3 g of plant material; were extracted with boiling water, using 2 µmol glocotropaeolin (IS1), 30 µmol Pb(OAc)2 and 30 µ mol Ba(OAc)2 to preci-pitate proteins and free sulphate ions [37]. After 10 min boiling followed by 30 min agitation and sonication, the samples were cooled to 4 ˚C and centrifuged at 3000 g for 40 min. The supernatant of the plant extract was then loaded onto the Sephadex column. The column were flushed with methanol and equilibrated with sodium acetate buffer (pH= 5.5), and then treated overnight with 1 mL of solution of Sulfatase ultimately containing 0.25, 1.25, 2.5, 3.75 and 5 U prepared as described by Graser et al. [38], and then adjusted into 40 ml final volume with acetate buffer prior to incuba-tion in a shaking incubator at 37 °C and 80 rpm for 18 hrs. The desulfated glucosinolates was eluted with 60% aqueous methanol. The eluent was evaporated and re-suspended in 2 mL of 0.1% formic acid.
Optimization of IS1 concentration: A 0.3g of GD33DH plant material were extracted with 0.3, 1.5 and 2 µmoles of IS1, and then desulfated with 10 U of sulfatase enzymes, using the optimized reaction conditions.
Optimization of IS2 concentration: Serial dilutions of in-tact sinigrin (IS2) were prepared (1, 2 and 6 mg/ mL). An aliquot containing 5 µL of each concentration was diluted 10-fold in water and injected into the HPLC column. The optimum concentration was selected that provided APA of IS2 similar to those of the analysts of interest. This concen-tration was further validated by addition to a plant extract and analysed in triplicate.
3.5. HPLC-UV/ESI-MS/MS Method for Separation & Identification of Desulfated Glucosinolates
An HPLC (Thermo Fisher Scientific), fitted with a Zor-bax Eclipse (XDB-C18 4.6 × 150 mm 5 µ m) column with an in-line Zorbrax reliance analytical guard column (4 × 80 mm, 5 µm) (Agilent Technologies) were used, utilizing a full loop injection (25 µL), with all samples housed at ambient room temperature. A quaternary pumping system using 0.1% formic acid (solvent A) and 0.1% formic acid in acetonitrile (solvent B) with a linear gradient composed of 5% B (2 min), 5-40% B (26 min), 40-41% B (2 min), 41-95% B (5 min), with a flow rate of 0.25 mL/ min was used to resolve the desulfated glucosinolates, followed by a washing cycle composed of 95% B (5 min), 95-5% B (2 min), 5% B (14 min) with a flow rate of 0.4 mL/ min. A photodiode array detector was used to collect spectral data from 200-600 nm, using one channel at 229 nm for the absorbance maxima of desulfated glucosinolates.
Identification of desulfated glucosinolates was achieved using an inline Thermo Fisher Scientific electrospray ioni-sation (ESI) LTQ XL mass spectrometer, combined with linear ion trap mass analyser, and utilizing the Xcalibur LTQ program Rev 2.5.0. The ESI nozzle was held at 5 kV with a temperature of 280 °C operated in positive ion mode for the detection of desulfated glucosinolates using full scan mode. A mass inclusion list was created, containing the expected m/z of protonated desulfated glucosinolates precursors [17] as shown in Table 2. MS/MS fragmentation method was used at normalised collision energy of 35 with a 2 Da isola-tion width on the precursor ion observed for 30 msec.
3.6. Development of Statistically Valid Method for Quan-tifying Desulfated Glucosinolates
The Avalon peak detection algorithm was used for inte-grating peaks. The absolute peak area of desulfated gluco-sinolates was converted to RPA based on IS2. The relative response factor (RRF) was used in order to correct for dif-ferences in the UV absorbance between different desulfated glucosinolates. The content of each glucosinolate relative to IS1, expressed in (µ moles/g) of completely dried sample was calculated using the equation described in the standard protocol [37]. For this study, RRF were derived relative to desulfoglucotropaeolin, with a generic lower limit of detec-tion for individual desulfated glucosinolates was determined, based on the minimum relative concentration at which the characteristic fragment in the MS/MS spectrum was ob-served (Table 4).
Table 4. Relative response factors (RRF) for desulfated glucosinolates relative to IS1 determined at 229 nm as described in (EEC, 1990), with the lower limit of detection for individual desulfated glucosinolates.
Desulfated glucosinolate RRF Lower limit of detection (µmole/ g)
Desulfoglucoraphanin 1.13 0.30
Desulfoprogoitrin 1.15 5.00
Desulfosinigrin 1.05 0.90
Desulfogluconapin 1.17 0.50
Desulfoglucobrassicin 0.31 0.35
Desulfo4-methoxyglucobrassicin 0.26 0.03
3.7. QTL Mapping
Mapping QTL to chromosomal regions was performed using Windows QTL Cartographer (ver 2.5, Win QTL Cart), the IM and CIM analysis were used. Kosambi mapping function was used with precision of 2 cM, using the standard model 6, control marker number 5, window size of 10 cM and the forward regression method. The results were con-firmed by reanalysing the data using Map QTL® ver 4.0 analysis [39]. The data model used was based on the average concentration for the individual glucosinolates, and on the sum of glucosinolates of the same chemical class obtained from three technical replicates. In addition, the sum of sini-grin and gluconapin was used to map QTLs control of the alkene bond formation. When a plant line did not express a glucosinolate at a concentration that could be detected, an arbitary figure of half the concentration of the lower limit of detection was used. These concentration values were log10 transformed to increase the homogeneity of variance be-tween plant lines.
4. Conclusion
The ability of performing precise analysis of glucosino-late content in plant extracts will increase the potential for using complementary supplements of phytochemicals that is known for their activity in prevention and treatment of cancer, or for use as natural bio-fumigants. Therefore, a protocol with combination of the quantitative data and ge-netic analysis of glucosinolate profiles was developed and used to infer the existence of factors at distinct loci and associated these with specific steps in the biosynthesis pathway of glucosinolates in B. oleracea. In addition, markers tightly linked to the newly identified QTLs could be adopted for marker assisted breeding strategies, utilizing different genomic approaches. Consequently, this informa-tion can be applied to other Brassica species for breeding vegetable crops with altered glucosinolate profiles.
Acknowledgments
We thank Zennia Paniwnyk, Andy Jukes, for assistance with the chromatography and mass spectrometry analysis. Also for Richard Jackson, Julie Jones for assisting with the statistical and graphical presentations and also to Kerry-Sue Peplow for support with cultivating the plant materials. We would like to thank Dr James Lynn, Dr Peter Walley and Dr Graham Teakle, for their help, support and assistance in QTL mapping.
References
[1] Francisco, M., Moreno, D. A., Cartea, M. E., Ferreres, F., Garcia-Viguera, C., & Velasco, P. (2009). Simultaneous identification of glucosinolates and phenolic compounds in a representative collection of vegetable Brassica rapa. Journal of Chromatography A, 1216, 6611-6619.
[2] Meyer, M., & Adam, S. T. (2008). Comparison of glucosi-nolate levels in commercial broccoli and red cabbage from conventional and ecological farming. European Food Re-search and Technology, 226, 1429-1437.
[3] Lanner, C., Bryngelsson, T., & Gustafsson, M. (1997). Rela-tionships of wild Brassica species with chromosome number 2n=18, based on RFLP studies. Genome, 40, 302-308. [4] Nagaharu, U. (1935). Genome analysis in Brassica with
special referance to the experimental formation of B. napus and peculiar mode of fertilization. Japanese journal of botany, 7, 389-452.
[5] Kliebenstein, D. J. (2009). A quantitative genetics and eco-logical model system: understanding the aliphatic glucosi-nolate biosynthetic network via QTLs. Phytochemistry Re-views, 8, 243-254.
[6] Mewis, I., Tokuhisa, J. G., Schultz, J. C., Appel, H. M., Ulrichs, C., & Gershenzon, J. (2006). Gene expression and glucosinolate accumulation in Arabidopsis thaliana in re-sponse to generalist and specialist herbivores of different feeding guilds and the role of defense signaling pathways. Phytochemistry, 67, 2450-2462.
[7] Pfalz, M., Vogel, H., & Kroymann, J. (2009). The Gene Controlling the Indole Glucosinolate Modifier1 Quantitative Trait Locus Alters Indole Glucosinolate Structures and Aphid Resistance in Arabidopsis. Plant Cell, 21, 985-999.
[8] Lou, P., Zhao, J., He, H., Hanhart, C., Del Carpio, D. P., Verkerk, R., Custers, J., Koornneef, M., & Bonnema, G. (2008). Quantitative trait loci for glucosinolate accumulation in Brassica rapa leaves. New Phytologist, 179, 1017-1032. [9] Bellostas, N., Sorensen, J. C., & Sorensen, H. (2007).
Pro-filing glucosinolates in vegetative and reproductive tissues of four Brassica species of the U-triangle for their biofumiga-tion potential. Journal of the Science of Food and Agriculture, 87, 1586-1594.
[10] Gao, M. Q., Li, G. Y., Yang, B., McCombie, W. R., & Quiros, C. F. (2004). Comparative analysis of a Brassica BAC clone containing several major aliphatic glucosinolate genes with its corresponding Arabidopsis sequence. Genome, 47, 666-679.
[11] Kliebenstein, D. J., Gershenzon, J., & Mitchell-Olds, T. (2001). Comparative quantitative trait loci mapping of ali-phatic, indolic and benzylic glucosinolate production in Arabidopsis thaliana leaves and seeds. Genetics, 159, 359-370.
[12] Lukens, L., Zou, F., Lydiate, D., Parkin, I., & Osborn, T. (2003). Comparison of a Brassica oleracea genetic map with the genome of Arabidopsis thaliana. Genetics, 164, 359-372. [13] Schonhof, I., Krumbein, A., & Bruckner, B. (2004). Geno-typic effects on glucosinolates and sensory properties of broccoli and cauliflower. Nahrung-Food, 48, 25-33. [14] Halkier, B. A., & Gershenzon, J. (2006). Biology and
bio-chemistry of glucosinolates. Annual Review of Plant Biology, 57, 303-333.
[16] Jin, J., Koroleva, O. A., Gibson, T., Swanston, J., Magan, J., Zhang, Y., Rowland, I. R., & Wagstaff, C. (2009). Analysis of Phytochemical Composition and Chemoprotective Capacity of Rocket (Eruca sativa and Diplotaxis tenuifolia) Leafy Salad Following Cultivation in Different Environments. Journal of Agricultural and Food Chemistry, 57, 5227-5234. [17] Cartea, M., & Velasco, P. (2008). Glucosinolates in Brassica
foods: bioavailability in food and significance for human health. Phytochemistry Reviews, 7, 213-229.
[18] Pratt, C., Pope, T. W., Powell, G., & Rossiter, J. T.(2008). Accumulation of glucosinolates by the cabbage aphid Bre-vicoryne brassicae as a defense against two coccinellid spe-cies. Journal of Chemical Ecology, 34, 323-329.
[19] Hounsome, N., Hounsome, B., Tomos, D., & Edwards-Jones, G. (2008). Plant metabolites and nutritional quality of vege-tables. Journal of Food Science, 73, R48-R65.
[20] Zimmermann, N. S., Gerendas, J., & Krumbein, A. (2007). Identification of desulphoglucosinolates in Brassicaceae by LC/MS/MS: Comparison of ESI and atmospheric pressure chemical ionisation-MS. Molecular Nutrition & Food Re-search, 51, 1537-1546.
[21] Griffiths, D. W., Bain, H., Deighton, N., Botting, N. P., & Robertson, A. A. B. (2000). Evaluation of liquid chromato-graphy-atmospheric pressure chemical ionisation-mass spectrometry for the identification and quantification of de-sulphoglucosinolates. Phytochemical Analysis, 11, 216-225. [22] Matthaus, B., & Luftmann, H. (2000). Glucosinolates in
members of the family Brassicaceae: Separation and identi-fication by LC/ESI-MS-MS. Journal of Agricultural and Food Chemistry, 48, 2234-2239.
[23] Cartea, M. E., Velasco, P., Obregon, S., Padilla, G., & de Haro, A. (2008). Seasonal variation in glucosinolate content in Brassica oleracea crops grown in northwestern Spain. Phytochemistry, 69, 403-410.
[24] Bednarek, P., Pislewska-Bednarek, M., Svatos, A., Schneider, B., Doubsky, J., Mansurova, M., Humphry, M., Consonni, C., Panstruga, R., Sanchez-Vallet, A., Molina, A., & Schulze-Lefert, P. (2009). A Glucosinolate Metabolism Pathway in Living Plant Cells Mediates Broad-Spectrum Antifungal Defense. Science, 323, 101-106.
[25] Jeffery, E. H., & Araya, M. (2009). Physiological effects of broccoli consumption. Phytochemistry Reviews, 8, 283-298. [26] Traka, M., & Mithen, R. (2009). Glucosinolates, isothi-ocyanates and human health. Phytochemistry Reviews, 8, 269-282.
[27] Hall, C., McCallum, D., Prescott, A., & Mithen, R. (2001). Biochemical genetics of glucosinolate modification in Ara-bidopsis and Brassica. Theoretical and Applied Genetics, 102, 369-374.
[28] Higdon, J. V., Delage, B., Williams, D. E., & Dashwood, R. H.
(2007). Cruciferous vegetables and human cancer risk: epi-demiologic evidence and mechanistic basis. Pharmacological Research, 55, 224-236.
[29] Luis Iniguez-Luy, F., Lukens, L., Farnham, M. W., Amasino, R. M., & Osborn, T. C. (2009). Development of public im-mortal mapping populations, molecular markers and linkage maps for rapid cycling Brassica rapa and B. oleracea. Theo-retical and Applied Genetics, 120, 31-43.
[30] Gao, M. Q., Li, G. Y., Yang, B., Qiu, D., Farnham, M., & Quiros, C. (2007). High-density Brassica oleracea linkage map: identification of useful new linkages. Theoretical and Applied Genetics, 115, 277-287.
[31] Mithen, R., Clarke, J., Lister, C., & Dean, C. (1995). Genetics of aliphatic glucosinolates .3. side-chain structure of aliphatic glucosinolates in arabidopsis-thaliana. Heredity, 74, 210-215. [32] Mun, J. H., Kwon, S. J., Yang, T. J., Seol, Y. J., Jin, M., Kim, J. A., Lim, M. H., Kim, J. S., Baek, S., Choi, B. S., Yu, H. J., Kim, D. S., Kim, N., Lim, K. B., Lee, S. I., Hahn, J. H., Lim, Y. P., Bancroft, I., & Park, B. S. (2009). Genome-wide comparative analysis of the Brassica rapa gene space reveals genome shrinkage and differential loss of duplicated genes after whole genome triplication. Genome Biology, 10. [33] Sebastian, R. L., Howell, E. C., King, G. J., Marshall, D. F.,
& Kearsey, M. J. (2000). An integrated AFLP and RFLP Brassica oleracea linkage map from two morphologically distinct doubled-haploid mapping populations. Theoretical and Applied Genetics, 100, 75-81.
[34] Bohuon, E. J. R., Keith, D. J., Parkin, I. A. P., Sharpe, A. G., & Lydiate, D. J. (1996). Alignment of the conserved C ge-nomes of Brassica oleracea and Brassica napus. Theoretical and Applied Genetics, 93, 833-839.
[35] Rae, A. M., Howell, E. C., & Kearsey, M. J. (1999). More QTL for flowering time revealed by substitution lines in Brassica oleracea. Heredity, 83, 586-596.
[36] Barker, G. C., Larson, T. R., Graham, I. A., Lynn, J. R., & King, G. J. (2007). Novel insights into seed fatty acid syn-thesis and modification pathways from genetic diversity and quantitative trait loci analysis of the Brassica C genome. Plant Physiology, 144, 1827-1842.
[37] EEC, (1990). Oil seeds- Determination of glucosinolates. High performance liquid chromatography. Official jornal of European communities, 8, L 170: 127-134.
[38] Graser, G., Oldham, N. J., Brown, P. D., Temp, U., & Ger-shenzon, J. (2001). The biosynthesis of benzoic acid gluco-sinolate esters in Arabidopsis thaliana. Phytochemistry, 57, 23-32.
![Figure 1. The general structure of glucosinolate [13, 14].](https://thumb-us.123doks.com/thumbv2/123dok_us/8483629.1714639/1.595.370.494.593.642/figure-the-general-structure-of-glucosinolate.webp)


![Bis[μ 2 (2 naphthoxy)acetato]bis{aqua[2 (2 naphthoxy)acetato]zinc(II)}](data:image/gif;base64,R0lGODlhAQABAIAAAP///wAAACH5BAEAAAAALAAAAAABAAEAAAICRAEAOw==)