http://www.sciencepublishinggroup.com/j/ajaf doi: 10.11648/j.ajaf.20180604.15
ISSN: 2330-8583 (Print); ISSN: 2330-8591 (Online)
Reduction the Effect of Heat Transmission for the Heat
Capacity of Building Wall in Summer
Takashi Nakaya
Department of Architecture, Faculty of Engineering, Shinshu University, Nagano, Japan
Email address:
To cite this article:
Takashi Nakaya. Reduction the Effect of Heat Transmission for the Heat Capacity of Building Wall in Summer. American Journal of Agriculture and Forestry. Vol. 6, No. 4, 2018, pp. 88-97. doi: 10.11648/j.ajaf.20180604.15
Received: May 24, 2018; Accepted: July 11, 2018; Published: August 23, 2018
Abstract:
For the wall model of a building affected by solar radiation, a one-dimensional transient thermal conduction analysis was conducted. The purpose of the analysis was to examine the effect of wall thickness and heat capacity on heat transfer. On the westward wall in summer, the temperature distribution indoor the wall became parabolic. Even after the evening, the heat flux direction was outdoor from the wall and indoor from the wall, even in the conditions where the sol-air temperature was higher than the indoor temperature. The re-emit of the outside surface continued from evening till the morning of the next day. In the daytime, the heat quantity that entered from the outdoor air into the wall body did not all flow through the room, but a part was re-emitted to the outdoor. Particularly in the case of materials with low thermal conductivity and high volumetric specific heat, the effect of re-emit was remarkable. Regarding the amount of re-emit, the woody material with a large volumetric specific heat and the glass wool with a small volumetric specific heat were compared. It was suggested that the heat capacity could reduce the heat flux.Keywords: Heat, Building Wall, Heat Transmission, Heat Capacity, Numerical Analysis
1. Introduction
Against a backdrop of climate change, the low carbonization of buildings is strongly required as a corporate social responsibility in the sector. In Japan, high insulation of buildings is increasing owing to the Act on the Rational Use of Energy [1]. The evaluation of the thermal insulation performance of a thermal envelope by the Act on the Rational Use of Energy [2] is essentially based on the thermal transmittance. The thermal transmittance is derived by developing the heat balance equation. To simplify the equation, the time change of temperature in the heat balance equation is set to zero. Using this procedure, the time change of temperature and the heat capacity are eliminated from the heat balance equation, and the following characteristics are generated.
a)The heat flux is obtained by multiplying the internal and external temperature differences by the heat transmission coefficient.
b)The value and direction of the heat flux of each part of the wall are constant.
c)The direction of the heat flux is determined by the sign of the temperature difference between the indoor and
the outdoor of the wall.
d)The volumetric specific heat and heat capacity do not affect heat flux.
e)The wall surface and the internal temperature quickly reach a temperature proportional to the thermal resistance.
In a previous research, thermal conductivity [9] and thermal transmittance [10] were measured, and it was reported that wood has a high thermal diffusion coefficient. Furthermore, a mud wall is composed of mud, straw, bamboo, and wood, and has a large heat capacity [8, 9]. In recent years, natural materials have attracted attention owing to their carbon fixing functions and large heat capacities/moisture capacities. Therefore, the development of thermal insulating materials derived from natural materials is being studied. Fukuta [11] developed mats using wood shaving, which is waste from sawing. The mat was developed with thermal insulation performance and sound absorbing performance by thermoforming and adding kenaf fiber as the auxiliary raw material to the scrap of the main raw material. Nakaya [12] measured the thermal conductivity and volumetric specific heat of the wood shaving mat. The thermal conductivity was approximately 0.065 W/(mK), which was influenced by material compounding and mat density. The study also showed that the volume heat was higher than that of mineral fiber insulation. An indoor survey of a building with a large heat capacity reported a phase delay and leveling of room temperature [13-16]. Nakaya [17] measured the thermal environment for three experimental buildings with different wall types. The measurement values were compared among the experimental buildings. The indoor thermal environment and energy consumption cannot be determined only by the magnitude relation of the thermal resistance, and the influence of the heat capacity can be confirmed. However, in these previous studies, a comparison of measured data only suggests the influence of the heat capacity.
The thermal envelope of the building heat flows through the path of the outdoor surface heat transfer, the heat conduction indoor the wall body, and the indoor side surface heat transfer. On the outdoor surface of the wall, the influence of time fluctuation of short wave radiation is large. Therefore, the time variation of the outdoor surface temperature increases. Heat conduction indoor the wall is a diffusion phenomenon. Therefore, the response of the time change of temperature is slower than at the surface. On the outdoor of the walls affected by solar radiation, the surface temperature changes significantly with time. The response rate of temperature differs between the wall surface and indoor. For this reason, the difference in temperature response between the surface and the indoor will be noticeable for thick walls with large volumetric specific heat. That is, with thermal thick walls, the temperature distribution is not proportional to thermal resistance. There is the possibility that the thermal resistance as well as the heat capacity can be affected by the heat quantity flowing through the wall in an unsteady environment.
In this study, a one-dimensional thermal conductivity analysis was carried out on the western wall in the summer season, the wall temperature distribution was calculated, and the surface heat flux was obtained. Then, the influence of heat capacity on the heat quantity flowing through the wall were examined. Regarding the amount of re-emit, the woody material with a large volumetric specific heat and the glass wool with a small volumetric specific heat were compared.
Particularly in materials with low thermal conductivity and large volumetric specific heat, such as wooden walls and wood fiber mats, the effect of re-emit was remarkable.
2. Method
The analysis based on the assumption of having the building walls in summer were carried out. The one-dimensional non-steady heat conduction equation was approximated by the backward finite difference method and a solution was obtained. The heat flux was estimated by multiplying the difference between the air temperature and the wall surface temperature by the heat transfer coefficient. The heat transfer coefficient was assumed to be a constant value. The heat transfer coefficient was set to 23 W/m2K on the outdoor side and 9 W/m2K on the indoor side.The program was written in Visual Basic for Applications (VBA) for Microsoft Excel 2003. The input items were the indoor and outdoor temperature, calculation time interval, thermal properties (thermal conductivity, volumetric specific heat), wall thickness, height, and width of each layer of the multilayer wall. The indoor and outdoor temperature was measured data of the experimental house. The outdoor temperature was the sol-air temperature, and measurement data of the surface temperature of the heat insulating material arranged in the west direction was used. The indoor temperature is the air temperature in the center of the room controlled at 24°C. The calculation time intervals were 10 min intervals, and the spatial division thickness was 1 mm. The output items were the temperature and heat flux. The heat flux was calculated by multiplying the difference between the air temperature and the surface temperature by the surface heat transfer coefficient. The heat quantity was obtained by integrating the heat flux over time. The integration time was 24 h from 00:00 to 24:00. The height and width of the calculated wall body yielded the unit area. The wall model was calculated with one type of material to clarify the thermal characteristics of the material. Table 1 presents the thermophysical properties of the materials. The materials were wood, soil, and insulation (wood fiber mat, high performance glass wool). In this paper, the materials were described as Wood, Mud, Wood Mat, Glass Wool. Wood and soil have a higher volumetric specific heat and a higher thermal conductivity than heat insulating materials. Wood fiber mats have a higher volumetric specific heat and a slightly higher thermal conductivity than glass wool. The volumetric specific heat of wood fiber insulation is approximately 18 times that of glass wool. The wall thickness was calculated at 10 mm intervals in the range 10–100 mm, 50 mm intervals in the range 100–500 mm, and 100 mm intervals in the range 500–1000 mm.
Table 1. Thermophysical properties of materials.
Material Thermal conductivity
[W/(m K)]
Specific heat [kJ/(m3K)]
Wood 0.160 715
Mud 0.690 1126
Insulation (Wood mat) 0.062 238
3. Results and Discussion
3.1. Wall Temperature Distribution and Surface Heat Flux
Figure 1. Time fluctuation of heat flux on wall surface (thickness = 100 mm).
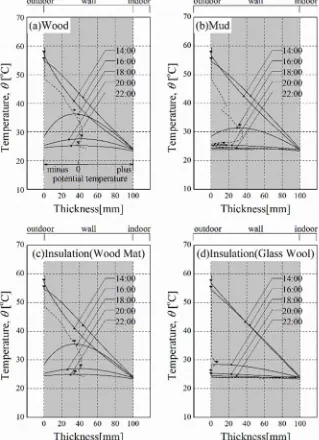
Figure 1 shows the calculation results of the temperature distribution on a clear day. The figure shows the temperature distribution of every 2 h (14:00, 16:00, 18:00, 20:00, 22:00). The sol-air temperature varied from 19.5 to 62.4°C. The sol-air temperature was higher than the indoor air temperature all day. If the heat capacity is assumed to be zero, the heat flux direction is from the outdoor to the indoor. The outdoor surface temperature of each wall reached the maximum value at 15:10. Along with a decrease in the short-wave radiation of the sun, the outdoor air temperature of the wall sharply declined from evening to night. For example, the outdoor surface temperature of the wood wall decreased by 25 K in 2 h from 16:00 to 18:00 in the evening.
where the temperature gradient becomes negative contributes to the re-emit of the heat quantity to the outdoor side. Furthermore, if the temperature of the temperature gradient zero position is high, the re-emit heat flux is large. The temperature gradient zero position of the wood wall and mud wall at 16:00 was higher than that of the wood mat wall and glass wool wall, and the temperature gradient was large. Therefore, the wood and mud wall generated large heat flux toward the outdoor surface. The temperature of the temperature gradient zero position of the wood mat wall and that of the glass wool wall at 18:00 were compared. The temperature of the temperature gradient zero position of the wood mat wall at 35 mm from the outdoor surface was 35°C, and that of glass wool wall at 5 mm from the outdoor surface was 25 °C. Wood mat wall had a temperature gradient zero position indoor the wall body from the glass wool wall, and the range of re-heat flux was wide. The internal temperature distribution of the glass wool wall was linear, and the
temperature distribution was close to the steady state.
Figure 2 shows the calculation results of the surface heat flux. The side surface heat flux of each wall increased from sunrise to noon due to the influence of the sun. The magnitude of the heat flux varied with the materials of the wall. The highest in the heat flux of the outdoor air-side surface was the mud wall, followed by the wood wall, wood mat wall, and glass wool wall. The heat flux input to the outdoor surface decreased as the thermal conductivity decreased. The heat flux on the outdoor surface of each wall changed from minus after 17:00. This is consistent with the time when the parabolic temperature distribution appeared in Figure 1. From the above, the surface temperature greatly fluctuates on the west side wall in summer due to the influence of solar radiation. The rate of the temperature change differs between the outdoor surface and the indoor of the wall body. Therefore, when the surface temperature decreases, it was shown that the internal temperature distribution had a parabolic shape and re-emit flux was generated.
Figure 2. Temperature distribution of each wall (thickness = 100 mm).
3.2. Relationship Between Wall Thickness and Heat Flux
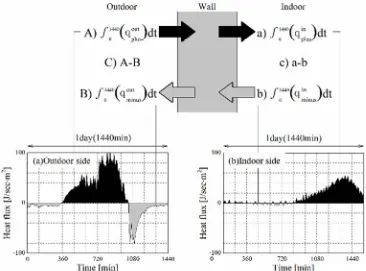
Figure 3 shows the time series changes of the heat flux and the heat transfer on the wall surface. The data was obtained from the analysis of the mud wall thickness of 100 mm. The heat flux was for the outdoor surface and the indoor side surface of the wall. The calculation of the surface heat flux was done by multiplying the difference between the considerably outdoor air temperature (or room air temperature) and the surface temperature by the surface heat transfer coefficient. To calculate the wall model, the one-dimensional heat conduction equation was solved with backward difference. The indoor and outdoor temperature of the building was measured data for Anjo-city, Aichi, Japan. The outdoor temperature was the westward sol-air temperature, while the indoor temperature was the room temperature of the experimental house set to 24°C. The unit
of heat quantity flowing through the wall for one day is kJ/(m2day). To obtain a breakdown of the flow-through heat quantity, the heat flux for 24 h was integrated on the plus side and the minus side. The breakdown of the heat quantity of the wall is as follows. The plus component on the outdoor is the outdoor inflow (A), the minus component on the outdoor is the outdoor outflowing (B), the plus component on the indoor is the indoor inflowing (a), the minus component on the indoor is the indoor outflowing (b). In addition, the heat quantity balance on the outdoor is the outdoor flow-through heat quantity (C) and the indoor side is the indoor flow-through heat quantity (c). In this study, to consider unsteady heat transfer, the re-emit rate is defined by formula 1 and the reduction rate is defined by formula 2.
Re-emit rate = B/A (1)
Figure 3. Relationship between time change of surface heat flux and heat quantity.
Figure 4 shows the heat quantity of the wall surface. Comparing the outdoor outflow heat quantity for each material, the largest was mud, followed by wood wall, wood mat wall, and glass wool wall. This order was the same as the order of the magnitude of heat capacity. It was shown that the heat capacity is proportional to the magnitude of the re-emit quantity. The outdoor flow-through heat quantity (C) and the indoor side indoor flow-through heat quantity (c) were
compared. Since the indoor side indoor flow-through heat quantity (c) was smaller than the outdoor flow-through heat quantity (C), the flow-through heat quantity of the room was reduced. From the above results, it was confirmed that the re-emitting that releases a part of the input heat quantity to the outdoor at night occurs on the wall in summer. Furthermore, the thermal physical properties of the wall influenced the magnitude of re-emit.
3.3. Effect of Wall Thickness
Figure 5 shows the temperature distribution for each thickness at the wood wall. When the wall is thick, the wall indoor of the time change is low. Especially at a wall thickness of 1000 mm, the temperature distribution was almost constant when it was deeper than 300 mm from the outdoor surface. The point where the temperature gradient becomes zero is important because the heat flux direction is bidirectional. The point of zero temperature gradient at wall thickness of 100 mm at 18:00 was a depth of 30 mm from the
outdoor surface and the temperature was 35°C. At a wall thickness of 500 mm, the point with zero temperature gradient was 40°C at 50 mm, and at wall thickness of 1000 mm it was 42°C at 50 mm. When the wood wall was thickened, the point of zero temperature gradient was high temperature, and it was in a deep point from the outdoor surface. The range from the point of zero temperature gradient to the outdoor is the heat flux direction from the wall to the outdoor. Therefore, the range contributes to the re-emit quantity input to the wall.
Figure 5. Comparison of temperature distribution by wall thickness (Wood wall).
Figure 6 shows the heat quantity on the wall surface at a thickness of 1000 mm. A comparison of the heat quantity of the respective surfaces shows that the outdoor inflow (A) and the outdoor outflowing (B) on the outdoor were larger than the indoor inflowing (a) and the indoor outflowing (b) on the
indoor surface. Particularly, the mud walls and wood wall, insulation wall (Wood mat) with large volumetric specific heat are remarkable. In the walls with a large heat capacity, heat input and re-emit occurred near the outdoor surface of the wall, which reduced the heat flux through the indoor space.
3.4. Relationship Between wall Thickness and Re-emit Rate, Reduction Rate
Figure 7 shows the re-emit rate, while Figure 8 shows the reduction rate. The heat conduction analysis determined the heat quantity of the outdoor and indoor surfaces. The analysis factors were the material type and wall thickness. The wall type had 2 conditions, while the wall thickness had 23 conditions of 10 to 1000, totaling 46 conditions. When the re-emit rate increases, the re-emit quantity is subtracted from the heat quantity input to the outdoor surface, which contributes to the reduction of the heat quantity flowing through the wall. As the reduction rate decreases, the flow-through heat quantity decreases. The re-emit rate rapidly increased from a wall thickness of 100 to 200 mm or more. When the re-emit rate reached 50%, the thickness of the wood wall was 137 mm, and that of the mud wall was 223 mm. When the reduction rate reached 50%, the thickness of the wood wall was 147 mm, and that of the mud wall was 243 mm. To examine the upper limit of the re-emit rate and the reduction rate, the analysis was carried out with a wall thickness of 1000 mm. The re-emit rate was 89% for the wood wall and 83% for the mud wall. The reduction rate was 19% for both walls. From the above, it is considered that the upper limit is approximately 80% of the input heat quantity for the effect of reducing the heat quantity flowing through the wall by the heat capacity.
Figure 7. Relationship between wall thickness and re-emit rate of materials.
Figure 8. Relationship between wall thickness and reduction rate of materials.
3.5. The Thermal Resistance Equivalent to the Thermal Resistance of the Glass Wool
Figure 9 shows the magnitude of the heat quantity flowing through the wall for each material. As the wall thickness increased, the heat quantity flowing through the wall decreased exponentially. The relationship between the wall thickness and the heat quantity flowing through the wall showed an exponential decline in all material types. Figure 10 shows the relationship of the wall thickness where the heat quantity flowing through the wall is equal. To investigate the influence of heat flux reduction on the heat capacity, the glass wool with other materials were compared. The wall thickness of each material was estimated such that it is equal to the through flow heat quantity of the glass wool. The horizontal axis is the thickness of each material (Mud, Wood, Wood mat), and the vertical axis is the thickness of glass wool. Regarding the relationship between the Glass Wool and the wall thickness of each wall body, the linear regression equations described below were obtained.
tGW = 0.94×tmud (3)
tGW = 0.45×tWood (4)
tGW = 0.67×twoodmat (5)
t: thickness [mm]
The wall thickness at which the flow-through heat quantity became equal is a linear relation between each material and the small heat capacity (Glass Wool). The soil wall thickness corresponding to the flow-through heat quantity of Glass Wool (t = 100 mm) was 956 mm, that of the wood wall was 248 mm, and that of the Wood mat was 148 mm.
Figure 10. Relationship of the wall thickness where the heat quantity flowing through the wall is equal.
Figure 11 shows the relationship of the wall thermal resistance where the flow-through heat quantity is equal. The thicknesses given in equations of 1 to 3 was divided by the thermal conductivity of each material, and the following formula was obtained.
RGW = 1.7×Rmud
RGW = 1.9×RWood
RGW = 1.1×Rwoodmat
The thermal resistance at which the heat quantity flowing through the wall is the same was compared for the glass wool and other materials. The thermal resistance of mud was 59% of the glass wool thermal resistance, the thermal resistance of wood was 53% of the glass wool thermal resistance, and the flow-through heat quantity was equal. The thermal resistance of the wood fiber mat was 91% of the thermal resistance of the glass wool, and the flow-through heat quantity was equal. It is suggested that in the westward wall in summer, the material with a large heat capacity may reduce the flow-through heat quantity compared with the material with a small heat capacity.
Figure 11. Relationship of the wall thermal resistance where the flow-through heat quantity is equal.
4. Conclusion
A one-dimensional transient thermal conduction analysis on the wall model of a building affected by solar radiation were conducted. The purpose of the analysis is to examine the effect of heat capacity on heat transfer. Heat flux and heat quantity were obtained from temperature distribution data by analysis. The indoor and outdoor temperature of the building is measured data of Anjo-city, Aichi, Japan. The outdoor temperature is the westward sol-air temperature, while the indoor temperature is the room temperature of the experimental house set at 24°C. The following results were obtained from the calculation.
The wall model was analyzed and the temperature distribution indoor the wall was calculated. As the short-wave solar radiation in the evening declined, the outdoor air surface temperature decreased. However, it takes time for the indoor of the wall to decrease in temperature compared with the outdoor air surface. Therefore, the temperature distribution indoor the wall was parabolic. Even in conditions where the SAT is higher than the room temperature, emit flow occurred from the wall toward the outdoor air. The heat radiation on the outdoor air side wall surface continued from evening till the morning of the next day. From the evening to the next morning, heat re-emit occurred on the surface of the outdoor wall. With the calculated wall thickness of 100 mm, the 24-h heat re-emit quantity of the materials was compared. As a result, it was determined to be in the order mud> wood> wood fiber mat> glass wool, which indicates the magnitude relationship of the volume heat capacity. In addition, since the glass wool has a low heat capacity, heat re-emit on the surface of the outdoor wall hardly occurred. The temperature distribution of the glass wool was the temperature distribution almost in proportion to the thermal resistance.
The value obtained by dividing the heat re-emit on the surface of the outdoor wall by the heat quantity entering the wall from the outdoor is defined as the heat re-emit rate. In the thermal steady state assumption, the heat re-emit rate is 0%. With the wood wall thickness of 50 mm, the heat re-emit rate was approximately 10%. The re-emit rate increased as the wall thickened, 35% for a thickness of 100 mm, and 65% for a thickness of 200 mm. The wall thickness was strongly influenced by the heat re-emit rate. The definition of the reduction rate is the value obtained by dividing the energy quantity entering the room from the wall by the energy quantity entering the wall from the outdoor. The period for integrating the heat quantity is one day from 00:00 to 24:00. Under the assumption of thermal steady state, the heat passage rate is 100%. In terms of the amount of heat flux through the room, the thermal resistance equivalent to the thermal resistance of the glass wool was calculated. Compared with glass wool, the value for wood was 53%, for soil the value was 59%, for wood fiber mat the value was 90%.
reflectance were affected. It is necessary to confirm the surface heat flux and the internal temperature distribution of the wall by outdoor experiment.
References
[1] Ministry of Land, Infrastructure, Transport and Tourism. 2009. Act on the Rational Use of Energy. http://www.japaneselawtranslation.go.jp/law/detail/?id=1855 &vm=04&re=02. Accessed 13 October 2017
[2] Building Research Institute. 2013. http://www.kenken.go.jp/becc/documents/house/Manual_Heat Loss_20130712.pdf. Accessed 13 October 2017
[3] Collet, F., L. Serres, J. Miriel, and M. Bart. 2006. Study of thermal behaviour of clay wall facing south. Build Environ 41:307–315
[4] Goodhew, S., and R. Griffiths. 2004. Analysis of thermal-probe measurements using an iterative method to give sample conductivity and diffusivity data. Appl Energ 77:205–223 [5] Parra-Saldivar, M., and W. Batty. 2006. Thermal behaviour of
adobe constructions. Build Environ 41:1892–1904
[6] Miyano, N., and A. Miyano. 2007. Study on thermal conductivity of Japanese mud walls. Jpn Soc Thermophy Properties 21(4):193-199
[7] Yokobayashi, S., M. Sato. 2008. A study on heat and moisture properties of material used by traditional skill -Evaluation of plasterer material (Nakanuritsuchi) made of suvstances in Hyogo-. J. Environ. Eng., AIJ 630:965-969
[8] Ministry of Agriculture, Forestry and Fisheries. 2013. Japanese Agricultural Standard for Cross Laminated Timber. http://www.maff.go.jp/j/jas/jas_kikaku/pdf/kikaku_clt.pdf. Accessed 13 October 2017
[9] Shida, S., M. Okuma. 1980. Dependency of thermal conductivity of wood based materials on temperature and moisture content. J Jpn Wood Research Soc 26(2):112-117 [10] Shida, S. 1988. Thermal performance of wood-frame walls II.
Field measurement of overall heat-transfer coefficient and thermal conductance of the wall. J Jpn Wood Research Soc 34(7):574-580
[11] Fukuta, S., M. Nishizawa, Y. Ohta, Y. Takasu, T. Mori, M. Yamasaki, and Y. Sasaki. 2010. Development of Low-Density Wooden Molding Mat Using Bicomponent Fibers. Forest Prod. J. 60(7/8):575-581
[12] Nakaya, T, M. Yamasaki, and Y. Sasaki. 2016. Thermal conductivity and volumetric specific heat of low-density wooden mats, Forest Prod. J. 66(5/6):300-307
[13] Uno, Y., T. Horikoshi, and S. Miyamoto. 2000. Indoor climate control of traditional houses and its related outdoor microclimate in mountain region of central japan. J. Archit. Plann. Environ. Eng., AIJ 532:93-100
[14] Urano, Y., T. Watanabe, T. Hayashi, A. Uchiyama. 1987. Study on thermal environment of traditional vernacular houses in northern Kyushu. T AIJ. J Architecture, Plan Environ Eng 371:27-37
[15] Hasegawa, K., H. Yoshino, N. Saiki. 1996. Investigation of thermal environment in five folk dwellings in Miyagi prefecture. AIJ J. Technol. Des. AIJ 3:189-192
[16] Mizunuma, M., T. Sawachi, H. Suzuki, H. Seto, H. Saito, Y. Nakamura, M. Nakano. 2008. Proposal for insulator infilled composite mud wall houses in mild climate region and verification regarding thermal and moisture property. J. Environ. Eng., AIJ 624:175-182