R E S E A R C H A R T I C L E
Open Access
Capability and dependency in the Newcastle 85+
cohort study. Projections of future care needs
Carol Jagger
1†, Joanna C Collerton
1†, Karen Davies
1, Andrew Kingston
1, Louise A Robinson
1,2, Martin P Eccles
1,2,
Thomas von Zglinicki
1, Carmen Martin-Ruiz
1, Oliver FW James
1, Tom BL Kirkwood
1and John Bond
1,2*†Abstract
Background:Little is known of the capabilities of the oldest old, the fastest growing age group in the population. We aimed to estimate capability and dependency in a cohort of 85 year olds and to project future demand for care.
Methods:Structured interviews at age 85 with 841 people born in 1921 and living in Newcastle and North Tyneside, UK who were permanently registered with participating general practices. Measures of capability included were self-reported activities of daily living (ADL), timed up and go test (TUG), standardised mini-mental state examination (SMMSE), and assessment of urinary continence in order to classify interval-need dependency. To project future demand for care the proportion needing 24-hour care was applied to the 2008 England and Wales population projections of those aged 80 years and over by gender.
Results:Of participants, 62% (522/841) were women, 77% (651/841) lived in standard housing, 13% (106/841) in sheltered housing and 10% (84/841) in a care home. Overall, 20% (165/841) reported no difficulty with any of the ADLs. Men were more capable in performing ADLs and more independent than women. TUG validated self-reported ADLs. When classified by‘interval of need’41% (332/810) were independent, 39% (317/810) required help less often than daily, 12% (94/810) required help at regular times of the day and 8% (67/810) required 24-hour care. Of care-home residents, 94% (77/82) required daily help or 24-hour care. Future need for 24-hour care for people aged 80 years or over in England and Wales is projected to increase by 82% from 2010 to 2030 with a demand for 630,000 care-home places by 2030.
Conclusions:This analysis highlights the diversity of capability and levels of dependency in this cohort. A remarkably high proportion remain independent, particularly men. However a significant proportion of this population require 24-hour care at home or in care homes. Projections for the next 20 years suggest substantial increases in the number requiring 24-hour care due to population ageing and a proportionate increase in demand for care-home places unless innovative health and social care interventions are found.
Background
People aged 85 years or over (the so-called oldest-old) constitute the fastest growing age-group within the population [1]. A concern is that increasing life exten-sion will be accompanied by higher levels of disease which translate into disability, dependency and increas-ing demands for health and social care services. Severity of disability as measured by restrictions in self-reported
Activities of Daily Living (ADLs), likelihood of cognitive impairment, and of being dependent on formal and informal support all increase with age [2]. Nowadays the highest proportion of dependent older people are aged 80 or over [2]. However, increasing longevity does not necessarily result in very high levels of disability and dependency because of the high levels of mortality among the most disabled or dependent at any given time [3].
In Europe and North America a handful of studies have begun to document the changing disability and dependency profiles of the oldest old [4-11]. Such pro-files have been used in planning health and social care * Correspondence: [email protected]
†Contributed equally
1
Institute for Ageing and Health, Newcastle University, Campus for Ageing and Vitality, Newcastle upon Tyne NE4 5PL UK
Full list of author information is available at the end of the article
provision and the projection of future needs for services [12-14].
In the UK and many other European countries there is universal free health care for dependent older people [15]. Long-term care has long been provided at home by families and informal carers while the proportion of people aged 65 or over resident in long-term care insti-tutions has remained at around 5% for the last 50 years despite demographic changes [15]. Recent years have shown a diversification of different types of assisted liv-ing facilities such as sheltered housliv-ing in the UK where older people live in specially adapted housing but are supported by home-based services and receive regular visits from a warden [15]. For ageing populations world wide a key challenge will be the projected decline in the traditional sources of formal and informal carers to sup-port people living at home and in long-term residential or nursing home care [16].
This paper complements existing investigations of the oldest old and uses baseline data from the Newcastle 85 + study [17] to describe the capability and dependency of 85 year olds living in north east England and to pre-dict the future need for formal and informal support in England and Wales.
Methods
The target population for the Newcastle 85+ Study was all surviving adults born in 1921, who turned 85 in 2006 when the study commenced, and permanently registered with a participating general practice in Newcastle or North Tyneside NHS Primary Care Trusts in north east England. Full details of the design of the study and recruitment of participants have been reported [17-19]. The study was approved by the Newcastle and North Tyneside 1 research ethics committee (Ref: 06/Q0905/2). Participation entailed a detailed multidimensional health assessment and review of general practice medi-cal records; participants could decline elements of the protocol. Trained research nurses interviewed partici-pants in their usual residence (own home or institution). Written informed consent was obtained from partici-pants. Where people lacked capacity to consent an opi-nion was sought from a relative or carer (a “consultee”) according to the requirements of the UK Mental Capa-city Act. A consultee opinion was also obtained if a par-ticipant was initially judged to have capacity to consent but subsequently scored below 17 on the Standardised Mini-Mental State Examination (SMMSE) [20]. Proxy informants were used in interviews where cognitive impairment was judged to limit the ability of partici-pants to provide reliable answers. Information collected included: basic socio-demography (gender, type of hous-ing and household composition); cognitive status assessed by the SMMSE; continence status graded on a
combination of frequency and severity of urinary symp-toms [21]; and self-reported ability to perform 17 Activ-ities of Daily Living (ADLs) (Table 1). Participants, who received help with ADLs were also asked who provided the help and how often help was received. Participants also performed a timed up and go (TUG) test [22]; the time taken to rise from a standard chair, walk 3 metres, turn, walk back and sit down was recorded. Information on diseases was collected from a review of GP records; data was extracted by research nurses. Further details of the interview schedules used in the study are available at: http://www.ncl.ac.uk/iah/research/programmes/ 85plus.htm
Capability of participants was based on ability to undertake ADLs. Dependency was estimated using Isaacs’and Neville’s concept of‘interval of need’, which classifies people on the basis of their cognitive status, continence status and the lapsed time between periods when participants require help with ADLs [23]. Four
Table 1 Self-reported activities of daily living§
Basic activities of daily living:
feeding self - including cutting up of food washing face and hands
washing all over* getting in and out of bed getting on and off the toilet* getting in and out of a chair dressing and undressing* cutting own toenails
Instrumental activities of daily living:
light housework heavy housework*
preparing and cooking a hot meal* shopping for groceries*
taking medication* managing money*
Mobility items:
getting around the house going up and down stairs/steps walking at least 400 yards
Response categories:
can do on own without difficulty can do on own but with difficulty
can do on own but only with aid or appliance unable to do without personal help
§
15 of the 17 activities assessed were taken from the 18 activities in the Groningen Activity Restriction Scale (GARS) [36]. The 2 additional items (medicines and money) came from the Leiden 85+ study [4] (which used the GARS and added these items). The phrasing of activities and response options were altered from GARS and made similar to the MRC Health Services Research Collaboration questionnaire [37].
categories were used: independent (participants for whom supervision or help for any activity was not essential); long-interval dependency (required help less often than daily); short-interval dependency (required help at regular intervals each day) and critical-interval dependency (required 24-hour care since help required potentially at any time or participant required constant supervision). Participants were allocated to categories in the following way: critical interval - having a SMMSE score of less than 10, or having severe or profound urin-ary incontinence with inability to dress or undress with-out help, or unable to perform, withwith-out help, any of: getting on and off the toilet, or getting in and out of a chair, or feeding oneself; short interval - unable to per-form, without help, any of: getting in and out of bed, dressing and undressing, preparing and cooking a hot meal, taking medication or washing face and hands; long interval - unable to perform, without help, any of: washing all over, shopping for groceries, light house-work, heavy househouse-work, managing money or cutting own toenails. The remainder were defined as indepen-dent. Participants were classified as missing for this vari-able only if they could not be unequivocally categorised.
Health and social care service use was ascertained by self-report and from information extracted from general practice records by the research nurses (Table 2).
Statistical methods
As the TUG test is a more objective measure of physical function we validated participants’self-report of ability in mobility items (getting around the house, getting in and out of a chair, shopping, going up and down stairs, walking at least 400 yards) by comparing the median time to completion and proportion unable to complete the TUG test by response category for each mobility item and separately by gender. Individual responses to ADL items were compared between genders by Mann-Whitney (M-W) tests. Socio-demographic inequalities in interval-need dependency were examined using Krus-kall-Wallis (K-W) tests (P values were two sided) and polytomous regression models with adjustment for gen-der and number of chronic diseases (disease count [17]), the latter being a proxy for disease burden. Polytomous regression models with adjustment for gender were also used to explore the association between interval-need dependency and health and social care service use with significance assessed by the Wald Chi-squared (Wald
c2
). In general we excluded missing values from the ana-lysis and calculated percentages from the number of valid responses. Where individual items were missing within the SMMSE we compared scoring the missing item as zero or the maximum possible for that item with data retained only if a participant was classified in
the same category (<10, 10+) in either case. We used version 1.2 of the data set.
To assess the potential future dependency needs of an ageing population we assumed that 85 year olds, and their dependency levels, were an estimate for the national (England and Wales) population aged 80 years and over. This assumption was reasonable for two reasons. Firstly 85 is the average age of the 80 years and over age group as the median age of this age group from the population projections varied from 84.9 years (men: 84.3 years, women: 85.2 years) in 2010 to 85.4 years (men: 85.1 years, women: 85.6 years) in 2030 [24]. Secondly the pre-valence of dependency in very old cohorts appears to be relatively constant as they age further due to the increased mortality in the most dependent[25]. Therefore we applied the proportions in the interval-need-depen-dency groups by gender for our population of 85 year olds to the 2008-based population projections through to 2030 for men and women separately [24].
Table 2 Health and social care services
Self-report:
In previous four weeks, any contact with:
•community nurse (including district nurse, practice nurse, private nurse, MacMillan nurse, Marie Curie nurse and other specialist community nurses)
•chiropodist (NHS or private) •physiotherapist
•occupational therapist •speech therapist •dietician
•home-care service (social services, voluntary agency or private) •meals service
•day sitter •night attendant •social worker
In previous three months:
•any outpatient attendance (with number of attendances) •any‘accident and emergency’attendance (with number of attendances)
•any use of emergency ambulance
In previous 12 months:
•any overnight hospital admission (with total length of stay) •any respite care (care home or hospital, with total length of stay) •any‘day hospital’attendance
•any use of other intermediate care services
General practice records
In previous 12 months:
•any consultation with own general practitioner, including‘out of hours’contacts with own general practitioner (with number of consultations)
Results
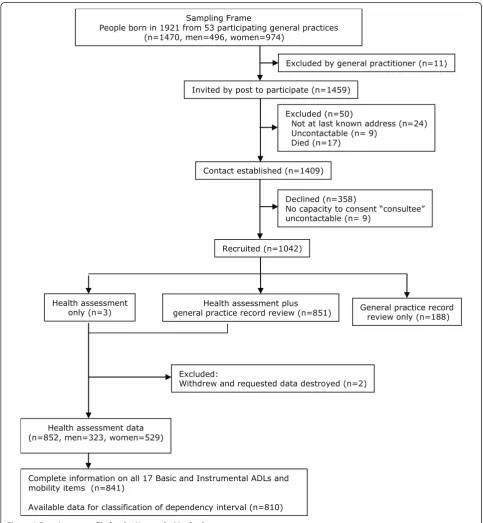
In total 1042 participants were recruited to the Newcas-tle 85+ study (71.7% of those eligible and alive); health assessment data were available on 852 participants of whom 841 (98.7%, 319 men, 522 women) had complete information on all 17 ADLs and formed the study popu-lation for analysis (Figure 1). As reported elsewhere,
participants were broadly representative of people of this age in England and Wales in terms of gender, being resident in care homes and living alone [17].
Sociodemographics
Of the 841 participants for whom complete information on ADLs were available, 77% (651/841) lived in standard
Health assessment only (n=3)
Recruited (n=1042)
Excluded (n=50)
Not at last known address (n=24) Uncontactable (n= 9)
Died (n=17)
Declined (n=358)
No capacity to consent “consultee” uncontactable (n= 9)
Contact established (n=1409) Sampling Frame
People born in 1921 from 53 participating general practices (n=1470, men=496, women=974)
Health assessment plus
general practice record review (n=851) General practice recordreview only (n=188)
Excluded:
Withdrew and requested data destroyed (n=2)
Excluded by general practitioner (n=11)
Invited by post to participate (n=1459)
Health assessment data (n=852, men=323, women=529)
Complete information on all 17 Basic and Instrumental ADLs and mobility items (n=841)
Available data for classification of dependency interval (n=810)
housing, 13% (106/841) in sheltered accommodation and 10% (84/841) in a care home (data not shown).
Self-reported capability to perform activities of daily living
Participants alone provided self-report of capability in daily activities in 84% (706/841) of cases with proxy informants also contributing in a further 12% (105/841) and for 4% (30/841) proxy informants alone provided information. Over 90% of men and women could feed themselves (792/841) and wash their face and hands (789/841) without difficulty whilst cutting toenails was the activity with which most men and women had diffi-culty; only 31% (160/522) of women and 41% (131/319) of men could do this without difficulty (Table 3). Women were significantly more likely than men to be limited in 13 of the 17 ADLs (feeding self, getting in and out of bed, getting on and off the toilet, taking medication, getting around in the house, preparing and cooking hot meal, managing money, washing all over, doing heavy housework, shopping for groceries, going up and down stairs, walking at least 400 yards, and cut-ting own toenails). Self-report of ability to perform the
activities concerned predominantly with lower limb mobility was strongly related to the ability to complete and the time taken to complete the timed up and go test (Table 4) thus validating the self-reports.
Cognitive status
Using an SMMSE cut-point of≤21, 13% (105/836) were
moderately or severely cognitively impaired; 3% (25/836) scored < 10.
Interval-need dependency
Of the 841 participants with complete data on ADLs, 31 (9 men, 22 women) had missing data on continence or SMMSE and therefore could not be classified for inter-val-need dependency. When classified by interinter-val-need dependency, 41% (332/810) were independent; 39% (317/810) were long-interval dependent requiring help less than daily; 12% (94/810) were short-interval depen-dent requiring help at regular intervals every day and only 8% (67/810) of the cohort were critical-interval dependent requiring 24-hour care (Table 5). Of those in care homes, 61% (50/82) required 24-hour care (critical-interval) and a further 33% (27/82) required help at
Table 3 Capability and restriction in activities of daily living, by sex
No difficulty doing alone
Some difficulty doing alone
Can only do with an aid Unable to do alone, need help
Men % (N = 319)
Women % (N = 522)
Men % (N =
319)
Women % (N = 522)
Men % (N =
319)
Women % (N = 522)
Men % (N =
319)
Women % (N = 522)
P value*
Feeding self including cutting up food
96.9 92.5 1.9 3.1 0.3 0.2 0.9 4.2 0.009
Washing face and hands 95.6 92.7 1.9 2.9 0.0 0.0 2.5 4.4 0.09
Getting in and out of bed 88.1 81.8 6.0 8.4 1.9 3.6 4.1 6.1 0.015
Getting on and off toilet 85.6 79.3 4.4 5.9 5.6 8.8 4.4 5.9 0.023
Taking medication 85.6 79.9 2.8 4.4 0.3 1.3 11.3 14.4 0.044
Dressing and undressing 84.3 81.0 8.2 8.6 0.0 0.4 7.5 10.0 0.21
Light housework 83.1 78.2 4.4 5.7 0.3 1.3 12.2 14.8 0.1
Getting around the house 82.4 74.3 6.3 5.7 7.8 14.4 3.4 5.6 0.004
Preparing and cooking a hot meal
81.8 74.7 5.0 5.7 0.3 0.4 12.9 19.2 0.014
Managing money 80.3 72.8 6.0 6.3 0.0 0.2 13.8 20.7 0.011
Getting in and out of a chair
79.6 77.8 15.4 14.6 0.9 2.5 4.1 5.2 0.45
Washing all over 74.6 61.1 8.8 9.6 5.0 10.5 11.6 18.8 <0.0001
Heavy housework 69.9 43.3 10.7 14.6 0.3 0.2 19.1 42.0 <0.0001
Shopping for groceries 61.8 36.8 9.1 11.9 2.8 1.0 26.3 50.4 <0.0001
Going up and down stairs/ steps
61.1 45.6 21.0 25.5 6.0 8.2 11.9 20.7 <0.0001
Walking at least 400 yards 60.5 46.9 13.2 11.3 15.0 18.0 11.3 23.8 <0.0001
Cutting own toenails 41.1 30.7 23.8 15.5 0.3 0.0 34.8 53.8 <0.0001
Values are percentages.
Table 4 Median time in seconds to complete timed up and go (TUG) test and proportion unable to complete, by mobility item response and gender
No difficulty doing alone
Some difficulty doing alone
Can only do with an aid Unable to do alone need help
Median time (secs)
% miss-ing*
Median time (secs)
% miss-ing*
Median time (secs)
% miss-ing*
Median time (secs)
% miss-ing*
P value**
Men
Getting around the house
12.2 4.2 26.4 10.0 30.1 16.0 57.4 90.9 <0.0001
Getting in and out of a chair
12.3 3.2 18.1 12.2 25.0 0.0 . 100.0 <0.0001
Shopping for groceries 11.2 2.0 14.6 6.9 24.0 11.1 20.8 23.8 <0.0001
Going up and down stairs/steps
11.3 3.1 14.5 4.5 30.7 5.3 25.6 44.7 <0.0001
Walking at least 400 yards
11.2 2.6 13.6 4.8 20.3 8.3 21.3 44.4 <0.0001
Women
Getting around the house
13.9 5.4 28.0 16.7 37.3 25.3 35.0 93.1 <0.0001
Getting in and out of a chair
14.2 6.2 24.8 19.7 50.0 46.2 39.8 96.3 <0.0001
Shopping for groceries 12.3 2.1 14.1 8.1 16.2 0.0 22.0 24.0 <0.0001
Going up and down stairs/steps
12.6 4.6 16.2 6.0 27.2 7.0 37.8 46.3 <0.0001
Walking at least 400 yards
12.4 5.3 16.5 1.7 17.4 9.6 31.0 39.5 <0.0001
*%missing through inability to complete TUG.
**Kruskal-Wallis test for difference in TUG between ADL response categories.
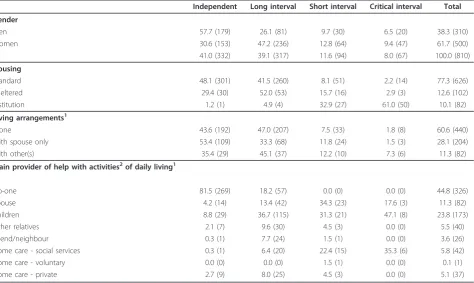
Table 5 Interval-need dependency, by socio-demographics and main provider of help with daily activities
Independent Long interval Short interval Critical interval Total
Gender
Men 57.7 (179) 26.1 (81) 9.7 (30) 6.5 (20) 38.3 (310)
Women 30.6 (153) 47.2 (236) 12.8 (64) 9.4 (47) 61.7 (500)
All 41.0 (332) 39.1 (317) 11.6 (94) 8.0 (67) 100.0 (810)
Housing
Standard 48.1 (301) 41.5 (260) 8.1 (51) 2.2 (14) 77.3 (626)
Sheltered 29.4 (30) 52.0 (53) 15.7 (16) 2.9 (3) 12.6 (102)
Institution 1.2 (1) 4.9 (4) 32.9 (27) 61.0 (50) 10.1 (82)
Living arrangements1
Alone 43.6 (192) 47.0 (207) 7.5 (33) 1.8 (8) 60.6 (440)
With spouse only 53.4 (109) 33.3 (68) 11.8 (24) 1.5 (3) 28.1 (204)
With other(s) 35.4 (29) 45.1 (37) 12.2 (10) 7.3 (6) 11.3 (82)
Main provider of help with activities2of daily living1
No-one 81.5 (269) 18.2 (57) 0.0 (0) 0.0 (0) 44.8 (326)
Spouse 4.2 (14) 13.4 (42) 34.3 (23) 17.6 (3) 11.3 (82)
Children 8.8 (29) 36.7 (115) 31.3 (21) 47.1 (8) 23.8 (173)
Other relatives 2.1 (7) 9.6 (30) 4.5 (3) 0.0 (0) 5.5 (40)
Friend/neighbour 0.3 (1) 7.7 (24) 1.5 (1) 0.0 (0) 3.6 (26)
Home care - social services 0.3 (1) 6.4 (20) 22.4 (15) 35.3 (6) 5.8 (42)
Home care - voluntary 0.0 (0) 0.0 (0) 1.5 (1) 0.0 (0) 0.1 (1)
Home care - private 2.7 (9) 8.0 (25) 4.5 (3) 0.0 (0) 5.1 (37)
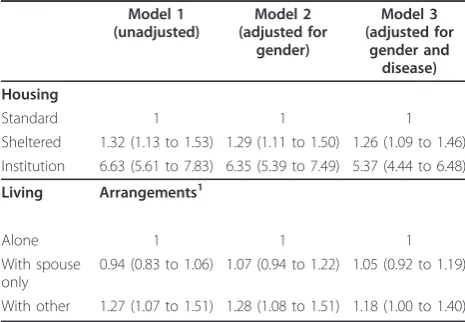
regular intervals throughout the day (short-interval) (Table 5). Women required care at significantly shorter intervals than men (M-W, P < 0.0001). Of those classi-fied as critical-interval dependent, 75% (50/67) lived in a care home and for the remainder the main provider of help was a child (47%, 8/17), social services (35%, 6/17) or a spouse (18%, 3/17). For those living at home with short-interval dependency the main provider of help was a spouse (34%, 23/67), a child (31%, 21/67) or social ser-vices (22%, 15/67) whilst the majority of help for those living at home with long-interval dependency was pro-vided by a child (37%, 115/313) (Table 5). Non-institu-tionalised participants who lived with others (but not solely a spouse) required care more frequently (K-W,c2 = 8.482; P = 0.014) and differences remained after adjustment for gender and number of chronic diseases (Table 6).
The self-reported frequency of help received validated the interval-need dependency classifications. The major-ity of participants classified as critical-interval dependent received help several times a day with dressing or undressing (79%, 53/67), taking medication (79%, 53/67) and toileting (70%, 47/67). Those classified as long-interval dependent that required help less than daily did so mostly because they needed help with heavy house-work (7.6%, 24/317).
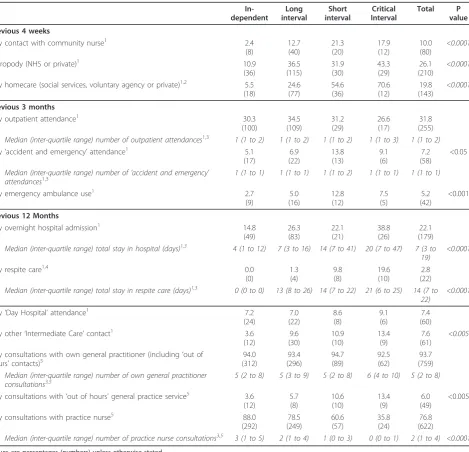
Health and social care service use
Participants with higher levels of interval-need depen-dency were more likely to have used health services (Table 7).
Health service use
For participants living at home and in care homes, higher levels of interval-need dependency were signifi-cantly associated with: hospital admission, use of respite
care, use of intermediate care other than day hospital and use of an out of hours doctor service in the pre-vious year; use of an emergency ambulance and atten-dance at ‘accident and emergency’, in the previous 3 months; community nurse contact or use of NHS or private chiropody services, in the previous 4 weeks. Par-ticipants with higher levels of interval-need dependency were significantly less likely to have consulted a practice nurse in the previous year. When adjusted for the effect of gender, only hospital admission (Odds Ratio [OR] 1.29, 95% Confidence Interval [95%CI] [1.16 to 1.44]), the use of respite care (OR 1.22, 95% CI [1.16 to 1.28]) in previous year, and use of chiropody (OR 1.36, 95% CI [1.22 to 1.52]) in previous 4 weeks suggested a strong association with critical-interval dependency. Only use of respite care (OR 1.20, 95% CI [1.15 to 1.26]) in pre-vious year showed a strong association with short-inter-val dependency. Furthermore, those in the critically dependent group who received respite care in the 12 months before interview (n = 10) were compared with those who had not received respite care (n = 41) in terms of participant characteristics (gender, marital sta-tus, living arrangements) and carer characteristics (rela-tionship to participant). No significant differences were found between the groups for gender, marital status or living arrangements. However more who received respite care had a child as the main carer (87% v 27%, p = 0.02) though these results should be viewed with caution due to small numbers. Less than 4% of participants had had any contact in the previous 4 weeks with a physiothera-pist (27/808), occupational theraphysiothera-pist (14/808), speech therapist (5/808), or dietician (8/808); use of these ser-vices by dependency group was not explored.
Social care service use
For participants living at home, higher levels of interval-need dependency were significantly associated with con-tact with home-care services in the previous 4 weeks, differences remaining after adjustment for gender (OR 1.92, 95% CI [1.61 to 2.29], critical-interval dependency). For participants living at home, only 7% (48/724) reported receiving any meals service in the previous 4 weeks and less than 4% reported any contact in the pre-vious 4 weeks with a night attendant (3/724) or day sit-ter (8/725). For participants living at home or in an institution, less than 4% (32/804) reported any contact with a social worker in the previous four weeks. Use of these services by dependency group was therefore not explored.
Future projections
Assuming that the proportions of 85 year olds in each interval-need dependency category remain constant and are an estimate for the 80+ population, the numbers in England and Wales with critical-interval dependency, Table 6 Regression models of interval-need dependency
by sociodemographics
Model 1 (unadjusted)
Model 2 (adjusted for
gender)
Model 3 (adjusted for
gender and disease)
Housing
Standard 1 1 1
Sheltered 1.32 (1.13 to 1.53) 1.29 (1.11 to 1.50) 1.26 (1.09 to 1.46) Institution 6.63 (5.61 to 7.83) 6.35 (5.39 to 7.49) 5.37 (4.44 to 6.48)
Living Arrangements1
Alone 1 1 1
With spouse only
0.94 (0.83 to 1.06) 1.07 (0.94 to 1.22) 1.05 (0.92 to 1.19)
With other 1.27 (1.07 to 1.51) 1.28 (1.08 to 1.51) 1.18 (1.00 to 1.40)
Odds ratios (95 percent confidence limits).
requiring help potentially at any time of the day or night, are projected to rise by 82% between 2010 to 2030, from 216,000 to 392,000 (Figure 2) and those with short-interval dependency by 83% from 303,000 to 553,000. The number of people aged 80 or over who remain independent is projected to rise by 94% from 1,057,000 to 2,047,000. Assuming that the balance between home-based care and institutional care for peo-ple with short or critical-interval dependency remains constant then the number of care-home places required
in 2030 in England and Wales is projected to be 630,000.
Discussion
Despite considerable morbidity [17], people aged 85 years born in 1921 living in Newcastle and North Tyne-side in the UK are remarkably independent. Using Isaacs’and Neville’s [23] concept of interval need we estimate that about two-fifths of this age cohort are independent, two-fifths were long-interval dependent Table 7 Use of health and social care services, by interval-need dependency group
In-dependent Long interval Short interval Critical Interval Total P value
Previous 4 weeks
Any contact with community nurse1 2.4
(8) 12.7 (40) 21.3 (20) 17.9 (12) 10.0 (80) <0.0001
Chiropody (NHS or private)1 10.9
(36) 36.5 (115) 31.9 (30) 43.3 (29) 26.1 (210) <0.0001
Any homecare (social services, voluntary agency or private)1,2 5.5 (18) 24.6 (77) 54.6 (36) 70.6 (12) 19.8 (143) <0.0001
Previous 3 months
Any outpatient attendance1 30.3
(100) 34.5 (109) 31.2 (29) 26.6 (17) 31.8 (255)
Median (inter-quartile range) number of outpatient attendances1,3 1 (1 to 2) 1 (1 to 2) 1 (1 to 2) 1 (1 to 3) 1 (1 to 2)
Any‘accident and emergency’attendance1 5.1
(17) 6.9 (22) 13.8 (13) 9.1 (6) 7.2 (58) <0.05
Median (inter-quartile range) number of‘accident and emergency’ attendances1,3
1 (1 to 1) 1 (1 to 1) 1 (1 to 2) 1 (1 to 1) 1 (1 to 1)
Any emergency ambulance use1 2.7
(9) 5.0 (16) 12.8 (12) 7.5 (5) 5.2 (42) <0.001
Previous 12 Months
Any overnight hospital admission1 14.8
(49) 26.3 (83) 22.1 (21) 38.8 (26) 22.1 (179)
Median (inter-quartile range) total stay in hospital (days)1,3 4 (1 to 12) 7 (3 to 16) 14 (7 to 41) 20 (7 to 47) 7 (3 to
19)
<0.0001
Any respite care1,4 0.0
(0) 1.3 (4) 9.8 (8) 19.6 (10) 2.8 (22)
Median (inter-quartile range) total stay in respite care (days)1,3 0 (0 to 0) 13 (8 to 26) 14 (7 to 22) 21 (6 to 25) 14 (7 to
22)
<0.0001
Any‘Day Hospital’attendance1 7.2
(24) 7.0 (22) 8.6 (8) 9.1 (6) 7.4 (60)
Any other‘Intermediate Care’contact1 3.6
(12) 9.6 (30) 10.9 (10) 13.4 (9) 7.6 (61) <0.005
Any consultations with own general practitioner (including‘out of hours’contacts)5
94.0 (312) 93.4 (296) 94.7 (89) 92.5 (62) 93.7 (759)
Median (inter-quartile range) number of own general practitioner consultations3,5
5 (2 to 8) 5 (3 to 9) 5 (2 to 8) 6 (4 to 10) 5 (2 to 8)
Any consultations with‘out of hours’general practice service5 3.6 (12) 5.7 (8) 10.6 (10) 13.4 (9) 6.0 (49) <0.005
Any consultations with practice nurse5 88.0
(292) 78.5 (249) 60.6 (57) 35.8 (24) 76.8 (622)
Median (inter-quartile range) number of practice nurse consultations3,5 3 (1 to 5) 2 (1 to 4) 1 (0 to 3) 0 (0 to 1) 2 (1 to 4) <0.0001
Values are percentages (numbers) unless otherwise stated. 1 - Data from health assessment.
2 - Community dwelling residents only.
requiring help less often than daily, around one-in-ten were short-interval dependent requiring help at regular times of the day) and under one-in-ten were critical-interval dependent requiring 24-care by formal and informal carers. Men were estimated to be more inde-pendent than women (58% compared with 31%). This reflected gender differences in the need for help with activities of daily living (see Table 3). Not surprisingly residents in care homes were more dependent even after adjusting for gender and disease compared with partici-pants living at home or in sheltered accommodation (see Table 6). Of those not resident in care homes, two-fifths of participants received no help with activities of daily living; for two-fifths the reported main helper was a family member, friend or neighbour and in only one fifth was the main helper a formal carer (see Table 5). We estimate that the number of people aged 80 years or over in England and Wales who are independent will increase by 94% from 2010 to 2030. We estimate similar increases in this period for the number of people aged 80 years or over who are long-interval (79%), short-interval (83%) and critical-short-interval (82%) dependent. Three-quarters of study participants with critical-interval dependency and almost a third of those with short-interval dependency were living in care homes. Assum-ing constant prevalence of interval-need dependency and that the balance of care homes to other ways of supporting dependent older people also remains con-stant, these estimates would imply that there will be an 89% increase in the demand for residential and nursing home places over the same period.
The so-called oldest old (generally defined as people aged 85 years or over) have been poorly represented in ageing research. Data about the very old are routinely based on relatively small sample sizes because of the relatively small numbers of people aged 85 years or over sampled from populations of people aged 60 or 65 years and over, which is compounded by attrition and
non-response [26-28]. The oldest old represent an extremely heterogeneous age group covering 20 years or more of the observed lifespan making generalisations about this age group particularly problematic. Narrow age-band cohort studies of very old people more readily reflect the true diversity within the population than those of wider age-band cohorts that are confounded by the dif-ferential effects of increasing age. The Newcastle 85+ study is one of a small number of studies that have the advantage of a relatively homogeneous and stable study population, of sufficient size and that recruited both participants living at home and in long-term care insti-tutions including people with cognitive impairment. The challenges of researching very old people in terms of the reliability and internal validity of self-reported data [29,30], however, remain. Non-response bias, however, that would normally impact on population estimates of care need, surprisingly, does not appear to reflect insti-tutionalisation and increasing disability and dependency [17]. Caveats about the external validity of estimates based on a single urban area should be highlighted. However, our study population of people born in 1921 shows remarkable similarity to the England and Wales population [17]. This includes ethnicity since projections based on the 2001 national census suggest that only 1.6% of the population aged 80 years and over in 2006 was non-White and this will increase little, to 3.6%, by 2030 [31]. A strength of the Newcastle 85+ study is the diversity of types of data collected (self-reports, proxy reports, clinical measurement) and sources of data (structured interviews, clinical records) that allow com-parisons between estimates that use different methods of data collection and sources of data. Appropriate resources and considerable effort were also used to ensure that high quality data were captured [17-19].
Our estimates of the levels of ability to undertake ADLs and interval-need dependency in this age group are consistent with the trends observed in other studies [2,4,5,7,9-11]. Nowadays, older people in at least some countries, are more independent than in previous gen-erations [25,32,33], reflecting the shifting of the burden of chronic illness and disability to later chronological ages. This suggests a rather more optimistic future for people turning 85 and challenges the idea that increas-ing longevity and life expectancy of successive genera-tions of older people should always be treated with alarm. However, evidence for declining levels of disabil-ity is mixed, a comparison of the trends in the preva-lence of severe disability in older people in twelve OECD countries concluded that only five countries (Denmark, Finland, Italy, the Netherlands, United States) showed clear evidence of a decline in disability whilst three (Belgium, Japan, Sweden) showed clear increases, two (Australia, Canada) stability and a further two 0
500 1000 1500 2000 2500 3000 3500 4000 4500 5000
2
006
2
008
2
010
2
012
2
014
2
016
2
018
2
020
2
022
2
024
2
026
2
028
2
030
Th
ous
ands critical
short
long
independent
(France and the UK) differing trends depending on the data source [34].
Despite the optimistic scenarios that shift the impact of disability and dependency to later chronological ages, the projected increase in the demand for health and social care services remains a considerable concern for politicians and policy makers and society as a whole, particularly in light of the projected decline in availabil-ity of formal and informal carers. It will also have signif-icant implications for the skills training of both qualified and unqualified personnel particularly in relation to the care of people with cognitive impairment. The planning of health and social care services is a major challenge, since forecasting future demand is an inexact science. Future demand is influenced not only by demographic change and the capability and dependency of the older population. The nature of the health and social care sys-tems, the changing structure of social support networks, technological innovations and policy, reflecting the changing attitudes to supporting older people and the use of scarce societal resources, will also influence pro-jections. For this reason we have made a number of gross assumptions in estimating the impact of future levels of capability and dependency. Our assumption of constant prevalence of interval-need dependency is con-servative for the UK, and indeed more generally [34]. We accept that our projections are relatively imprecise. However the challenge of population ageing is of a suffi-cient magnitude to justify attempting these projections.
Conclusions
The significance of this study is that it highlights the increasing capability of the oldest old but also provides policy makers with robust data and estimates of need about the increasing numbers of very old people around the age to which more than half the population nowa-days are expected to survive. Even without the impact of global economic recession on levels of public expendi-ture the current ways of delivering long-term care are probably unsustainable given the future decline in the number of working-age adults available for employment in the long-term care sector [35]. Innovative solutions to this challenge, involving families and community sup-port networks that utilise the increasing pool of active and capable retired people will be needed to maintain levels of independence among the oldest old and pro-vide appropriate long-term support for those who require 24-hour care or at least regular daily care.
List of abbreviations
ADL: Activities of Daily Living; K-W: Kruskall-Wallis; GARS: Groningen Activity Restriction Scale; M-W: Mann-Whitney; NHS: National Health Service; OR: Odds ratio; SMMSE: Standardised Mini-Mental State Examination; TUG: Timed up and go test; UK: United Kingdom
Acknowledgements
The baseline phase of the Newcastle 85+ Study was supported by a joint grant from the Medical Research Council and the Biotechnology and Biological Sciences Research Council (reference G0500997) and the Newcastle Healthcare Charity. We appreciate the support of Newcastle and North Tyneside Primary Care Trusts and local general practices. We are grateful to Professor Julian C. Hughes and Newcastle and North Tyneside 1 Research Ethics Committee for their guidance around consent. We thank the research nurses: (Brenda Balderson, Sally Barker, Julie Burrows, June Edwards, Julie Ferguson, Gill Hedley, Joan Hughes, Judith Hunt, Julie Kimber, and Victoria Raynor); data manager (Pauline Potts), and project secretary (Lucy Farfort). Thanks are especially due to the 85 year olds of Newcastle and North Tyneside for the generous donation of their time and personal information to make the study possible.
Author details 1
Institute for Ageing and Health, Newcastle University, Campus for Ageing and Vitality, Newcastle upon Tyne NE4 5PL UK.2Institute of Health and
Society, Newcastle University, Baddiley-Clarke Building, Richardson Road, Newcastle upon Tyne NE2 4AX UK.
Authors’contributions
CJ participated in the study design, analysis and interpretation, the conception and writing of the paper; JC participated in the study design and its execution, data collection, data preparation, analysis and
interpretation, and the conception and critique of the paper; KD participated in the study design and its execution, data collection, data preparation and critique of the paper; AK participated in the analysis and interpretation, and critique of the paper; LAR participated in recruitment, analysis and critique of the paper; MPE participated in the study design, analysis and critique of the paper; TvZ participated in the study design and critique of the paper; CM-R participated in the study set up and critique of the paper; OFWJ participated in the study design, analysis and critique of the paper; TBLK conceived the study, secured funding, and oversaw all aspects as lead investigator. He participated in the study design and its execution, analysis and critique of the paper; JB participated in the study design, analysis and interpretation, the conception and writing of the paper. CJ and JB are the guarantors. All authors saw and approved the final manuscript, had full access to all of the data (including statistical reports and tables) in the study, and can take responsibility for the integrity of the data, data analysis and its interpretation. All authors read and approved the final draft.
Competing interests
The authors declare that they have no competing interests.
Received: 25 October 2010 Accepted: 4 May 2011 Published: 4 May 2011
References
1. Tomassini C:The demographic characteristics of the oldest old in the United Kingdom.Pop Trends2005, ,120:15-22.
2. Medical Research Council Cognitive Function and Ageing Study (MRC CFAS) and Resource Implications Study (RIS MRC CFAS):Profile of disability in elderly people: estimates from a longitudinal population study.BMJ
1999,318:1108-1111.
3. Christensen K, McGue M, Petersen I, Jeune B, Vaupel JW:Exceptional longevity does not result in excessive levels of disability.Proc Natl Acad Sci USA2008,105(36):13274-13279.
4. Bootsma-van der Wiel A, Gussekloo J, de Craen AJM, Van Exel E, Knook DL, Lagaay AM, Westendorp RG:Disability in the oldest old:“can do”or“do do"?J Am Geriatr Soc2001,49(7):909-914.
5. Femia EE, Zarit SH, Johansson B:The disablement process in very late life: a study of the oldest-old in Sweden.Journal of Gerontology: Psychological Sciences2001,56B(1):P12-P23.
6. Nybo H, Petersen HC, Gaist D, Jeune B, Andersen K, McGue M, Vaupel JW, Christensen K:Predictors of mortality in 2,249 nonagenarians - The Danish 1905-cohort survey.J Am Geriatr Soc2003,51(10):1365-1373. 7. Von Strauss E, Aguero-Torres H, Kareholt I, Winblad B, Fratiglioni L:Women
8. Fauth EB, Zarit S, Malmberg B, Johansson B:Physical, cognitive, and psychosocial variables from the disablement process model predict patterns of independence and the transition into disability for the oldest-old.The Gerontologist2007,47(5):613-624.
9. Xie J, Matthews FE, Jagger C, Bond J, Brayne C:The oldest old in England and Wales: a descriptive analysis based on the MRC Cognitive Function and Ageing Study.Age Ageing2008,27(4):396-402.
10. Berlau DJ, Corrada M, Kawas C:The prevalence of disability in the oldest-old is high and continues to increase with age: findings from the 90+ study.Int J Geriatr Psychiatry2009,24:1217-1225.
11. Newman AB, Arnold AM, Sachs MC, Ives DG, Cushman M, Strotmeyer ES, Ding J, Kritchevsky SB, Chaves PHM, Fried LP, Robbins J:Long-term function in an older cohort - the cardiovascular health study all stars study.J Am Geriatr Soc2009,57(3):432-440.
12. Wittenberg R, Pickard L, Comas-Herrera A, Davies B, Darton R:Demand for long-term care: Projections of long-term care finance for elderly people - Draft Report. Discussion Paper 1414London: Personal Social Services Research Unit, London School of Economics; 1998.
13. Pickard L, Wittenberg R, Comas-Herrera A, Davies B, Darton R:Relying on informal care in the new century? Informal care for elderly people in England to 2031.Ageing Soc2000,20(6):745-772.
14. Comas-Herrera A, Wittenberg R, Pickard L, Knapp M:Cognitive impairment in older people: future demand for long-term care services and the associated costs.Int J Geriatr Psychiatry2007,22:1037-1045. 15. Bond J, Cabrero GR:Health and dependency in later life.InAgeing in
Society: European Perspectives on Gerontology..3 edition. Edited by: Bond J, Peace S, Dittmann-Kohli F, Westerhof G. London: Sage Publications; 2007:113-141.
16. United Nations:World Population Ageing 20092009, 1-82.
17. Collerton J, Davies K, Jagger C, Kingston A, Bond J, Eccles MP, Robinson AL, Martin-Ruiz C, Von Zglinicki T, James OFW, Kirkwood T:Health and disease in 85 year olds: baseline findings from the Newcastle 85+ cohort study.
BMJ2009,399:b4904.
18. Collerton J, Barrass K, Bond J, Eccles M, Jagger C, James O, Martin-Ruiz C, Robinson AL, Von Zglinicki T, Kirkwood T:The Newcastle 85+ Study: biological, clinical and psychosocial factors associated with health ageing: study protocol.BMC Geriatr2007,7:14.
19. Davies K, Collerton JC, Jagger C, Bond J, Barker SAH, Edwards J, Hughes J, Hunt JM, Robinson AL:Engaging the oldest old in research: lessons from the Newcastle 85+ study.BMC Geriatr2010,10(64).
20. Molloy DW, Standish TIM:Mental status and neuropsychological assessment: a guide to the standardized mini-mental state examination.
Int Psychogeriatr1997,9(1):87-94.
21. Perry S, Shaw C, Assassa RP, Dallosso H, Williams K, Brittain K, Mensah F, Smith NKG, Clarke M, Jagger C, Mayne C, Castleden CM, Jones JMG, McGrowther C, Leicestershire MRC Incontinence Study:An epidemiological study to establish the prevalence of urinary symptoms and felt need in the community: The Leicestershire MRC Incontinence Study.J Pub Health Med2000,22(3):427-434.
22. Podsiadlo D, Richardson S:The timed up and go - a test of basic functional mobility for frail elderly persons.J Am Geriatr Soc1991,
39:142-148.
23. Isaacs B, Neville Y:The needs of old people:‘interval’as a method of measurement.Br J Prev Soc Med1976,30:79-85.
24. Government Actuary’s Department:National population projects: 2006 based
Office for National Statistics; 2007.
25. Christensen K, Doblhammer G, Rau R, Vaupel JW:Ageing populations: the challenges ahead.Lancet2009,374:1196-1208.
26. Deeg DJH:Attrition in longitudinal population studies: does it affect the generalizabiltiy of the findings? An introduction to the series.J Clin Epidemiol2002,55(3):213-215.
27. Chatfield M:A systematic literature review of attrition between waves in longitudinal studies in the elderly shows a consistent pattern of dropout between differing studies.Journal of Clinical Epidemiology2005,
58:13-19.
28. Bhamra S, Tinker A, Mein G, Ashcroft R, Askham J:The retention of older people in longitudinal studies: a review of the literature.Quality in Ageing2008,9(4):27-35.
29. Carsjo K, Thorslund M, Warneryd B:The validity of survey data on utilization of health and social services among the very old.J Gerontol
1994,49(3):S156-S164.
30. Neumann PJ, Araki SS, Gutterman EM:The use of proxy respondents in studies of older adults: lessons, challenges, and opportunities.J Am Geriatr Soc2000,48(12):1646-1654.
31. Wohland P, Rees P, Norman P, Boden P, Jasinska M:Ethnic population projections for the UK and local areas, 2001-2051. Working Paper 10/02
School of Geography, University of Leeds; 2010.
32. Freedman VA, Martin LG, Schoeni RF:Recent trends in disability and functioning among older US adults.Journal of the American Medical Association2002,2888:3137-3146.
33. Manton KG, Gu X, Lamb VL:Change in chronic disability from 1982 to 2004/2005 as measured by long-term changes in function and health in the US elderly population.Proc Natl Acad Sci USA2006,
103(48):18374-18379.
34. Lafortune G, Balestat G:Trends in severe disability among elderly people: assessing evidence in 12 OECD countries and their future implications. Health Working Paper No. 26Paris: OECD; 2007.
35. Robine J-M, Michel J-P, Hermann FR:Who will care for the oldest people?
BMJ2007,334:570-571.
36. Kempen GIJM, Miedema I, Ormel J, Molenaar W:The assessment of disability with the Groningen Activity Restriction Scale, Conceptual Framework and Psychometric Properties.Soc Sci Med1996,
43(11):1601-1610.
37. Ayis S, Bowling A, Gooberman-Hill R, Ebrahim S:The effect of definitions of activities of daily living on estimates of changing ability among older people.Int J Rehabil Res2007,30(1):39-46.
Pre-publication history
The pre-publication history for this paper can be accessed here: http://www.biomedcentral.com/1471-2318/11/21/prepub
doi:10.1186/1471-2318-11-21
Cite this article as:Jaggeret al.:Capability and dependency in the Newcastle 85+ cohort study. Projections of future care needs.BMC Geriatrics201111:21.
Submit your next manuscript to BioMed Central and take full advantage of:
• Convenient online submission
• Thorough peer review
• No space constraints or color figure charges
• Immediate publication on acceptance
• Inclusion in PubMed, CAS, Scopus and Google Scholar
• Research which is freely available for redistribution