R E S E A R C H A R T I C L E
Open Access
Relationships between cognitive function
and body composition among
community-dwelling older adults: a cross-sectional
study
Hye-Mi Noh
1†, Sohee Oh
2†, Hong Ji Song
1*, Eun Young Lee
1, Jin-Young Jeong
3, Ohk-Hyun Ryu
4,
Kyung-Soon Hong
5and Dong-Hyun Kim
6*Abstract
Background:Previous studies reported mixed results regarding the association between cognition and body weight in late life. We evaluated the relationships between cognitive function and body composition among community-dwelling older adults.
Methods:Three hundred twenty subjects (≥65 years, women 53%) with available data of cognitive function and body composition from 2010 Hallym Aging Study. Cognitive function was assessed using Korean Mini-Mental State Examination (K-MMSE). Dual-energy X-ray absorptiometry (DEXA) was used for measuring body composition including body fat and lean body mass. Anthropometric measurements and laboratory data were collected in clinical examination. Body composition variables were divided into sex-specific tertiles, and examined by multivariable logistic regression.
Results:Among female, the highest tertile group of fat mass and second tertile group of total lean body mass were associated with lower risk for cognitive impairment compared to the respective first tertile groups (odds ratios, 0.23 and 0.09, respectively; 95% confidence intervals, 0.04–0.88 and 0.01–0.44, respectively) after adjusting for confounding factors. In male, higher arm bone mineral content was associated with lower risk for cognitive impairment, but significance was lost after adjusting for adiponectin, age, and education.
Conclusions:Higher fat mass and lean body mass were associated with lower risk of cognitive impairment in older women. These observations suggest that body fat and lean mass later in life might be beneficial for cognition.
Keywords:Body fat, Cognition, Dual-energy X-ray absorptiometry, Obesity, Older adult
Background
Dementia is a major cause of disability and one of the largest disease burdens in the older adult population. As the world’s population is rapidly aging, the number of people affected by dementia worldwide is expected to in-crease from 30 million in 2010 to 106 million in 2050 [1]. In Korea, the proportion of the population
composed of older adults reached 7.2% in 2000, and is predicted to reach 14.3% by 2018, which is the most rapid aging of any nation [2]. Therefore, the burden of dementia in Korea will rapidly increase in the near fu-ture. Cognitive decline is a key feature of dementia, and early detection of cognitive impairment allows adminis-tration of appropriate treatment and slows the progres-sion of dementia [3, 4]. Identification of risk factors associated with cognitive impairment and early interven-tion are important issues in the field of primary care for older adults.
Previous studies regarding the association between cognitive performance and body weight status reported * Correspondence:[email protected];[email protected]
†Equal contributors
1
Department of Family Medicine, Hallym University Sacred Heart Hospital, College of Medicine, Hallym University, Anyang, South Korea
6Department of Social and Preventive Medicine, Hallym University College of
Medicine, Chuncheon, South Korea
Full list of author information is available at the end of the article
inconsistent results. A large, retrospective cohort study in the UK reported that subjects with a higher body mass index (BMI) have a lower risk of dementia, suggesting the “obesity paradox” in dementia [5]. In addition, in an Italian population-based study, a higher BMI and higher body fat mass (BFM) were positively associated with better performance on cognitive tasks related to selective attention and executive functions [6]. The population-based, prospective Mayo Clinic Study of Aging suggested that a greater decrease in BMI per dec-ade was associated with the mild cognitive impairment [7]. In the Sydney Memory and Aging Study, BMI and body fat measured by dual-energy X-ray absorptiometry (DEXA) were related to executive function, suggesting cognitive benefits in overweight older adults [8]. How-ever, a longitudinal study (The TREVISO LONGEVA (TRELONG) Study) among northern Italian adults aged
≥70 years suggested that a high baseline BMI is risk fac-tor for cognitive decline [9]. Few studies have involved Asian populations, which have lower BMI thresholds for overweight and obesity [10]. A Chinese study reported that central obesity or low BMI were significantly associ-ated with the risk of cognitive impairment [11].
Although most previous studies used BMI to diagnose obesity, aging is accompanied by various changes in the body, such as decreasing height, lean body mass, and body fluid, and increasing fat mass [12, 13]. Therefore, BMI might not precisely reflect adiposity in older adults. Given these limitations of BMI, we used DEXA as a more accur-ate measure of body composition. To our knowledge, this is the first investigation of the relationships between DEXA measurements of body fat and cognitive perform-ance in older Asian adults. Most previous studies did not consider geriatric depression, which might act as a con-founding factor for declining cognition and decreasing body weight in the older adult population [14]. We adjusted for a wide range of covariates, including geriatric depression scale (GDS) and metabolic parameters.
In this study, we aimed to determine relationships between body phenotype and composition and cognitive function in older Korean adults, using 2010 data from the Hallym Aging Study.
Methods
Study population
The study population was selected from the Hallym Aging Study (HAS), details of which have been pub-lished elsewhere [15, 16]. Briefly, HAS is a prospective cohort consisting of community-dwelling adults in a small city in South Korea. The city was divided into 1408 areas based on the 2000 census, and 200 areas were selected randomly for this study. By systematic sampling, 30% of participants were sampled from adults aged 45–64 years, and 70% from adults aged ≥65 years.
The first-wave survey in 2003 included 1520 subjects who did not have dementia. Among them, 918 partici-pated in an in-depth clinical study in 2004. Among these 918 subjects, 547 agreed to participate in the 2007 follow-up examinations, and 382 agreed to participate in the 2010 follow-up examinations. We used the 2010 HAS data. The final study population was comprised of 320 subjects (≥65 years, women 53%) with available body composition and anthropometric data. The Institutional Review Board of Hallym University approved the study procedures, and all participants provided informed con-sent prior to enrollment in the study. The IRB allowed a legally authorized representative to provide informed consent on behalf of a decisionally impaired older adult (Additional file 1).
Measurements
To assess cognitive function, we used the Korean Mini-Mental State Examination (K-MMSE), which has been widely used in clinical evaluations and research in Korea [17]. K-MMSE consists of 23 items with a possible score of 30 points (5 for time orientation, 5 for place-orientation, 3 for memory registration, 5 for concentra-tion and calculaconcentra-tion, 3 for reminiscence, 8 for language and 1 for visual organization). Trained interviewers administered the K-MMSE at a separate space where the subject would not be disturbed for about10 minutes. Cognitive impairment was defined as below the 16th percentile using the age and education criteria [18].
Body fat and lean body mass were quantified by DEXA (Lunar, GE, Fairfield, CT, USA). Lean body mass con-sisted of skeletal muscle mass and bone mineral content. Anthropometric data were measured for subjects wear-ing light clothes and no shoes. Height was measured to the nearest 0.1 cm and weight to the nearest 0.1 kg in the upright position. BMI was calculated as weight divided by height squared (kg/m2). Waist circumfer-ence was measured at the midpoint between the upper end of the iliac crest and the lower end of the 12th rib at the end of each subject’s normal expir-ation to the nearest 0.1 cm using anthropometric tape. The waist-to-height ratio was calculated as waist circumference (cm)/height (cm). Blood pressure was measured using a standard protocol. All measure-ments were performed by a trained clinical team and quality control was monitored regularly.
Fasting plasma glucose, total cholesterol (T-Chol), high-density lipoprotein cholesterol (HDL-C), and trigly-ceride (TG) levels were measured using an auto-analyzer (Hitachi 747, Hitachi, Tokyo, Japan). Low-density-lipoprotein cholesterol (LDL-C) was calculated by the Friedwald eq. (LDL-C = T-Chol–(HDL-C + TG/5)). The homeostasis model assessment of insulin resistance (HOMA-IR) was calculated using the following equation: fasting serum insulin (μU/mL) × fasting plasma glucose (mg/dL)/405. Adiponectin was measured using plasma samples stored at −70 °C by immunoassay (VersaMax, Molecular Devices, Sunnyvale, CA, USA). Glomerular filtration rate (GFR) was estimated using the four-variable Modification of Diet in Renal Disease (MDRD) Study equation.
Statistical analyses
Data are expressed as means ± standard deviations (SD) for continuous variables and frequencies (%) for categorical variables. The assumption of normality of the data was evaluated by the Shapiro–Wilk test, and a p-value greater than 0.05 indicated that the observed distribution of a variable was not significantly different from the normal dis-tribution. HDL-C, TG, insulin, HOMA-IR, adiponectin levels, and K-MMSE were log-transformed, because they did not fit a normal distribution. We used Student’st-test to compare continuous variables and theχ2test or Fisher’s exact test to compare categorical variables between groups. We compared the demographic, metabolic, and body com-position characteristics according to the presence of cogni-tive impairment in each sex. The independent variables that showed statistically significant differences between groups were included in the logistic regression model as co-variates. Body composition variables were divided by sex-specific tertiles. Multivariable logistic regression with Firth’s penalized likelihood method was performed to estimate the adjusted odds ratio (OR) and 95% confidence interval (CI), and to assess the association between cognitive impairment and body composition. Ap-value <0.05 was considered to indicate statistical significance. IBM SPSS Statistics version 20 (IBM Corp., Armonk, NY, USA) and R version 2.15.2 (http://www.r-project.org) were used for statistical analyses.
Results
The prevalence rates of cognitive impairment were 5.92% in males and 14.29% in females. Body fat percentage and fat mass were higher in females, whereas lean body mass, skeletal muscle mass, and bone mineral content (BMC) were higher in males. There was a significant difference in K-MMSE score, body phenotype and composition, and most of potentially confounding independent variables be-tween males and females (Table 1). Therefore, we analyzed the data according to sex.
The sex-specific general characteristics of the study subjects according to the presence of cognitive impair-ment are presented in Table 2. Mean age was signifi-cantly higher in the cognitive impairment group compared to the normal cognition group in both sexes. Among body phenotypes, BMI was higher only in female with normal cognition than in the cognitive impairment group (25.52 ± 3.58 and 23.73 ± 3.14, respectively, p = 0.016), whereas waist/height ratio was not signifi-cantly different between groups. Height was greater in the normal cognition group in both sexes.
With regard to body composition, arm BMC was higher in males in the normal cognition group than in those in the cognitive impairment group (0.37 ± 0.28 and 0.29 ± 0.07, respectively, p = 0.018). Fat mass and total lean body mass were significantly higher in females with normal cognitive function than in those in the cog-nitive impairment group (19.87 ± 5.69 and 16.97 ± 4.96, respectively,p = 0.014,34.43 ± 4.36 and 33.31 ± 5.59, re-spectively, p = 0.029). In males, adiponectin level was lower in the normal cognition group than the cogni-tive impairment group (2.05 ± 0.55 and 2.48 ± 0.46, respectively, p = 0.026). In females, GDS score and rate of past history of MI were higher in the cogni-tive impairment group, whereas the prevalence of hypertension and educational level were higher in the normal cognition group.
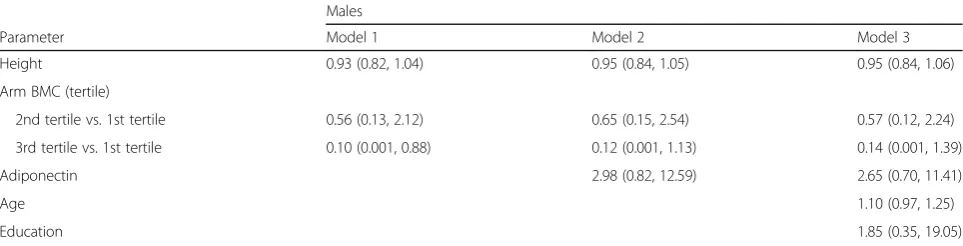
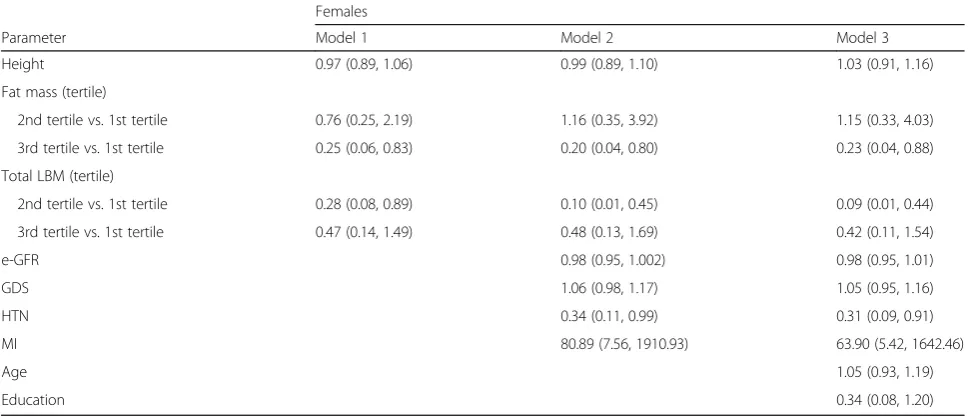
We divided the body composition variables into sex-specific tertiles, and multivariable logistic regression analysis was performed to estimate the association be-tween cognitive impairment and body composition. Among males, the highest tertile of arm BMC was associated with lower risk for cognitive impairment compared to the first tertile in model 1 (OR 0.10; 95% CI, 0.001–0.88), but significance was lost after adjusting for adiponectin, age, and education (Table 3). In females, the highest tertile group of fat mass and second tertile group of total lean body mass were associated with lower risk for cognitive impairment compared to the re-spective first tertile groups (OR 0.23 and 0.09, respect-ively; 95% CI, 0.04–0.88 and 0.01–0.44, respectively) after adjusting for confounding factors (Table 4). A past history of MI was associated with a greater risk of cogni-tive impairment, whereas treatment of hypertension was associated with lower risk of cognitive impairment. Height was not significantly associated with cognitive impairment in either sex.
Discussion
men with type 2 diabetes mellitus [19]. Shorter adults tend to have a smaller head circumference, which is associated with poorer brain reserve [20], and brain re-serves allow individuals to preserve normal cognitive function despite brain degeneration due to aging [21]. However, in the present study, height was not associated with cognitive impairment in either sex, which was not consistent with the report of Quan et al. using the 2004 HAS data; they reported that the risk of cognitive im-pairment was fourfold higher in the shortest quartile than in the tallest quartile of men, but not in women [15]. However, this previous report had limitations in that it did not consider body weight or composition as well as various confounding factors, such as comorbidi-ties and laboratory parameters.
We showed that BMI was significantly higher in fe-males with normal cognition group than in the cognitive impairment group. The mean BMI of females with normal cognition was 25.5 kg/m2, which was similar to the obesity thresholds used in Asian population [10]. However, waist/height ratio as an indicator of central obesity showed no differences according to cognitive function in either sex. A retrospective cohort study in the UK reported that subjects with a higher BMI had a lower dementia risk [5]. Compared with those of a Table 1General characteristics of the subjects
Males (n= 152)
Females
(n= 168) p
-value
Age (years) 75.67 ± 5.36 74.44 ± 4.73 0.030
BMI (kg/m2) 24.07 ± 2.99 25.26 ± 3.57 0.001
Height (cm) 162.08 ± 6.53 147.74 ± 5.62 <0.001
Waist/height ratio 0.54 ± 0.05 0.58 ± 0.07 <0.001
Body composition
Body fat (%) 24.89 ± 7.74 34.02 ± 8.52 <0.001
Fat mass (kg) 16.94 ± 4.95 19.46 ± 5.67 <0.001
Total LBM (kg) 43.92 ± 6.01 34.27 ± 4.55 <0.001
Arm LBM (kg) 4.96 ± 0.88 3.61 ± 0.75 <0.001
Leg LBM (kg) 13.83 ± 2.33 10.29 ± 1.70 <0.001
Total ASM (kg) 17.53 ± 2.89 13.06 ± 2.18 <0.001
Arm SM (kg) 4.59 ± 0.86 3.38 ± 0.73 <0.001
Leg SM (kg) 12.93 ± 2.19 9.68 ± 1.59 <0.001
Arm BMC (kg) 0.37 ± 0.27 0.23 ± 0.16 <0.001
Leg BMC (kg) 0.89 ± 0.17 0.61 ± 0.14 <0.001
SBP (mmHg) 137.8 ± 16.12 138.95 ± 16.74 0.535
DBP (mmHg) 78.04 ± 9.05 77.77 ± 8.44 0.781
Fasting glucose (mg/dL)
100.68 ± 25.76 98.82 ± 29.44 0.550
HbA1C (%) 5.96 ± 0.91 5.93 ± 0.75 0.798
Fasting insulin (μU/mL)
1.5 ± 0.81 1.77 ± 0.7 0.002
HOMA-IR 0.09 ± 0.9 0.34 ± 0.77 0.009
LDL cholesterol (mg/dL)
111.32 ± 34.62 115.69 ± 32.98 0.251
HDL cholesterol (mg/dL)
3.85 ± 0.26 3.87 ± 0.25 0.411
Triglyceride (mg/dL) 4.79 ± 0.56 4.85 ± 0.53 0.320
Albumin (g/dL) 4.47 ± 0.36 4.47 ± 0.31 0.923
hs-CRP (mg/L) 0.38 ± 1.4 0.22 ± 0.65 0.194
Testosterone (ng/ml) 5.2 ± 1.86 0.12 ± 0.13 <0.001
e-GFR (mL/min/ per 1.73 m2)
78.54 ± 18.14 85.42 ± 19.18 0.001
Adiponectin (μg/mL) 2.08 ± 0.56 2.34 ± 0.51 <0.001
Hemoglobin (g/dL) 14.39 ± 1.65 13.04 ± 1.08 <0.001
GGT (IU/L) 34.09 ± 34.42 24.19 ± 28.59 0.006
Uric acid (mg/dL) 5.38 ± 1.48 4.23 ± 1.17 <0.001
Comorbidities on treatment
Hypertension (%) 75 (49.34%) 90 (53.57%) 0.450
DM (%) 26 (17.11%) 22 (13.10%) 0.316
Dyslipidemia (%) 63 (42.28%) 107 (63.69%) <0.001
CVA (%) 15 (9.87%) 11 (6.55%) 0.278
MI (%) 14 (9.21%) 5 (2.98%) 0.018
Lifestyle
Smoking (packs/year) 30.27 ± 28.56 0.65 ± 4.23 <0.001
Table 1General characteristics of the subjects(Continued)
Males (n= 152)
Females
(n= 168) p
-value
Alcohol (g/week) 152.74 ± 362.32 7.94 ± 33.44 <0.001
Exercise (%) <0.001
< 3 times/week 105 (69.08%) 152 (90.48%)
3–4 times/week 14 (9.21%) 7 (4.17%)
> 4 times/week 33 (21.71%) 9 (5.36%)
Education <0.001
0 12 (7.89%) 65 (38.69%)
1–5 (years) 17 (11.18%) 34 (20.24%)
≥6 (years) 123 (80.92%) 69 (41.07%)
GDS 13.57 ± 6.9 16.58 ± 6.87 <0.001
K-MMSE 26.6 ± 3.11 23.98 ± 5.3 <0.001
Log (31-K-MMSE) 1.25 ± 0.71 1.63 ± 0.86 <0.001
Cognitive impairmenta 9 (5.92%) 24 (14.29%) 0.014
Abbreviations:BMCBone mineral content,BMIBody mass index,CVA Cerebrovascular accident,DBPdiastolic blood pressure,DMDiabetes mellitus, e-GFRestimated glomerular filtration rate,GDSgeriatric depression scale,GGT gamma glutamyl transferase,HDLHigh-density lipoprotein,HOMA-IR homeo-stasis model assessment of insulin resistance,hs-CRPHigh-sensitivity C-reactive protein,K-MMSEKorean Mini-Mental State Examination,LBMLean body mass, LDLLow-density lipoprotein,MIMyocardial infarction,SBPsystolic blood pres-sure,SMskeletal muscle mass. All values are means ± SDs or n (%).p-values were calculated by Student’st-test orχ2
test. Adiponectin, HDL, HOMA-IR, insu-lin, triglyceride, K-MMSE were log-transformed because they were not normally distributed. The data describing comorbidities and treatments were obtained from structured questionnaires.a
Table 2Characteristics of the study subjects with or without cognitive impairment according to sex
Males Females
Cognitive impairment Cognitive impairment
Yes (n= 9) No (n= 143) p-value Yes (n= 24) No (n= 144) p-value
Age (year) 80.11 ± 7.79 75.39 ± 5.09 0.038 76.29 ± 4.59 74.13 ± 4.7 0.033
BMI (kg/m2) 22.37 ± 3.87 24.18 ± 2.91 0.109 23.73 ± 3.14 25.52 ± 3.58 0.016
Height (cm) 157.97 ± 5.99 162.34 ± 6.49 0.048 145.88 ± 5.31 148.05 ± 5.63 0.049
Waist/height ratio 0.51 ± 0.07 0.54 ± 0.05 0.203 0.57 ± 0.06 0.58 ± 0.07 0.390
Body composition
Body fat (%) 20.12 ± 7.16 25.19 ± 7.7 0.076 31.38 ± 9.06 34.46 ± 8.38 0.076
Fat mass (kg) 14.03 ± 5.48 17.12 ± 4.88 0.082 16.97 ± 4.96 19.87 ± 5.69 0.014
Total LBM (kg) 41.98 ± 7.15 44.05 ± 5.94 0.480 33.31 ± 5.59 34.43 ± 4.36 0.029
Arm LBM (kg) 4.54 ± 0.98 4.99 ± 0.87 0.243 3.54 ± 0.82 3.63 ± 0.74 0.362
Leg LBM (kg) 13.22 ± 3.00 13.87 ± 2.29 0.637 10.09 ± 1.95 10.33 ± 1.66 0.180
Total ASM (kg) 16.65 ± 3.66 17.58 ± 2.84 0.615 12.80 ± 2.51 13.11 ± 2.13 0.255
Arm SM (kg) 4.25 ± 0.92 4.61 ± 0.85 0.305 3.33 ± 0.76 3.39 ± 0.72 0.367
Leg SM (kg) 12.40 ± 2.83 12.97 ± 2.15 0.665 9.48 ± 1.80 9.72 ± 1.56 0.180
Arm BMC (kg) 0.29 ± 0.07 0.37 ± 0.28 0.018 0.21 ± 0.07 0.23 ± 0.17 0.456
Leg BMC (kg) 0.82 ± 0.21 0.90 ± 0.16 0.195 0.61 ± 0.17 0.61 ± 0.14 0.472
SBP (mmHg) 138.67 ± 20.55 137.75 ± 15.89 0.509 140.62 ± 19.8 138.67 ± 16.24 0.702
DBP (mmHg) 75.67 ± 12.1 78.19 ± 8.86 0.392 76.92 ± 10.99 77.91 ± 7.98 0.908
Fasting glucose (mg/dL) 112.89 ± 59.47 99.9 ± 22.22 0.745 94.42 ± 16.76 99.55 ± 31.04 0.605
HbA1C (%) 5.58 ± 0.27 5.98 ± 0.93 0.195 5.77 ± 0.58 5.96 ± 0.77 0.147
Fasting insulin (μU/mL) 1.22 ± 1.13 1.52 ± 0.78 0.205 1.71 ± 0.65 1.78 ± 0.71 0.295
HOMA-IR −0.13 ± 1.31 0.1 ± 0.87 0.407 0.24 ± 0.63 0.35 ± 0.79 0.338
LDL cholesterol (mg/dL) 102.11 ± 19.92 111.91 ± 35.32 0.372 114.12 ± 38.78 115.95 ± 32.06 0.924
HDL cholesterol (mg/dL) 3.94 ± 0.24 3.84 ± 0.26 0.232 3.88 ± 0.32 3.87 ± 0.24 0.861
Triglyceride (mg/dL) 4.66 ± 0.54 4.8 ± 0.57 0.491 4.71 ± 0.67 4.87 ± 0.51 0.117
Albumin (g/dL) 4.43 ± 0.41 4.48 ± 0.36 0.606 4.33 ± 0.41 4.49 ± 0.28 0.051
hs-CRP (mg/L) 0.2 ± 0.16 0.4 ± 1.44 0.738 0.62 ± 1.62 0.16 ± 0.19 0.138
Testosterone (ng/ml) 4.79 ± 2.33 5.23 ± 1.83 0.582 0.11 ± 0.1 0.12 ± 0.13 0.903
e-GFR (mL/min/per 1.73 m2) 88.7 ± 19.58 77.88 ± 17.92 0.057 76.16 ± 23.62 86.96 ± 17.98 0.017
Adiponectin (μg/mL) 2.48 ± 0.46 2.05 ± 0.55 0.026 2.37 ± 0.51 2.33 ± 0.51 0.724
Hemoglobin (g/dL) 14.31 ± 1.5 14.4 ± 1.66 0.776 12.66 ± 1.41 13.1 ± 1.01 0.236
GGT (IU/L) 50 ± 70.17 33.07 ± 30.99 0.304 30.21 ± 40.3 23.19 ± 26.19 0.678
Uric acid (mg/dL) 4.84 ± 1.2 5.41 ± 1.49 0.275 4.29 ± 1.19 4.22 ± 1.17 0.879
Comorbidities on treatment
Hypertension (%) 3 (33.33%) 72 (50.35%) 0.495 8 (33.33%) 82 (56.94%) 0.032
DM (%) 2 (22.22%) 24 (16.78%) 0.652 2 (8.33%) 20 (13.89%) 0.744
Dyslipidemia (%) 2 (22.22%) 61 (43.57%) 0.303 16 (66.67%) 91 (63.19%) 0.743
CVA (%) 1 (11.11%) 14 (9.79%) 1.000 2 (8.33%) 9 (6.25%) 0.659
MI (%) 0 (0.00%) 14 (9.79%) 1.000 4 (16.67%) 1 (0.69%) 0.001
Lifestyle
Smoking (pack/year) 32.41 ± 39.12 30.14 ± 27.94 0.842 1.12 ± 5.47 0.57 ± 4 0.849
Alcohol (g/week) 148.21 ± 238.27 153.03 ± 369.32 0.780 2.35 ± 8.68 8.87 ± 35.88 0.415
healthy weight, underweight persons (BMI <20 kg/m2) had a 34% higher (95% CI 29–38) risk of dementia. Fur-thermore, the incidence of dementia decreased for each increase in BMI category, with very obese individuals (BMI >40 kg/m2) having a 29% lower (95% CI 22–36) risk of dementia than those of a healthy weight. An Ital-ian population-based study also reported that MMSE was positively associated with BMI and BFM calculated from skin fold thickness in both men and women [6]. Recent systematic reviews suggested an inverse associ-ation between obesity defined by BMI in late-life and dementia, consistent with the concept of the obesity paradox. However, they included 21 studies (only one Asian study), which had relatively short follow-up period, and did not consider sex-related differences [22].
Aging is accompanied by various changes in the body—such as decreasing height, lean body mass, and body fluid—whereas fat mass increases; therefore, the BMI in older adults might not precisely reflect their adi-posity [12, 13]. Given these limitations of BMI, we used DEXA as a more accurate measure of body composition, and demonstrated that higher fat mass and lean mass
were associated with lower risk of cognitive impairment in females.
Several possible mechanisms may explain how obesity, defined by excess adipose tissue, is related to cognitive function. First, body fat contains sex hormones and leptin, which may contribute to prevention of cognitive decline in older adults [23]. Second, a previous study re-ported that BMI was positively associated with greater white matter volume, suggesting that obesity increases myelin [24]. However, these positive associations be-tween obesity and cognition could also result from the ‘survival bias’—obese individuals who live through mid-dle age may have genes associated with higher cognitive function [25]. In addition, underweight and cognitive impairment might share an etiology. First, dysregulation of hormone secretion has been observed in anorexia, which could lead to a decline in cognitive function [26]. Second, an underweight status in the older adults may indicate preclinical dementia [27]. Third, underweight could also be a result of mental illness, such as depres-sion. Geriatric depression might lead to both a decline in cognition and a decrease in body weight, which could Table 2Characteristics of the study subjects with or without cognitive impairment according to sex(Continued)
Males Females
Cognitive impairment Cognitive impairment
Yes (n= 9) No (n= 143) p-value Yes (n= 24) No (n= 144) p-value
< 3 times/week 7 (77.78%) 98 (68.53%) 21 (87.50%) 131 (90.97%)
≥3 times/week 2 (22.22%) 45 (31.47%) 3 (12.50%) 13 (9.03%)
Education 1.000 0.002
< 6 (years) 1 (11.11%) 28 (19.58%) 21 (87.50%) 78 (54.16%)
≥6 (years) 8 (88.89%) 115 (80.42%) 3 (12.50%) 66 (45.83%)
GDS 15.44 ± 6.69 13.45 ± 6.91 0.394 19.38 ± 4.98 16.11 ± 7.04 0.040
Abbreviations:BMCBone mineral content,BMIBody mass index,CVACerebrovascular accident,DBPDiastolic blood pressure,DMDiabetes mellitus,e-GFR Estimated glomerular filtration rate,GDSGeriatric depression scale,GGTGamma glutamyl transferase,HDLHigh-density lipoprotein,HOMA-IRHomeostasis model assessment of insulin resistance,hs-CRPHigh-sensitivity C-reactive protein,K-MMSEKorean Mini-Mental State Examination,LBMLean body mass,LDLLow-density lipoprotein,MImyocardial infarction,SBPSystolic blood pressure,SMSkeletal muscle mass. Adiponectin, HDL, HOMA-IR, insulin, and triglyceride were log-transformed because they were not normally distributed. The data describing comorbidities and treatments were obtained from structured questionnaires
Table 3Multivariable adjusted odds ratios of cognitive impairment and body composition among males
Males
Parameter Model 1 Model 2 Model 3
Height 0.93 (0.82, 1.04) 0.95 (0.84, 1.05) 0.95 (0.84, 1.06)
Arm BMC (tertile)
2nd tertile vs. 1st tertile 0.56 (0.13, 2.12) 0.65 (0.15, 2.54) 0.57 (0.12, 2.24)
3rd tertile vs. 1st tertile 0.10 (0.001, 0.88) 0.12 (0.001, 1.13) 0.14 (0.001, 1.39)
Adiponectin 2.98 (0.82, 12.59) 2.65 (0.70, 11.41)
Age 1.10 (0.97, 1.25)
Education 1.85 (0.35, 19.05)
Abbreviations:BMCBone mineral content. Model 1 includes height and arm BMC. Model 2 includes the Model 1 variables plus adiponection. Model 3 includes the Model 2 variables plus age and education
act as confounding factors between cognition and body weight in older adults [14, 28]. However, in our study, the association between cognitive function and fat mass remained significant after adjusting for de-pression scores.
Previous studies suggested that loss of muscle mass and function, sarcopenia, might be related to brain atro-phy and low cognitive performance [29]. We found that the second tertile group of total lean body mass in females showed lower risk for cognitive impairment compared to the first tertile group, however, there was no significant association in the third tertile group. In the Epidemiologie de l’Osteoporose (EPIDOS) cohort study, six definitions of sarcopenia were used, none of which was associated with cognitive impairment. How-ever, a low gait speed and low handgrip strength were associated with cognitive impairment [30].
In the present study, interestingly, we found that a past history of MI was associated with higher risk of cognitive impairment in females, but not in males. How-ever, there was no subject with a history of MI among nine males with cognitive impairment, and it was, there-fore, difficult to judge the association between MI and cognitive function. This may be due to the relatively small sample size in our study or survival bias caused by high mortality of MI. Our findings suggested that physicians should pay attention to cognitive decline and consider dementia screening among older adults with a history of MI. The Women’s Health Initiative Memory Study reported that cardiovascular diseases, especially MI or angina, were associated with cognitive decline in elderly postmenopausal women [31]. When MI occurs,
the blood supply to the heart and brain is decreased, which leads to loss of grey matter volume and cognitive impairment [32]. Further studies are warranted to
inves-tigate the mechanism underlying the association
between MI and cognitive impairment.
This study had several limitations. First, it was of a cross-sectional design, which prevented making causal inferences between body composition and cognitive function. Second, because of the relatively small sample size, our results could not well represent the general Korean older adult population. To determine the influ-ence of body composition on cognitive impairment, further large prospective studies are needed. Third, we used the MMSE to assess cognitive function. Although MMSE is the most commonly used screening test for dementia, the results of MMSE may not always match those of a detailed battery of cognitive tests.
Despite these limitations, our study confirmed the as-sociations between specific components of body com-position and cognitive function in an older adult Korean population. In addition, we used DEXA as a more accur-ate measure of body composition, and adjusted for a wide range of confounding factors, such as metabolic parameters and depression.
Conclusions
We demonstrated that higher fat mass and lean mass were associated with lower risk of cognitive impairment in older adult Korean women. Future studies should clarify the relationship between fat mass at older ages and cognitive function.
Table 4Multivariable adjusted odds ratios of cognitive impairment and body composition among females
Females
Parameter Model 1 Model 2 Model 3
Height 0.97 (0.89, 1.06) 0.99 (0.89, 1.10) 1.03 (0.91, 1.16)
Fat mass (tertile)
2nd tertile vs. 1st tertile 0.76 (0.25, 2.19) 1.16 (0.35, 3.92) 1.15 (0.33, 4.03)
3rd tertile vs. 1st tertile 0.25 (0.06, 0.83) 0.20 (0.04, 0.80) 0.23 (0.04, 0.88)
Total LBM (tertile)
2nd tertile vs. 1st tertile 0.28 (0.08, 0.89) 0.10 (0.01, 0.45) 0.09 (0.01, 0.44)
3rd tertile vs. 1st tertile 0.47 (0.14, 1.49) 0.48 (0.13, 1.69) 0.42 (0.11, 1.54)
e-GFR 0.98 (0.95, 1.002) 0.98 (0.95, 1.01)
GDS 1.06 (0.98, 1.17) 1.05 (0.95, 1.16)
HTN 0.34 (0.11, 0.99) 0.31 (0.09, 0.91)
MI 80.89 (7.56, 1910.93) 63.90 (5.42, 1642.46)
Age 1.05 (0.93, 1.19)
Education 0.34 (0.08, 1.20)
Abbreviations:LBMLean body mass,MIMyocardial infarction,GDSGeriatric depression scale. Model 1 includes height, fat mass, and total LBM. Model 2 includes the Model 1 variables plus e-GFR, GDS, HTN, MI. Model 3 includes the Model 2 variables plus age and education
Additional file
Additional file 1: Figure S1.Flowchart of the selection of the study population. (DOCX 23 kb)
Abbreviations
BMI:Body mass index; DEXA: Dual-energy X-ray absorptiometry; GDS: Geriatric depression scale; HAS: Hallym Aging Study; K-MMSE: Korean Mini-Mental State Examination
Acknowledgements
Not applicable.
Funding
This research was supported by Hallym University Research Fund (HURF-2015-33).
The Hallym Aging Study (HAS) was supported by grants from the Korea Research Foundation (047-BM1028).
Availability of data and materials
The datasets is available from the corresponding author on reasonable request.
Authors’contributions
HJS and HMN suggested the study. HJS, HMN, SO and DHK designed the study and developed the study protocol. SO, HMN and HJS analysed the data. All authors interpreted the results. HMN, SO and HJS drafted the manuscript. All authors contributed to the critical revision of the manuscript. DHK, HJS, HMN and SO has full access to all of the data in the study and takes responsibility for the integrity of the data and the accuracy of the data analysis. All authors read and approved the final manuscript.
Ethics approval and consent to participate
The protocols and procedures of our study were approved by Institutional Review Board of Hallym University, and all participants provided informed consents before study enrollment. On behalf of decisionally impaired older adults, legally authorized representative provided the informed consents.
Consent for publication
Not applicable.
Competing interests
The authors declare that they have no competing interests.
Publisher’s Note
Springer Nature remains neutral with regard to jurisdictional claims in published maps and institutional affiliations.
Author details
1Department of Family Medicine, Hallym University Sacred Heart Hospital,
College of Medicine, Hallym University, Anyang, South Korea.2Department of Biostatistics, Seoul Metropolitan Government Seoul National University Boramae Medical Center, Seoul, South Korea.3Hallym Research Institute of Clinical Epidemiology, Hallym University, Chuncheon, South Korea.
4
Department of Endocrinology, Chuncheon Sacred Heart Hospital, College of Medicine, Hallym University, Chuncheon, South Korea.5Department of
Cardiology, Chuncheon Sacred Heart Hospital, College of Medicine, Hallym University, Chuncheon, South Korea.6Department of Social and Preventive
Medicine, Hallym University College of Medicine, Chuncheon, South Korea.
Received: 13 December 2016 Accepted: 22 October 2017
References
1. Brookmeyer R, Johnson E, Ziegler-Graham K, Arrighi HM. Forecasting the global burden of Alzheimer's disease. Alzheimers Dement. 2007;3(3):186–91. 2. Park JH, Eum JH, Bold B, Cheong HK. Burden of disease due to dementia in
the elderly population of Korea: present and future. BMC Public Health. 2013;13:293.
3. Siemers E. Designing clinical trials for early (pre-dementia) Alzheimer's disease: determining the appropriate population for treatment. J Nutr Health Aging. 2011;15(1):22–4.
4. Sperling RA, Aisen PS, Beckett LA, Bennett DA, Craft S, Fagan AM, Iwatsubo T, Jack CR Jr, Kaye J, Montine TJ, et al. Toward defining the preclinical stages of Alzheimer's disease: recommendations from the National Institute on Aging-Alzheimer's Association workgroups on diagnostic guidelines for Alzheimer's disease. Alzheimers Dement. 2011;7(3):280–92.
5. Qizilbash N, Gregson J, Johnson ME, Pearce N, Douglas I, Wing K, Evans SJ, Pocock SJBMI. Risk of dementia in two million people over two decades: a retrospective cohort study. Lancet Diabetes Endocrinol. 2015;3(6):431–6. 6. Tikhonoff V, Casiglia E, Guidotti F, Giordano N, Martini B, Mazza A, Spinella P,
Palatini P. Body fat and the cognitive pattern: a population-based study. Obesity (Silver Spring). 2015;23(7):1502–10.
7. Alhurani RE, Vassilaki M, Aakre JA, Mielke MM, Kremers WK, Machulda MM, Geda YE, Knopman DS, Peterson RC, Roberts RO. Decline in weight and incident mild cognitive impairment: Mayo Clinic study of aging. JAMA Neurol. 2016;
8. Smith E, Bailey PE, Crawford J, Samaras K, Baune BT, Campbell L, Kochan N, Menant J, Sturnieks DL, Brodaty H, et al. Adiposity estimated using dual energy X-ray absorptiometry and body mass index and its association with cognition in elderly adults. J Am Geriatr Soc. 2014;62(12):2311–8. 9. Gallucci M, Mazzuco S, Ongaro F, Di Giorgi E, Mecocci P, Cesari M, Albani D,
Forloni GL, Durante E, Gajo GB, et al. Body mass index, lifestyles, physical performance and cognitive decline: the "Treviso Longeva (TRELONG)" study. J Nutr Health Aging. 2013;17(4):378–84.
10. Deurenberg-Yap M, Yian TB, Kai CS, Deurenberg P, VANS WA. Manifestation Of cardiovascular risk factors at low levels of body mass index and waist-to-hip ratio in Singaporean Chinese. Asia Pac J Clin Nutr. 1999;8(3):177–83. 11. Cui GH, Guo HD, RF X, Jiang GX, Chen SD, Cheng Q. The association of weight status with cognitive impairment in the elderly population of a shanghai suburb. Asia Pac J Clin Nutr. 2013;22(1):74–82.
12. Gallagher D, Visser M, Sepulveda D, Pierson RN, Harris T, Heymsfield SB. How useful is body mass index for comparison of body fatness across age, sex, and ethnic groups? Am J Epidemiol. 1996;143(3):228–39.
13. Bedogni G, Pietrobelli A, Heymsfield SB, Borghi A, Manzieri AM, Morini P, Battistini N, Salvioli GI. Body mass index a measure of adiposity in elderly women? Obes Res. 2001;9(1):17–20.
14. Huffman GB. Evaluating and treating unintentional weight loss in the elderly. Am Fam Physician. 2002;65(4):640–50.
15. Quan SA, Jeong JY, Kim DH. The relationship between height and cognitive function among community-dwelling elderly: Hallym aging study. Epidemiol Health. 2013;35:e2013002.
16. Song HJ, OH S, Quan S, Ryu OH, Jeong JY, Hong KS, Kim DH. Gender differences in adiponectin levels and body composition in older adults: Hallym aging study. BMC Geriatr. 2014;14:8.
17. Han C, Jo SA, Jo I, Kim E, Park MH, Kang Y. An adaptation of the Korean mini-mental state examination (K-MMSE) in elderly Koreans: demographic influence and population-based norms (the AGE study). Arch Gerontol Geriatr. 2008;47(3):302–10.
18. Kang YW. A Normative study of the Korean-mini mental state examination (K-MMSE) in the elderly. Korean Journal of Psychology. 2006;25(2):1–12. 19. West RK, Ravona-Springer R, Heymann A, Schmeidler J, Leroith D, Koifman
K, Guerrero-Berroa E, Preiss R, Hoffman H, Silverman JM, et al. Shorter adult height is associated with poorer cognitive performance in elderly men with type II diabetes. J Alzheimers Dis. 2015;44(3):927–35.
20. Perneczky R, Wagenpfeil S, Lunetta KL, Cupples LA, Green RC, Decarli C, Farrer LA, Kurz A, Group MS. Head circumference, atrophy, and cognition: implications for brain reserve in Alzheimer disease. Neurology. 2010;75(2):137–42.
21. Stern Y. What is cognitive reserve? Theory and research application of the reserve concept. Journal of the International Neuropsychological Society : JINS. 2002;8(3):448–60.
22. Pedditizi E, Peters R, Beckett N. The risk of overweight/obesity in mid-life and late life for the development of dementia: a systematic review and meta-analysis of longitudinal studies. Age Ageing. 2016;45(1):14–21. 23. Zeki Al Hazzouri A, Haan MN, Whitmer RA, Yaffe K, Neuhaus J. Central
obesity, leptin and cognitive decline: the Sacramento area Latino study on aging. Dement Geriatr Cogn Disord. 2012;33(6):400–9.
25. Smith E, Hay P, Campbell L, Trollor JNA. Review of the association between obesity and cognitive function across the lifespan: implications for novel approaches to prevention and treatment. Obes Rev. 2011;12(9):740–55. 26. Gustafson D. Adiposity indices and dementia. Lancet Neurol. 2006;5(8):
713–20.
27. Stewart R, Masaki K, Xue QL, Peila R, Petrovitch H, White LR, Launer LJ. A 32-year prospective study of change in body weight and incident dementia: the Honolulu-Asia aging study. Arch Neurol. 2005;62(1):55–60.
28. Tamura BK, Bell CL, Masaki KH, Amella EJ. Factors associated with weight loss, low BMI, and malnutrition among nursing home patients: a systematic review of the literature. J Am Med Dir Assoc. 2013;14(9):649–55.
29. Hsu YH, Liang CK, Chou MY, Liao MC, Lin YT, Chen LK, Lo YK. Association of cognitive impairment, depressive symptoms and sarcopenia among healthy older men in the veterans retirement community in southern Taiwan: a cross-sectional study. Geriatr Gerontol Int. 2014;14(Suppl 1):102–8. 30. Abellan van Kan G, Cesari M, Gillette-Guyonnet S, Dupuy C, Nourhashemi F,
Schott AM, Beauchet O, Annweiler C, Vellas B, Rolland Y. Sarcopenia and cognitive impairment in elderly women: results from the EPIDOS cohort. Age Ageing. 2013;42(2):196–202.
31. Haring B, Leng X, Robinson J, Johnson KC, Jackson RD, Beyth R, Wactawski-Wende J, von Ballmoos MW, Goveas JS, Kuller LH, et al. Cardiovascular disease and cognitive decline in postmenopausal women: results from the Women's Health Initiative memory study. J Am Heart Assoc. 2013;2(6): e000369.
32. Almeida OP, Garrido GJ, Beer C, Lautenschlager NT, Arnolda L, Lenzo NP, Campbell A, Flicker L. Coronary heart disease is associated with regional grey matter volume loss: implications for cognitive function and behaviour. Intern Med J. 2008;38(7):599–606.
• We accept pre-submission inquiries
• Our selector tool helps you to find the most relevant journal
• We provide round the clock customer support
• Convenient online submission
• Thorough peer review
• Inclusion in PubMed and all major indexing services
• Maximum visibility for your research
Submit your manuscript at www.biomedcentral.com/submit