R E S E A R C H A R T I C L E
Open Access
Simulation study of activities of daily living
functions using online computerized
adaptive testing
Tsair-Wei Chien
1,2,3*and Weir-Sen Lin
2Abstract
Background:Computer adaptive testing (CAT) of the activities of daily living (ADL) functions is required (i) to reveal the advantages of using an efficient and accurate estimation method, (ii) to determine the cutpoint for classifying ADL strata in patients with stroke, and (iii) to evaluate the feasibility of online CAT used in clinical settings for smartphones.
Methods:Normally standardized distributions of ADL measurements were simulated using item parameters from published papers. We retrieved item parameters of the combined Barthel Index and Frenchay Activities Index from the literature (the 23-item comprehensive ADL [CADL] and 34-item ADL scales) and simulated three 1000-person measures from a normal standard CAT distribution: [i] CADL (CADL-CAT), [ii] ADL (ADL-CAT), and [iii] NAT (Non-Adaptive Testing). The cutpoints of ADL person strata were determined using a norm-reference
method.Maximum a posterioriestimation,expected a posterioriestimation, andmaximum likelihood estimation
(MAP) were used to compare the Pearson correlation coefficients and different number ratios of paired measures yielded by CAT and NAT. The number of items and the cutpoints for the scale were separately determined.
Results:We found that (i) correlation coefficients for the three CAT-estimated measures were 0.77 (CADL), 0.93 (Male ADL), and 0.93 (Female ADL) compared with their NAT counterparts. Different number ratios of person-paired measures between CAT and NAT for the three scales were all less than 5 %, indicating no difference exists between CAT and NAT. However, CAT might be 66 % more efficient than NAT. (ii) The estimated cutpoints of T scores (i.e., with a mean of 50 and a standard deviation of 10) were 45, 55, and 65 (e.g., separating person ADL function to four strata withnot active,fairly active,active, andvery active). (iii) An available-for-download online ADL-CAT APP for clinical practice was demonstrated.
Conclusions:An online ADL-CAT APP using the MAP method was created and used on smartphones to classify ADL strata in patients with stroke.
Background
Physical therapists (PTs) help patients overcome func-tional disabilities in their physical and social environments [1, 2]. They use a variety of functional scales to evaluate the functional levels of the instrumental activities of daily living (IADL) of their patients. The psychometric proper-ties of these scales have been validated for use in patients with stroke [3–7]. However, most of them merely report
numerical results that are not translated into the degree (or classification) of their functional problems relative to a cutpoint (e.g., separating person ADL function strata with not active,fairly active,active, andvery active) that can be generalized to other healthcare sites and other samples.
Cutpoints must be determined for patients
Specifically, activities of daily living (ADL) function as-sessment consist of two scales: (i) the Barthel Index [BI]) [3] and (ii) the Frenchay Activities Index [FAI]) [8]. Because the former tends to have ceiling effects [9], and the latter to have floor effects [7, 10], several authors [7, 11, 12] have recommended combining the * Correspondence:[email protected]
1Research Department, Chi-Mei Medical Center, Tainan, Taiwan
2Department of Hospital and Health Care Administration, Chia-Nan University of Pharmacy and Science, Tainan, Taiwan
Full list of author information is available at the end of the article
two to assess the broad spectrum of ADL functions. Al-though such a combined scale theoretically overcomes the drawback of floor and ceiling effects [5, 7, 13, 14], none reports cutpoints for the scale. Cutpoints can be used for PTs and patients to identify the degree of pa-tient functional problems.
Patients are required to answer fewer questions without compromising precision
Combining the two indices seems inefficient because together they require more than 20 min to complete [5, 15, 16]. This means that the traditional non-adaptive testing (NAT) questionnaires have a large respondent bur-den because they require patients to answer questions that provide no additional information for person estimation [17]. Thus, some researchers [2] recommend using com-puter adaptive testing (CAT) scales to reduce the patient burden. As with all forms of Web-based technology, advances in mobile health (mHealth) and health commu-nication technology are rapidly increasing [17]. So far, however, there is no online ADL CAT assessment for smartphones.
Computer programmers must choose suitable types of CAT estimation methods
Item response theory (IRT)-based CAT has been pro-posed [2, 18–21] for efficient, reliable, and valid assess-ments of health-related functions. Although many researchers have contributed to the dichotomous [2, 7], polytomous [22, 23], and combined item-bank formats used by CAT (called a Rasch partial credit model [PCM] [24] or a generalized partial credit model [GPCM] [25]), few were jointly available for a comparison of precision and efficiency differences in CAT estimation methods (e.g.,maximum likelihood estimation[MLE] [26], expected a posteriori estimation [EAP] [27, 28], and maximum a posteriori estimation[MAP] [29]).
Study aims
The aims of the current study were to (i) compare CAT and NAT precision and efficiency, (ii) determine the cut-points of ADL person strata, and (iii) design an online ADL-CAT assessment APP for smartphones.
Methods
Study data yielded from simulation data of three kinds of response patterns
The item parameters were retrieved from both the com-bined 23-item comprehensive ADL/(CADL) [7] and the 34-item ADL for males and females [5]. We assumed that all patients’true scores follow a normal distribution accord-ing to reference [5] (cf. http://ptjournal.apta.org/content/ 93/5/681/F1.large.jpg). When 1,000 persons’ true scores (sampled from a normal distribution [~N(0,1)]) and item
difficulties (retrieved from previously published articles [5, 7]) were known (Tables 1 and 2), we simulated three kinds of response pattern datasets using the IRT prob-ability modeling method [30, 31]. A CADL (1000
Table 1Item bank used for ADL-CAT
GPCM parameters for discrimination (D) and threshold step difficulties
Item bank for ADL-CAT D (M/F)
Step 1 (M/F)
Step 2 Step 3
1. Washing face 2.18 −1.36
2. Brushing teeth 1.73 −1.57
3. Climbing stairs (up and down 1 story)
1.14 −0.47
4. Walking outside (in the neighborhood for > 15 min)
0.8 −0.84
5. Taking public transportation 0.52 −0.11
6. Preparing light meals 1.28/2.6 0.68/0.3
7. Preparing ingredients for meals 2.71/1.9 1.36/0.81
8. Washing dishes 2.07/3.65 1.19/0.73
9. Trash disposal 1.28/2.16 1.38/0.77
10. Taking out the trash 1.45/4.31 1.5/1.07
11. Washing clothes 2.12/1.93 1.23/0.65
12. Using a telephone 0.83 −0.78
13. Social outings 0.56 0.53
14. Reading newspapers 0.56 0.48
15. Reading books 0.57 1.13
16. Using a computer 0.7 1.64
17. Art activities 0.78 3.3
18. Playing board games/cards 0.62 2.62
19. Singing karaoke 0.63 2.24
20. Going to a spa (mainly for hot/cold water treatments)
0.96 2.64
21. Withdrawing money 1.18 1.1
22. Volunteer work 0.66 3.54
23. Gainful work 0.73 2.53
24. Drinking 0.82 −2.17 −1.12
25. Eating 1.06 −1.95 −0.78
26. Bladder management 3.23 −1.01 −0.36
27. Bowel management 3.02 −1.12 −0.24
28. Getting up 1.95 −1.6 −0.59
29. Walking inside the house 1.77 −1.31 −0.36
30. Taking medicine on time 0.93 −1.73 −0.09
31. Watching television 0.55 −2.48 −1.35
32. Putting on clothes 2.07 −0.83 −0.03 0.16
33. Taking off clothes 2.36 −0.87 −0.15 0.04
34. Putting on trousers/skirts 2.51 −0.77 −0.12 0.07
ADL-CATactivities of daily living-Computerized Adaptive Testing,GPCM
persons × 23 items) and an ADL (1000 persons × 34 items) for males and females, respectively, were then generated (see spread sheets: main and simulation in Additional file 1).
Tasks to reach the Aims
Three types of CAT estimations to compare CAT precision and efficiency
Three algorithms—MLE, MAP, and EAP—are com-monly used to estimate person measures within the CAT framework. The predominant method is called MLE because it simply finds the highest point on the likelihood function and returns the value at which it oc-curs. A common variant of this is the Bayesian model estimation procedure, also called MAP, where this likeli-hood function is multiplied by an additional curve that represents an assumed population distribution. A further variant is to take this Bayesian-modified curve and find, rather than the maximum point, the average value as weighted by the function. This is referred to as Bayesian expectation a posteriori (EAP) estimation. We used these three estimation methods to compare CAT with
NAT on precision and efficiency. We ran an author-made VBA (Visual Basic for Applications) module in Microsoft Excel to conduct the simulation study (see spread sheets: MLE and EAP in Additional file 1 and eap in Additional file 2).
We used CAT stop rules, e.g., when person reliability reaches 0.90 (= [1−SEMpi] [3], where SEMpi= person standard error of measurement on item i = 1/varian-cepi= 1/informationpi), and the last three average con-secutive person estimation change is < 0.05 after the minimal necessarily completed number of items is≥7, as proposed in the study [5].
The MLE, MAP, and EAP CAT algorithms were used to (i) estimate person measures on the three kinds of response datasets, (ii) compute correlation coefficients between esti-mated person measures (a. CADL, CADL_CAT, b. Male ADL, Male ADL_CAT, c. Female ADL, and Female ADL_CAT), (iii) analyze the CAT efficiency of item length shortened by CAT compared with NAT, and, using inde-pendentttests to count differences in ratios < 5 % (iv) test whether the precision was equal to NAT [32].
The cutpoints of ADL person strata determined using a norm-referred method
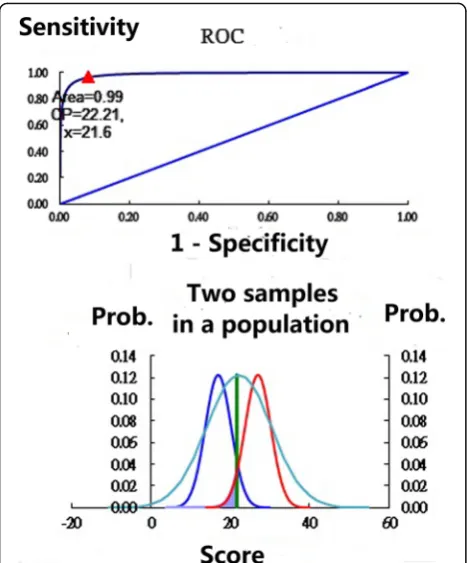
Traditionally in clinical practice, researchers use ROC (receiver operating characteristic) curves to plot the true-positive rate (sensitivity) against the false-positive rate (1−specificity) at various threshold settings [33] (e.g., Fig. 1 with two samples). The preliminary condition is to know the patient’s classification (i.e., stratum) (e.g., separating person ADL function strata with not active, fairly active, active, and very active) before conducting the ROC of any two adjacent samples. Unfortunately, we usually do not know the patient’s true- and false-positive disease-specific status. How to determine the so-called gold standard test (e.g.,a cutting point) is an important issue we face in clinical settings in a bit to identify the degree of patient functional problems.
Fortunately, according to the literature [34–36], as a scale’s reliability (i.e., Cronbach’s α) increases, so does the person-number of ranges that can be confidently distinguished. Person measures with a reliability of 0.67 will tend to classify two groups with 95 % confidence; 0.80 will group three groups; 0.90 will separate four groups; 0.94, within five groups; 0.96, within six groups; 0.97, within seven groups; and so on [37]. Thus, the number of person strata for both CADL and ADL can be divided into four groups because each scale’s reliabil-ity coefficient is greater than 0.90 [5], which is similar to the Turnbull et al. [8] definition of the four strata (Not Active, Fairly Active, Active, and Very Active) for the Frenchay Activities Index.
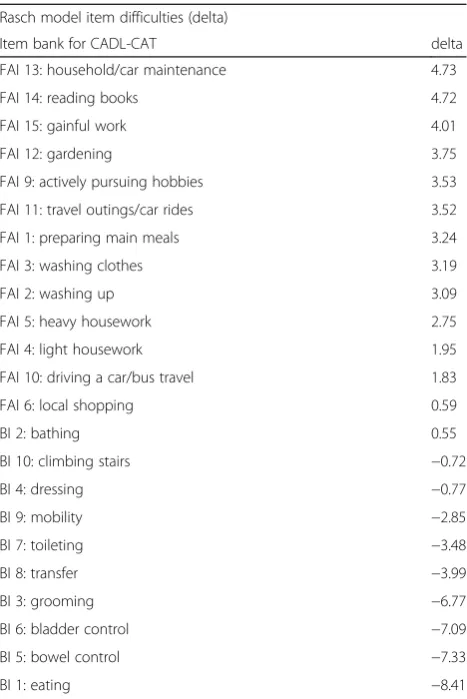
We picked up any two adjacent normal distribution samples using the Microsoft Excel function = NORMDIST Table 2Item bank used for CADL-CAT
Rasch model item difficulties (delta)
Item bank for CADL-CAT delta
FAI 13: household/car maintenance 4.73
FAI 14: reading books 4.72
FAI 15: gainful work 4.01
FAI 12: gardening 3.75
FAI 9: actively pursuing hobbies 3.53
FAI 11: travel outings/car rides 3.52
FAI 1: preparing main meals 3.24
FAI 3: washing clothes 3.19
FAI 2: washing up 3.09
FAI 5: heavy housework 2.75
FAI 4: light housework 1.95
FAI 10: driving a car/bus travel 1.83
FAI 6: local shopping 0.59
BI 2: bathing 0.55
BI 10: climbing stairs −0.72
BI 4: dressing −0.77
BI 9: mobility −2.85
BI 7: toileting −3.48
BI 8: transfer −3.99
BI 3: grooming −6.77
BI 6: bladder control −7.09
BI 5: bowel control −7.33
BI 1: eating −8.41
(mean, standard deviation [SD], TRUE), whereas themean is the cluster center obtained using the k-mean method when the number of strata is known according to the Cronbach’s α scale [34], and the SD is obtained from the individual scores of the specific cluster. Using a brute force search of the two adjacent samples, the cut-point can be determined at the maximal summation of specificity and sensitivity across all possible scores. Interested readers can refer to the Excel spreadsheet homepage_Bin Additional file 1 for detailed information.
An online ADL-CAT assessment APP was designed for use on smart phones
An online routine was designed for patients to report their ADL T scores (mean = 50, SD = 10) that were trans-formed using the formula: (50 + 10 × estimated person measure for cut-points). The three kinds of item pool (Tables 1 and 2) were uploaded to the website. The first CAT item will be randomly selected from the item pool. The next item to be answered is the item with the maximal variance among the remaining items accord-ing to the provisional person ability [21, 38]. For the detailed item selection rules, interested readers can see Additional file 3 on the Excel VBA codes. All the re-sponses will be automatically saved on the study web-site (see the spreadsheet reply in Additional file 4).
Statistical tools and data analyses
SPSS 15.0 for Windows (SPSS Inc., Chicago, IL) and MedCalc 9.5.0.0 for Windows (MedCalc Software, Mar-iakerke, Belgium) were used to calculate (1) Cronbach’s
α, (2) dimension coefficients (DCs) [39], and (3) residual DCs [39] on the three kinds of response datasets as well as (4) correlation coefficients between estimated person measures for CAT and NAT. Independent t tests were used to compare (5) the ratios of the different paired person measures and to determine (6) cutpoints at max-imal summations of specificity and sensitivity for each person stratum when strata central points were deter-mined using k-mean cluster analysis.
Results
Task 1: CAT precision and efficiency compared using three estimation methods
The three coefficients (i.e., Cronbach’s α [DC, residual DC]) were 0.61[0.67, 0.49] for the 23-item CADL, 0.90 [0.80, 0.50] for the Male ADL, and 0.90 [0.74, 0.48] for the Female ADL (Table 3), which indicated that these three simulated datasets were unidimensional (i.e., DC ≥0.67 and residual DC≤0.56) [39].
The correlation coefficient between person-estimated measures of CAT and NAT using the MAP method was 0.77 for the CADL, 0.93 for the Male ADL, and 0.93 for the Female ADL, not significantly different from the 0.76, 0.95, and 0.97, respectively, using EAP and MLE) (Table 3).
The differences in the number ratios between the mea-sures of CAT and NAT using the three estimation methods were all less than 5 %. The item lengths were shorter (Fig. 2). Using CAT, almost 62 % (= [34–13] = 21/34) of the item lengths were shortened. The largest number of items consumed by CAT was when using the MLE method, because it is relatively unbiased and has a well-designed item pool, but it also has a large standard error (SE) relative to the Bayesian MAP and MLE methods [26].
Task 2: Cutpoints of CADL and ADL
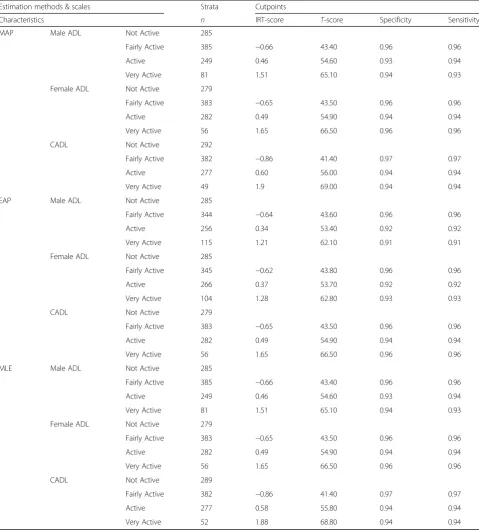
Cutpoints for CADL were 42, 56, and 69; and for ADL were 43, 55, and 65 for males, and 43, 55, and 67 for females. For simplicity, the T scores of cutpoints sug-gested were at 45, 55, and 65. A four-person stratifica-tion (e.g., separating person ADL funcstratifica-tion strata with not active, fairly active, active, and very active) can be well separated (Table 4). All values of specificity and sen-sitivity were greater than 0.90 (Table 4).
Task 3: Online ADL CAT assessment
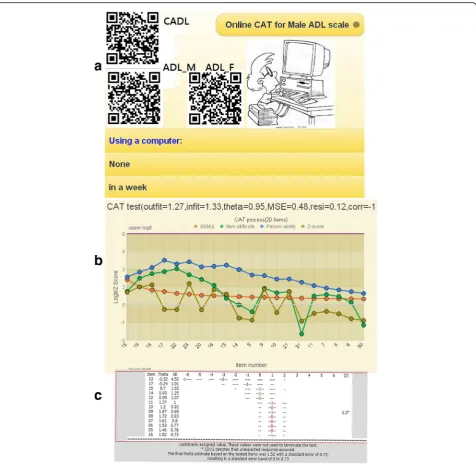
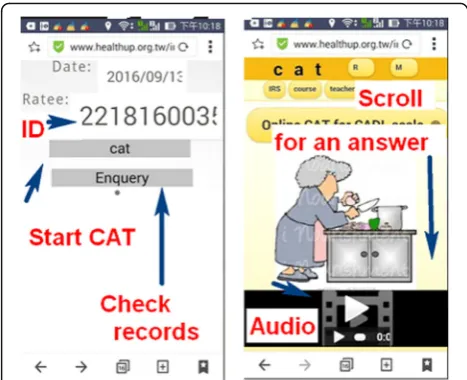
By scanning a QR-code (Fig. 3a, top left) which encapsu-lates an appropriate patient ID, the selected ADL CAT appears on the smartphone (left in Fig. 4). We developed
a mobile CAT survey procedure to demonstrate practically the newly designed GPCM-type CAT application in action. The CAT processed each ADL item-by-item (Fig. 3b, c). Person fit (i.e., infit and outfit mean-squared error [MNSQ]) statistics showed the respondent behaviors. Person theta is the provisional ability estimated by the CAT module. The MSE in Fig. 3c was generated by this formula:
1=√ðΣinformation ið ÞÞ;
where i refers to the finished CAT items responded to by a CAT user [40]. In addition, the resi in Fig.3bis the average of the last 3 change differences between the pre-and-post estimated abilities on each CAT step. CAT will stop if the resi value is < 0.05. The corr refers to the cor-relation coefficient between the CAT estimated mea-sures and its step series numbers using the last 5 estimated theta (= person measure) values. The flatter the theta trend, the higher the probability that the per-son measure is convergent with a final estimation.
Discussion
Key findings
Using three CAT estimation methods shows that (i) both CAT and NAT person scores have high correlation coef-ficients and low different number ratios for the three scales(i.e., all less than 5 %, indicating no difference ex-ists between CAT and NAT), and that the item length is shorter than that of the NAT scores on both the CADL scale and the ADL scale. This implies that CAT is more efficient than NAT without compromising its precision. (ii) The T scores of cutpoints were determined with high specificity and sensitivity (> 0.90), and were suggested at 45, 55, and 65 to separate person ADL function strata withnot active, fairly active,active, andvery active. (iii) An online ADL-CAT graphical representation for smart phones is feasible for classifying ADL strata in patients who have had a stroke.
What this adds to what was known
Our findings in Task 1 (to compare CAT precision and efficiency) are consistent with the literature [2, 5, 21, 22, 38, 41], and they support the notion that CAT is more efficient than NAT. We confirmed that GPCM-type ADL CAT (i.e., in contrast to CADL-CAT [2, 7], which uses dichotomous Rasch models) similarly requires sig-nificantly fewer items for person measures than does NAT, but does not compromise precision of measure-ment. A clinically useful mobile online assessment APP can be developed for smartphones.
IRT-based CAT is generally different from the trad-itional pen-and-pencil test for which all items are an-swered while providing little information to use for
Fig. 2Item length consumed by CAT estimation methods on study scales
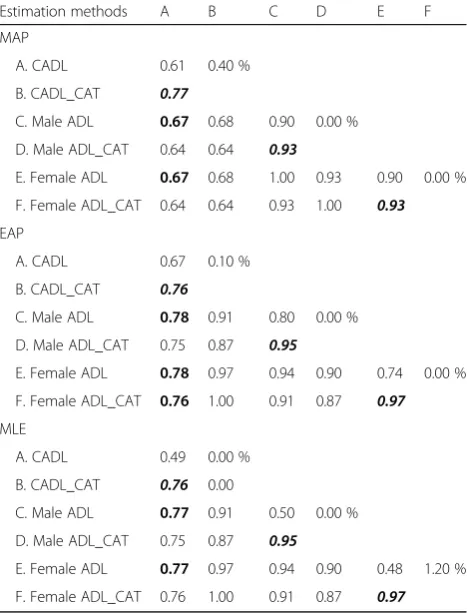
Table 3Correlation coefficients (left lower triangle) and different number ratios (right upper triangle) between scales’ estimated measures
Estimation methods A B C D E F
MAP
A. CADL 0.61 0.40 %
B. CADL_CAT 0.77
C. Male ADL 0.67 0.68 0.90 0.00 %
D. Male ADL_CAT 0.64 0.64 0.93
E. Female ADL 0.67 0.68 1.00 0.93 0.90 0.00 %
F. Female ADL_CAT 0.64 0.64 0.93 1.00 0.93
EAP
A. CADL 0.67 0.10 %
B. CADL_CAT 0.76
C. Male ADL 0.78 0.91 0.80 0.00 %
D. Male ADL_CAT 0.75 0.87 0.95
E. Female ADL 0.78 0.97 0.94 0.90 0.74 0.00 %
F. Female ADL_CAT 0.76 1.00 0.91 0.87 0.97
MLE
A. CADL 0.49 0.00 %
B. CADL_CAT 0.76 0.00
C. Male ADL 0.77 0.91 0.50 0.00 %
D. Male ADL_CAT 0.75 0.87 0.95
E. Female ADL 0.77 0.97 0.94 0.90 0.48 1.20 %
F. Female ADL_CAT 0.76 1.00 0.91 0.87 0.97
ADL-CATactivities of daily living-Computerized Adaptive Testing,CADL
comprehensive activities of daily living-Computerized Adaptive Testing,
MLEmaximum likelihood estimation,EAPexpecteda posterioriestimation,
MAPmaximuma posterioriestimation
Scale reliability coefficients shown on the diagonal line from left to right in the upper MAP table; dimension coefficients displayed in the middle EAP table; model’s residual dimension coefficients displayed in the bottom MLE table
analyzing the CAT users’responses. For instance, out-fit MNSQ values of ≥2.0 can be a threshold when examining whether patient responses are distorted or abnormal, i.e., whether many responses unexpectedly do not fit the model’s requirements and are deemed
highly possibly careless, mistaken, cheating, or awk-ward [2, 21, 42] (e.g., the outfit MNSQ of 1.27 is shown as controllable, and an unexpected response shows an asterisk (*) on the |Z| column in Fig. 3 if |Z|≥2.0). This is another advantage of IRT over the Table 4Determination of cutpoints for the ADL scales
Estimation methods & scales Strata Cutpoints
Characteristics n IRT-score T-score Specificity Sensitivity
MAP Male ADL Not Active 285
Fairly Active 385 −0.66 43.40 0.96 0.96
Active 249 0.46 54.60 0.93 0.94
Very Active 81 1.51 65.10 0.94 0.93
Female ADL Not Active 279
Fairly Active 383 −0.65 43.50 0.96 0.96
Active 282 0.49 54.90 0.94 0.94
Very Active 56 1.65 66.50 0.96 0.96
CADL Not Active 292
Fairly Active 382 −0.86 41.40 0.97 0.97
Active 277 0.60 56.00 0.94 0.94
Very Active 49 1.9 69.00 0.94 0.94
EAP Male ADL Not Active 285
Fairly Active 344 −0.64 43.60 0.96 0.96
Active 256 0.34 53.40 0.92 0.92
Very Active 115 1.21 62.10 0.91 0.91
Female ADL Not Active 285
Fairly Active 345 −0.62 43.80 0.96 0.96
Active 266 0.37 53.70 0.92 0.92
Very Active 104 1.28 62.80 0.93 0.93
CADL Not Active 279
Fairly Active 383 −0.65 43.50 0.96 0.96
Active 282 0.49 54.90 0.94 0.94
Very Active 56 1.65 66.50 0.96 0.96
MLE Male ADL Not Active 285
Fairly Active 385 −0.66 43.40 0.96 0.96
Active 249 0.46 54.60 0.93 0.94
Very Active 81 1.51 65.10 0.94 0.93
Female ADL Not Active 279
Fairly Active 383 −0.65 43.50 0.96 0.96
Active 282 0.49 54.90 0.94 0.94
Very Active 56 1.65 66.50 0.96 0.96
CADL Not Active 289
Fairly Active 382 −0.86 41.40 0.97 0.97
Active 277 0.58 55.80 0.94 0.94
Very Active 52 1.88 68.80 0.94 0.94
IRTItem response theory,ADL-CATactivities of daily living-Computerized Adaptive Testing,CADLcomprehensive activities of daily living-Computerized Adaptive Testing,MLEmaximum likelihood estimation,EAP, expecteda posterioriestimation,MAP, maximuma posterioriestimation
traditional classic test theory (CTT): it gives more use-ful information to readers. In addition, any signifi-cantly aberrant or cheating behavior on CAT will be detected and found by the CAT module algorithm.
What it implies and what should be changed
We have provided a way to determine the cutpoints of ADL person strata using a norm-referred method in Task 2. It is because we usually do not know the pa-tient’s true- and false-positive status unless we have ap-plied the so-called gold standard test (i.e., the cutpoint) before the study. Many studies in their Limitations
sections caution that their results cannot be generalized to other workplace sites or to other types of patients.
The norm-referred method was thus introduced in this study based on suggestions found in the literature [34–37]. That is to determine the cutpoints of ADL person strata through following stages: Calculating Cronbach’s Alpha of the scale →Computing the num-ber of person strata → Grouping members in each cluster using K-mean statistics → Obtaining means and standard errors for each cluster → Determining cutpoints for each threshold of the sample →Inferring cutpoints to the population.
When we know the means and standard deviations of any two adjacent groups, the cutpoints of person strata can be then determined by using a norm referred method, whereas means are obtained from K-mean clus-ter analysis, standard deviations are yielded from data of the specific group. The illustration can be seen in work-sheet Ch09 in Additional file 1. Through which, the yielded cutpoints can be theoretically generalized to other healthcare sites and other samples when we do not have any idea about the patient’s true- and false-positive disease-specific status.
TheTscores of cutpoints were then determined. Inter-ested readers are recommended to read Additional file 1 for the detailed calculation and method. Future studies are suggested to use the way to determine cutpoints of malfunction on other clinical functional scales [2–7].
Strengths of this study
There are two major forms of standardized assessments in clinical settings [43]: (i) a lengthy questionnaire and (ii) a rapid short-form scale [44, 45]. Each has its advan-tages and drawbacks. However, traditional question-naires have a large respondent burden because they require patients to answer questions that do not provide any information for the patient estimation [17]. How-ever, we have not seen any online CAT that can be used for smartphones and are suitable for using with MLE, MAP, or EAP on internet.
It is very easy to set up any form (e.g., Rasch partial credit model [PCM] [23] or generalized partial credit model [GPCM] [24]) of online CAT assessment if the designer uploads relevant parameters into the database (e.g., definitions about the type of IRT model; threshold difficulties; the number of questions in the item bank,
test, or questionnaire, whether to show plots; etc.). CAT users may expand the item pool or use them in other kinds of scales. It must be said that (i) item overall (i.e., on average) and step (threshold) difficulties of the ques-tionnaire must be calibrated in advance using an IRT model, (ii) pictures and the corresponding audio files used for the subject or response categories for each question should be well-prepared with a web link that can be shown simultaneously with the item appearing in the animation module of CAT, and (iii) the mobile on-line CAT can be used for many kinds of ITR-based models. The correct parameters corresponding to the exact fields of the database need to be uploaded.
As with all forms of web-based technology, advances in mobile health (mHealth) and health communication technology are rapid [45]. Mobile online CAT is promis-ing and worth promotpromis-ing the patients' health literacy [46–49]. Interested readers are recommended to see Additional file 4 for the data layout of the online CAT format.
Limitations and future studies
Our study has some limitations. First, although we, like Hsueh et al. [5], believe that all patients’true scores fol-low a normal distribution, there is no evidence to sup-port our assumption in clinical practice, which might influence the determination of cutpoints for the scales. It means that more than one statum is required if data are not normal distributed [37]. We recommend add-itional studies using other kinds of sample distributions to see whether different cutpoints are arrived at.
Second, although the scale’s Cronbach’s α coefficients were 0.94 for CADL [7] and 0.93 for ADL [5], we con-servatively and consistently determined that all the scales’ person strata were four instead of five when Cronbach’s α for CADL reached 0.94 [33] because it is convenient and easy to remember the ADL cutpoints at theTscores of 45, 55, and 65.
Third, the study was based on a previously published paper [5]. All of the data were sampled from those re-leased parameters. If any one set (either item or person parameters) were incorrect, the randomized response pattern would be different from the real world. That is, parameters from outpatients living in the community will be different from those of inpatients in a hospital, and those from patients in the chronic stage of stroke will be different from those with other diseases. Usually, the BADL items compared with IADL items are more appropriate for inpatients. The generalizing these ADL-CAT findings might be somewhat limited because of the sample consisted only of inpatients. Additional studies are needed to reexamine whether the psychometric properties of the ADL-CAT suitable only for inpatients,
only for patients living in long-term care facilities, or for both.
Fourth, the original ADL-CAT paper assessed gender as a differential item functioning (DIF) factor [50], and proposed two kinds of ADL for males and females, which were used in this study. Thus, the item parame-ters might be affected by DIF detection for other groups (e.g., living situation).
Conclusions
We found that ADL-CAT is efficient, reliable, and valid. The online ADL-CAT module used for smartphones is promising for assessing the full spectrum of ADL func-tions in outpatients with stroke. The visualized presenta-tion of the ADL-CAT module shows that it is feasible for helping both physicians and patients in clinical settings.
Additional files
Additional file 1:The algorithm for determining Cutpoints and simulating data using MS Excel. (XLS 2362 kb)
Additional file 2:A CAT module in MS Excel. (XLS 6542 kb)
Additional file 3:Comprehensive overview of Rasch models and the CAT process. (PDF 405 kb)
Additional file 4:The file layouts of data used for gathering feedback from patients using online CAT. (XLS 58 kb)
Abbreviations
ADL:activities of daily living; APP: application; BI: Barthel Index; CADL: comprehensive ADL; CAT: computer adaptive testing; CTT: classic test theory; DC: dimension coefficients; DIF: differential item functioning; EAP: expected a posteriori; FAI: Frenchay Activities Index; GPCM: generalized partial credit model; IRT: Item response theory; MAP: maximum a posteriori; MLE: maximum likelihood estimation; MNSQ: mean-square; MSE: mean-squared error; NAT: Non-Adaptive Testing; PCM: partial credit model; ROC: receiver operating characteristic; SD: standard deviation; SE: standard error; SEM: standard error measurement; VBA: Visual Basic for Applications
Acknowledgements
We thank Frank Bill who provided medical writing services to the manuscript.
Funding
There are no sources of funding to be declared.
Availability of data and materials
This research is based on a simulation study. All codes and data can be obtained from those in additional supporting files of this study.
Authors’contributions
TWC developed the study concept and design. TWC and WSL analyzed and interpreted the data. TWC drafted the manuscript, and all authors provided critical revisions for important intellectual content. The study was supervised by TWC. All authors have read and approved the final manuscript.
Authors’information
TWC is an assistant professor at ChiMei Medical Center, Taiwan. He is an expert in computer science and Rasch modelling, mainly in the field of data analysis using statistical technique. WSL is a statistical expert with PhD working at Chia-Nan University of Pharmacy and Science, Tainan, Taiwan.
Competing interests
The authors declare that they have no competing interests.
Consent for publication Not applicable.
Ethics approval and consent to participate Not applicable.
Author details
1Research Department, Chi-Mei Medical Center, Tainan, Taiwan.2Department of Hospital and Health Care Administration, Chia-Nan University of Pharmacy and Science, Tainan, Taiwan.3Chi-Mei Medical Center, 901 Chung Hwa Road, Yung Kung Dist, Tainan 710, Taiwan.
Received: 15 September 2016 Accepted: 4 October 2016
References
1. Jette AM, Cleary PD. Functional disability assessment. Phys Ther. 1987;67: 1864–59.
2. Chien TW, Wu HM, Wang WC, Castillo RV, Chou W. Reduction in patient burdens with graphical computerized adaptive testing on the ADL scale: Tool development and simulation. Health Qual Life Outcomes. 2009;7:39. 3. Mahoney F, Barthel D. Functional evaluation: the Barthel Index. Md State
Med J. 1965;14:61–5.
4. Wang CY, Hsieh CL, Olson SL, Wang CH, Sheu CF, Liang CC. Psychometric properties of the Berg Balance Scale in a community-dwelling elderly resident population in Taiwan. J Formos Med Assoc. 2006;105(12):992–1000. 5. Hsueh IP, Chen JH, Wang CH, Hou WH, Hsieh CL. Development of a
computerized adaptive test for assessing activities of daily living in outpatients with stroke. Phys Ther. 2013;93(5):681–774.
6. Mahoney FI, Barthel DW. Functional evaluation: the Barthel Index. Md State Med J. 1965;14:61–5.
7. Hsueh IP, Wang WC, Sheu CF, Hsieh CL. Rasch analysis of combining two indices to assess comprehensive ADL function in stroke patients. Stroke. 2004;35:721–6.
8. Turnbull JC, Kersten P, Habib M, McLellan L, Mullee MA, George S. Validation of the Frenchay Activities Index in a general population aged 16 years and older. Arch Phys Med Rehabil. 2000;81(8):1034–42.
9. Hsueh IP, Lin JH, Jeng JS, Hsieh CL. Comparison of the psychometric characteristics of the Functional Independence Measure, 5-item Barthel Index, and 10-item Barthel Index in patients with stroke. J Neurol Neurosurg Psychiatry. 2002;73:188–90.
10. Hsueh IP, Huang SL, Chen MH, et al. Evaluation of stroke patients with the Extended Activities of Daily Living Scale in Taiwan. Disabil Rehabil. 2000;22: 495–500.
11. Spector WD, Fleishman JA. Combining activities of daily living with instrumental activities of daily living to measure functional disability. J Gerontol Soc Sci. 1998;53B(1):S46–S57.
12. Holbrook M, Skilbeck CE. An activities index for use with stroke patients. Age Ageing. 1983;12:166–70.
13. Hsieh CL, Hsueh IP. A cross-validation of the comprehensive assessment of activities of daily living after stroke. Scand J Rehabil Med. 1999;31:83–8. 14. Pedersen PM, Jorgensen HS, Nakayama H, et al. Comprehensive assessment
of activities of daily living in stroke: the Copenhagen Stroke Study. Arch Phys Med Rehabil. 1997;78:161–5.
15. Huybrechts KF, Caro JJ. The Barthel Index and modified Rankin Scale as prognostic tools for long-term outcomes after stroke: a qualitative review of the literature. Curr Med Res Opin. 2007;23:1627–36.
16. Schuling J, de Haan R, Limburg M, Groenier KH. The Frenchay Activities Index: assessment of functional status in stroke patients. Stroke. 1993;24: 1173–7.
17. Mitchel SJ, Godoy L, Shabazz K, Horn IB. Internet and mobile technology use among urban African American parents: survey study of a clinical population. J Med Internet Res. 2014;16(1), e9.
18. De Beurs DP, de Vries AL, de Groot MH, de Keijser J, Kerkhof AJ. Applying computer adaptive testing to optimize online assessment of suicidal behavior: A simulation study. J Med Internet Res. 2014;16(9), e207. 19. Hsueh IP, Chen JH, Wang CH, et al. Development of a computerized
20. Tulsky DS, Kisala PA, Victorson D, et al. Developing a contemporary patient-reported outcomes measure for spinal cord injury. Arch Phys Med Rehabil. 2011;92:S44–51.
21. Lehman LA, Woodbury M, Shechtman O, et al. Development of an item bank for a computerised adaptive test of upper-extremity function. Disabil Rehabil. 2011;33:2092–104.
22. Chien TW, Wang WC, Huang SY, Lai WP, Chou JC. A web-based computerized adaptive testing (CAT) to assess patient perception of hospitalization. J Med Internet Res. 2011;13(3), e61.
23. Ma SC, Chien TW, Wang HH, Li YC, Yui MS. Applying computerized adaptive testing to the negative acts questionnaire-revised: Rasch analysis of workplace bullying. J Med Internet Res. 2014;16(2), e50.
24. Masters GN. A Rasch model for partial credit scoring. Psychometrika. 1982; 47:149–74.
25. Muraki E. A generalized partial credit model: Application of an EM algorithm. Appl Psychol Meas. 1992;16:159–76.
26. Birnbaum A. Some latent ability models and their use in inferring an examinee's ability. In: Lord FM, Novick MR, Birnbaum A, editors. Statistical Theories of Mental Test Scores. Reading: Addison-Wesley; 1968. 27. Bock RD, Aitken M. Marginal maximum likelihood estimation of item
parameters: Application of an EM algorithm. Psychometrika. 1981;46:443–459.28. 28. Bock RD, Mislevy RJ. Adaptive EAP estimation of ability in a microcomputer
environment. Appl Psychol Meas. 1982;6:431–444.28.
29. Samejima F. Estimation of latent ability using a response pattern of graded scores. Psychometrika Monograph Supplement. NO. 17. 1969.
30. Han KT. WinGen: Windows software that generates IRT parameters and item responses. Appl Psychol Meas. 2007;31(5):457–9.
31. Linacre JM. How to simulate Rasch data. Rasch Meas Trans. 2007;21(3):1125. 32. Smith Jr EV. Detecting and evaluating the impact of multidimensionality
using item fit statistics and principal component analysis of residuals. J Appl Meas. 2002;3(2):205–31.
33. Carsten S, Wesseling S, Schink T, Jung K. Comparison of eight computer programs for receiver-operating characteristic analysis. Clin Chem. 2003;49:433–9. 34. Fisher Jr W. Reliability, separation, strata statistics. Rasch Meas Trans. 1992;
6(3):238.
35. Wright BD, Masters GN. Number of person or item strata. Rasch Meas Trans. 2002;16(3):888.
36. Wright BD. Reliability and separation. Rasch Meas Trans. 1996;9(4):472. 37. Fisher Jr WP. The cash value of reliability. Rasch Meas Trans. 2008;22(1):1160–3. 38. Embretson SE, Reise SP. Measuring persons: Scoring examinees with IRT
models. In: Embretson SE, Reise SP, editors. Item Response Theory for Psychologists. Chapter 7. Mahwah: Erlbaum; 2000: p. 158–186.37. 39. Chien TW. Cronbach’s alpha with the dimension coefficient to jointly assess
a scale’s quality. Rasch Meas Trans. 2012;26(3):1379.
40. Linacre JM. Computer-adaptive tests (CAT), standard errors and stopping rules. Rasch Meas Trans. 2006;20(2):1062.
41. Wainer HW, Dorans NJ, Flaugher R, Green BF, Mislevy RJ, Steinberg L, Thissen D. Computerized Adaptive Testing: A Primer. Hillsdale: Erlbaum; 1990. 42. Linacre JM. Optimizing rating scale category effectiveness. J Appl Meas.
2002;3(1):85–106.
43. Eack SM, Singer JB, Greeno CG. Screening for anxiety and depression in community mental health: The Beck Anxiety and Depression inventories. Community Ment Health J. 2008;44(6):465–74.
44. Ramirez Basco M, Bostic JQ, Davies D, et al. Methods to improve diagnostic accuracy in a community mental health setting. Am J Psychiatry. 2000; 157(10):1599–605.
45. Shear MK, Greeno C, Kang J, et al. Diagnosis of nonpsychotic patients in community clinics. Am J Psychiatry. 2000;157(4):581–7.
46. Williams MV, Davis T, Parker RM, Weiss BD. The role of health literacy in patient-physician communication. Fam Med. 2002;34(5):383–9.
47. Lee HY, Rhee TG, Kim NK.Cancer literacy as a mediator for cancer screening behaviour in Korean adults. Health Soc Care Community 2015 [Epub ahead of print].
48. Kim K, Han HR. Potential links between health literacy and cervical cancer screening behaviors: a systematic review. Psychooncology. 2015 [Epub ahead of print].
49. Cutilli CC, Bennett IM. Understanding the Health Literacy of America Results of the National Assessment of Adult Literacy. Orthop Nurs. 2009;28(1):27–34. 50. Holland PW, Thayer DT. Differential item performance and the
Mantel-Haenszel procedure. In: Wainer H, Braun HI, editors. Test validity. Hillsdale: Erlbaum; 1988. p. 129–45.
• We accept pre-submission inquiries
• Our selector tool helps you to find the most relevant journal
• We provide round the clock customer support
• Convenient online submission
• Thorough peer review
• Inclusion in PubMed and all major indexing services
• Maximum visibility for your research
Submit your manuscript at www.biomedcentral.com/submit