R E S E A R C H A R T I C L E
Open Access
Electrical conductivity-based contrast
imaging for characterizing prostatic tissues:
in vivo animal feasibility study
Yong Soo Cho
1†, Young Hoe Hur
2†, Hyun Ju Seon
1, Jin Woong Kim
1*and Hyung Joong Kim
3*Abstract
Background:Electrical conductivity-based magnetic resonance (MR) imaging may provide unique information on tissue condition because its contrast originates from the concentration and mobility of ions in the cellular space. We imaged the conductivity of normal canine prostate in vivo and evaluated tissue contrast in terms of both the conductivity distribution and anatomical significance.
Methods:Five healthy laboratory beagles were used. After clipping the pelvis hair, we attached electrodes and placed each dog inside the bore of an MRI scanner. During MR scanning, we injected imaging currents into two mutually orthogonal directions between two pairs of electrodes. A multi spin echo pulse sequence was used to obtain the MR magnitude and magnetic flux density images. The projected current density algorithm was used to reconstruct the conductivity image.
Results:Conductivity images showed unique contrast depending on the prostatic tissues. From the conductivity distribution, conductivity was highest in the center area and lower in the order of the middle and outer areas of prostatic tissues. The middle and outer areas were, respectively, 11.2 and 25.5% lower than the center area. Considering anatomical significance, conductivity was highest in the central zone and lower in the order of the transitional and peripheral zones in all prostates. The transitional and peripheral zones were, respectively, 7.5 and 17.8% lower than the central zone.
Conclusions:Current conductivity-based MR imaging can differentiate prostatic tissues without using any contrast media or additional MR scans. The electrical conductivity images with unique contrast to tissue condition can provide a prior information on tissues in situ to be used for human imaging.
Keywords:Electrical conductivity, Magnetic resonance imaging, Prostate, Central zone, Peripheral zone
Background
Prostate cancer and benign prostatic hyperplasia are the most common diseases and significant causes of death for older adult men [1]. The morphological and func-tional examinations are widely used to characterize the tissue properties of prostatic diseases [2,3]. The prostate gland can be divided into the central area and peripheral
area [4]. The central area consists of the central and transitional zones. The peripheral area consists of the peripheral zone and a small amount of anterior fibro-muscular stroma without glandular tissue. There exist differences in volume, tissue composition, and incidence of prostatic diseases among the three zones [4,5]. Speci-cally, the incidence of prostate cancers and prostatitis is higher in the peripheral zone than in the other zones. Therefore, image-based qualitative and quantitative in-formation on prostatic tissues can provide a prior know-ledge of the zonal information with prostatic diseases.
The prostate is an imaging area of growing concern re-lated with aging. Although prostate cancer is a common cancer in older adult men, imaging diagnosis in detection
© The Author(s). 2019Open AccessThis article is distributed under the terms of the Creative Commons Attribution 4.0 International License (http://creativecommons.org/licenses/by/4.0/), which permits unrestricted use, distribution, and reproduction in any medium, provided you give appropriate credit to the original author(s) and the source, provide a link to the Creative Commons license, and indicate if changes were made. The Creative Commons Public Domain Dedication waiver (http://creativecommons.org/publicdomain/zero/1.0/) applies to the data made available in this article, unless otherwise stated.
* Correspondence:[email protected];[email protected]
†Yong Soo Cho and Young Hoe Hur contributed equally to this work.
1Department of Radiology, Chosun University Hospital and Chosun University
College of Medicine, 365 Pilmun-daero, Dong-gu, Gwangju 61453, South Korea
3Department of Biomedical Engineering, Kyung Hee University, 23
and localization of prostate cancer remains challenging compared with other abdominopelvic cancers [6]. Among imaging modalities, magnetic resonance imaging (MRI) is a powerful tool for visualizing tissue conditions because of its excellent soft tissue contrast by various imaging param-eters [7]. In general, T2-weighted MR imaging provides enough contrast on zonal information, but tumor localization is limited and prostate biopsy is mandatory to diagnose prostate cancer. Recently, the introduction of a multi-parametric MR imaging method, which is a combin-ation of dynamic contrast-enhanced MRI and diffusion-weighted imaging and MR spectroscopy, has improved the diagnostic accuracy in prostatic diseases [6]. The multi-parametric MR imaging is used for assessing intraprostatic diseases, while positron emission tomography (PET) has advantage in the detection of extraprostatic diseases [8]. Despite these technical advances, there still exist difficul-ties in tumor diagnosis and the assessment of treatment response after hormonal or radiation therapy. Thus, pros-tate biopsy is performed in almost all patients with sus-pected prostate cancer [6,9]. New imaging techniques are being studied to improve the diagnosis and monitor the treatment response in patients with prostate cancer.
MR-based tissue property mapping is an emerging tech-nique that uses an MR scanner to obtain non-invasive infor-mation concerning electrical tissue properties such as conductivity and permittivity [10–12]. Such electrical tissue properties provide alternative information on tissue struc-ture and function, and can serve as a good complement to the information provided by traditional MRI methods [13– 15]. Several studies reported the electrical properties of the prostatic tissues by measuring its values in vitro or ex vivo [16], but no in vivo imaging study can non-invasively pro-vide information on the tissue condition in situ. The recent magnetic resonance electrical impedance tomography (MREIT) method enables high-resolution imaging of elec-trical conductivity by the externally injected currents [12, 14, 17]. The electrical conductivity of biological tissues is primarily determined by the concentration and mobility of ions that exist in the intra- and extracellular structures [17, 18]. The electrical conductivity contrast is closely related to the structural and functional conditions of tissues and or-gans [11, 12, 17,18]. Therefore, the electrical conductivity has potential to provide direct information on the micro-scopic structures that can be represented as a macromicro-scopic images with novel contrast.
The purpose of this study was to show the feasibility of in vivo conductivity imaging of the prostate, which can provide novel contrast on the tissue condition relating to the zonal information. From the normal canine prostate, we imaged in vivo electrical conductivity of prostatic tis-sues and measured its values in terms of both the con-ductivity distribution and anatomical significance to quantitatively distinguish the tissue condition.
Methods
Animal preparation
Five healthy laboratory beagles (2–5 years old, weighing 5–13 kg; Harlan Interfauna, Huntingdon, Cambridgeshire, UK) were used for imaging experiments. All experimental protocols were performed in accordance with the regula-tions of the Institutional Animal Care and Use Committee (IACUC), and were approved by the Ethics Committee of Kyung Hee University, Korea (No. KHUASP-14-25). All were healthy without a history of any known disease or signs of metabolic and neurological problems. We injected 0.1 mg/kg of atropine sulfate to prevent the dog from sali-vating during the experiments. Ten minutes later, we anesthetized the dog with an intramuscular injection of 0.2 ml/kg Tiletamine and Zolazepam (Zoletil 50, Virbac, France). After clipping and shaving the hair at four loca-tions on the pelvis, we attached four carbon-hydrogel elec-trodes (HUREV Co. Ltd., Korea) and placed the dog inside the bore of a 3 T MRI scanner (Achieva TX, Philips, Amsterdam, the Netherlands) (Fig. 1). Inside the MR scanner, we intubated the dog using an endotracheal tube and began general anesthesia using a veterinary anesthesia system (VME, MATRX, USA). We used 2% isoflurane mixed with oxygen at 800 ml/min flow rate. Ventilation was machine-controlled using a ventilator (M-2002, Hal-lowell EMC, USA) at a respiration rate of 15 bpm and tidal volume of 200 ml.
Imaging experiment
Anatomical T1-weighted, T2-weighted MR images were obtained to confirm the morphological information of the canine pelvis. For the electrical conductivity images of the in vivo prostate, a multi-echo spin echo pulse se-quence was used to simultaneously obtain the MR mag-nitude and magnetic flux density (Bz) images [17]. The imaging parameters were as follows; TR/TE = 900/15, 30, 45 ms (3 echoes), FOV = 220 × 220 mm2, slice thick-ness = 3 mm, NEX = 8, matrix size = 128 × 128, number of slices = 6, and total imaging time = 40 min. During MR scanning, the first current I1 was injected between one opposing pair of electrodes using a constant current source. The injected current was 5 mA amplitude and a total pulse width of 81 ms. After acquiring the first mag-netic flux density (Bz) dataset forI1, the second injection currentI2with the same amplitude and pulse width was injected through the other pair of opposing electrodes to obtain the second dataset. After imaging experiments, dogs were euthanized with sodium pentobarbital (80 mg/kg IV; Entobar Injection, Hanrim Pharm, Gyeonggi, South Korea) [19].
Conductivity image reconstruction and data analysis The raw data was extracted from the MR spectrometer after finishing the imaging experiments. To reconstruct electrical
conductivity images of the canine pelvis, the magnetic flux densities were generated by removing the effects of injected current at raw datasets. Specifically, the magnetic flux density information was determined by subtracting the two datasets with positive and negative currents. And the final low-frequency conductivity was reconstructed from the measured magnetic flux density by applying the projected current dens-ity method [20]. The detailed image reconstruction for con-ductivity was described in the work of Sajib et al [21]. The quantitative analysis was performed on the results from three dogs which covered the entire prostatic tissues such as the central, transitional, and peripheral zones. The
regions-of-interest (ROIs) were positioned at several prostatic tissues by an experienced radiologist and their values were measured from both the signal change in conductivity distribution (Fig.4a) and anatomical significance in T2-weighted MR im-ages (Fig.5a). All values were expressed as means ± standard deviations, and plotted as bar graphs to compare between different prostatic zones.
Results
Electrical conductivity images of prostate
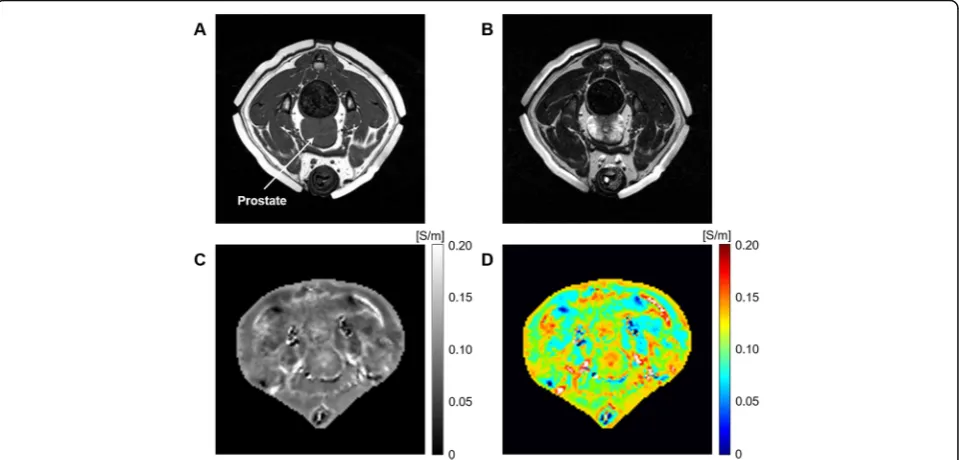
Figure2 shows typical results of electrical conductivity-based MR imaging from an in vivo canine pelvis. The
Fig. 1Experimental setup for electrical conductivity-based MR imaging in a canine pelvis. The imaging objects are located inside the MR scanner and the imaging current is injected into the pelvis through the electrodes during MR scanning
T1- and T2-weighted MR images (Fig.2a and b) indicate the anatomical structures and MR tissue contrast of the canine pelvis. The electrical conductivity and its pseudo color images (Fig.2c and d) show different conductivity contrasts of pelvis regions, including muscles, bones, and adipose tissues. When we focused on the prostate, there was no tissue contrast in the T1-weighted image, but the T2-weighted and electrical conductivity images showed clear contrast between the prostatic tissues. Spe-cifically, the signal intensity of the peripheral area was the highest in the T2-weighted image, but the lowest in the electrical conductivity image. On the contrary, the signal intensity of the central area was the lowest in the T2-weighted image, but the highest in the electrical con-ductivity image.
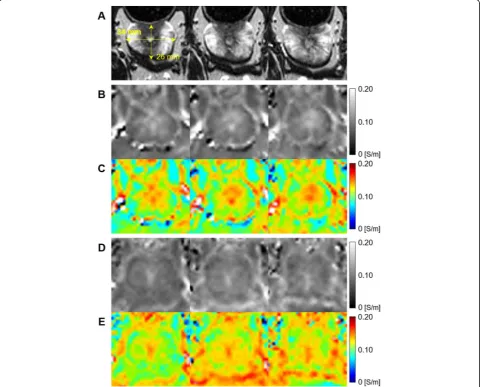
Figure3 shows the electrical conductivity images with three continuous slices from two canine prostates. The anatomical structure and size of the prostate can be
confirmed from the T2-weighted MR images (Fig. 3a). The electrical conductivity (Fig.3b and d) and its pseudo color images (Fig.3c and e) of two prostates showed the unique contrast between the prostatic tissues. The con-ductivity of the central area was higher than that of the peripheral area in all slices.
Prostatic tissue analysis by electrical conductivity
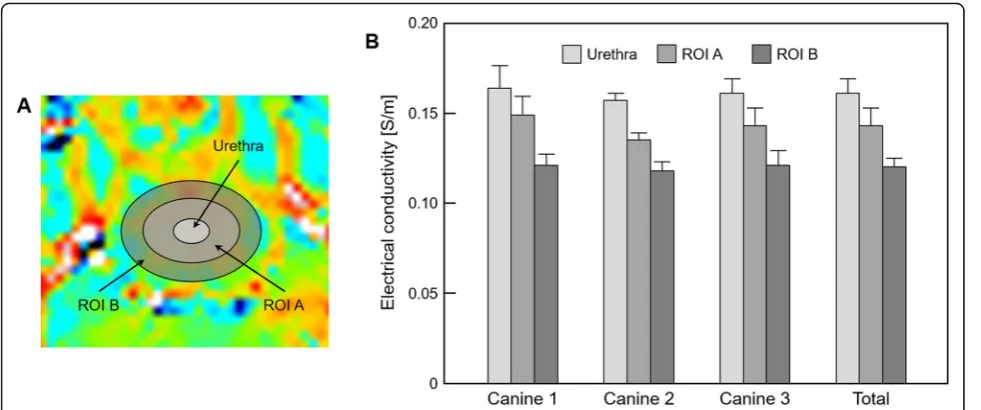
Figure4 and Table1 represent the quantitative analysis of prostatic tissues based on the contrast changes in electrical conductivity images. The regions-of-interest (ROIs) were located and confirmed by an experienced radiologist at three regions, indicating the urethra, ROI A, and ROI B, which are marked in Fig.4a. Most of ROI A covered the central area, while ROI B was the periph-eral area. From the results of three prostates, the con-ductivity was the highest in the urethra and lower in the order of ROI A and ROI B. Specifically, ROI A was
Fig. 3Resulting conductivity images in three continuous slices from two canine prostates.aT2-weighted MR images,bandcreconstructed conductivity and pseudo color images of the first prostate,dandeimages from the second prostate
about 11.2% and ROI B was about 25.5% lower than the conductivity of the urethra (Table1).
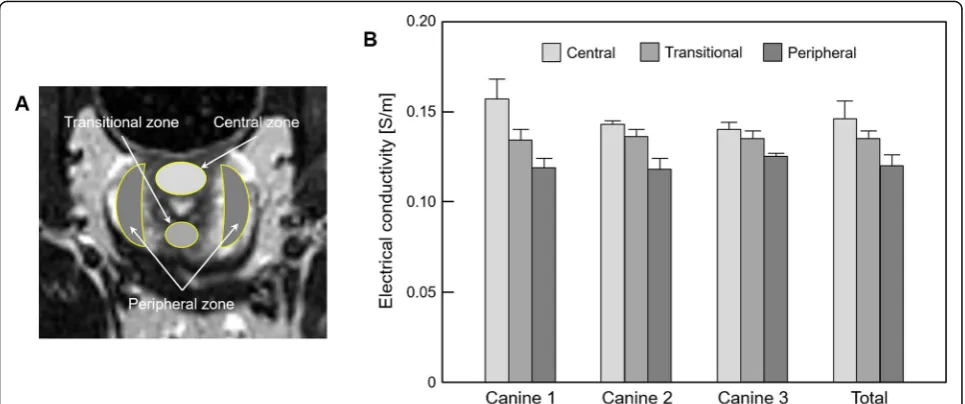
Figure 5 and Table 2 represent the quantitative ana-lysis of prostatic tissues based on the anatomical signifi-cance in the T2-weighted MR image. The ROIs were located and confirmed by an experienced radiologist at three zones, indicating the central, transitional, and per-ipheral zones, which are marked in Fig.5a. The conduct-ivity was the highest in the central zone, while it was the lowest in the peripheral zone in all prostates. Specific-ally, the transitional zone was about 7.5% and peripheral zone was about 17.8% lower than the conductivity of the central zone (Table2).
Discussion
Differences exist in the tissue composition of the various prostate zones, such as the gland (acini) density per zone, and the incidence of prostatic diseases are known to have zonal predilections [5]. The water-rich duct and acini within the peripheral zone are similar to that of central zone. However, the peripheral zone has a larger extracellular space than the central zone because the density of the stroma, which connects between the duct
and acini, is lower in the peripheral zone than in the central zone [4, 5]. Moreover, prostate cancer has a higher density of glandular elements and lesser space of mucin or fluid than a normal prostate gland and benign prostate hyperplasia. This difference in histologic com-position makes prostate cancer different from a normal prostate gland and benign prostate hyperplasia in the prostate. The difference is even more pronounced in the peripheral zone. This cellular environment is one factor for determining electrical tissue conductivity that can be represented as a macroscopic image with novel contrast [18,20,21].
Since the electrical tissue conductivity basically origi-nates from the concentration and mobility of ions in the extra- and intracellular space, image contrast can be interpreted as different tissue conditions in terms of bio-electromagnetics. From the results of the conductivity distribution in prostatic tissues, the conductivity was de-creased in the order of the urethra, ROI A, and ROI B. The high conductivity of the urethra originates from the urethra itself and a certain amount of urine, which con-tains many electrolytes. ROI A and B roughly corres-pond to the central and peripheral areas of the prostate,
Fig. 4Bar graph showing the comparison of prostatic tissues based on the contrast changes in electrical conductivity images.aROIs are located in three prostatic tissues,belectrical conductivity is measured from the corresponding regions
Table 1Measurement of electrical conductivity of prostatic tissues based on the conductivity distribution
Conductivity [S/m] Urethra ROI A ROI B
Canine 1 0.164 ± 0.012 0.149 ± 0.010, (9.1%)a 0.121 ± 0.006, (26.2%)a Canine 2 0.157 ± 0.004 0.135 ± 0.004, (14.0%) 0.118 ± 0.005, (24.8%) Canine 3 0.161 ± 0.008 0.143 ± 0.010, (11.2%) 0.121 ± 0.008, (24.8%) Average 0.161 ± 0.008 0.143 ± 0.010, (11.2%) 0.120 ± 0.005, (25.5%)
Values are presented as mean ± standard deviation
a
respectively. The conductivity of the central area, which consists of central and transition zones, was higher than that of the peripheral area, mostly including the periph-eral zone. This is consistent with the difference in con-ductivity due to the anatomical significances.
From the anatomical zonal analysis, the conductivity was decreased in the order of the central, transitional, and peripheral zones. The major difference between the prostatic zones is the volume of glandular tissue and density of connective tissues, such as the stroma. The central and transitional zones occupy 25% of the volume of the glandular tissue and the peripheral zone occupies roughly 75% [22–24]. The density of the stroma is higher in the central and transitional zones than in the peripheral zone [22–24]. There has been no in vivo measurement study of prostate tissues, but the electrical conductivity of glandular tissue and the stroma have been reported as 0.097 and 0.120 S/m, respectively, at low-frequency by in vitro measurements [16,25,26]. Al-though there exists a difference between in vivo and in vitro measurements, the low conductivity of the per-ipheral zone can be explained from these results. The
histological characteristics between the central and tran-sitional zones are almost similar, with the only difference being the volume, location, and tissue composition ratio [5]. However, our results show that there was a differ-ence in conductivity between the two zones. From the viewpoint of the bio-electromagnetism, the transitional zone may have an intermediate tissue condition between the central and peripheral zones, but a detailed compari-son should be addressed in future studies.
In vivo electrical conductivity imaging (ECI) could provide alternative information on tissue structure and function using electrical tissue properties such as con-ductivity and permittivity. Electrical concon-ductivity is an inherent physical property of living tissues and it pro-vides absolute values [11, 17, 18]. Therefore, the tissue condition can be quantified and discriminated on the basis of absolute conductivity values. These preliminary results suggest the possibility of ECI as a new imaging biomarker for prostate disease. ECI may serve as a good complement to current prostate imaging in diagnosing prostate disease and assessing treatment response, espe-cially for prostate cancer. Moreover, ECI can provide
Fig. 5Bar graph showing the comparison of prostatic tissues based on the anatomical significance in the T2-weighted MR image.aROIs are located in three anatomical regions of the prostate,belectrical conductivity is measured from the corresponding regions
Table 2Measurement of electrical conductivity of prostatic tissues based on the anatomical significance
Conductivity [S/m] Central zone Transitional zone Peripheral zone Canine 1 0.157 ± 0.011 0.134 ± 0.006, (14.6%)a 0.119 ± 0.005, (24.2%)a Canine 2 0.143 ± 0.002 0.136 ± 0.004, (4.9%) 0.118 ± 0.006, (17.5%) Canine 3 0.140 ± 0.004 0.135 ± 0.004, (3.6%) 0.125 ± 0.002, (10.7%) Average 0.146 ± 0.010 0.135 ± 0.004, (7.5%) 0.120 ± 0.006, (17.8%)
Values are presented as mean ± standard deviation
a
Parentheses indicate the percentage changes based on the conductivity of the central zone
immediate information on tissue anisotropy. When ECI is used with current multiparametric MR imaging, it may be helpful in the diagnosis of prostatic cancer, such as in localization and characterization, and in the assess-ment of the treatassess-ment response in the early period.
We acknowledge that this study has several limitations. First, the relatively long acquisition time and poor spatial resolution should be addressed for clinical applications. Recent advances in ECI technique, such as conductivity tensor imaging (CTI), have demonstrated the potential to improve current conductivity imaging methods in terms of acquisition time and spatial resolution [27]. In addition, the high sensitivity of ECI to tissue response following ra-diation therapy (RT) may reveal the possibility of ECI for clinical application in prostate diseases [28]. Second, the current study was performed on a small number of nor-mal aninor-mal prostates, thus, further study should be per-formed with large numbers of normal prostates for statistical analysis, animal disease models such as prostate cancer or benign prostate hyperplasia, and human pros-tates. Third, the lack of accurate correlation between tis-sue histology and the value of ECI according to ROI and zonal anatomy might be problematic. However, regarding the well established zonal anatomy on T2-weighted im-aging in the current study, ECI could provide different values according to the zones and regions of the prostate.
Conclusion
In this feasibility study, we applied an in vivo electrical conductivity-based MR imaging method to image the dif-ferences in prostatic tissues. From the electrical conductiv-ity images, we could quantify the tissue condition in terms of the conductivity distribution and anatomical significance. Conductivity images shown in this study indicated that the contrast between the prostatic tissues are distinguishable in a different way compared with conventional MR imaging techniques. Future studies will be focused on the verifica-tion and evaluaverifica-tion of conductivity differences between normal healthy men and patients with prostatic diseases.
Abbreviations
ECI:Electrical conductivity imaging; MR: Magnetic resonance;
MREIT: Magnetic resonance electrical impedance tomography; ROI: Region of Interest
Acknowledgements Not applicable.
Authors’contributions
YSC and JWK were involved in animal imaging experiments, data collection, and manuscript writing. YHH and HJS were involved in data collection and analysis. HJK was involved in image processing, quantitative analysis, and manuscript editing. All authors read and approved the final manuscript.
Funding
This work was supported by the National Research Foundation of Korea (NRF) and the Ministry of Health and Welfare of Korea grants funded by the Korea government (No. 2017R1A2A1A05001330, 2018R1D1A1B07046619, HI18C2435). The work also supported by the research fund from Chosun
University (2019). These foundations did not interfere in the design of the study and collection, analysis, and interpretation of data and in writing the manuscript.
Availability of data and materials
All authors had full access to all the data in the study and take responsibility for the integrity of the data and the accuracy of the data analysis. The datasets generated and/or analyzed during the current study are available from the corresponding author on reasonable request.
Ethics approval and consent to participate
All experimental protocols (such as the care, maintenance, and treatment of animals) were performed in accordance with the regulations of the Institutional Animal Care and Use Committee (IACUC), and were approved by the Ethics Committee of Kyung Hee University, Korea (No. KHUASP-14-25).
Consent for publication Not applicable.
Competing interests
The authors declare that they have no competing interests.
Author details 1
Department of Radiology, Chosun University Hospital and Chosun University College of Medicine, 365 Pilmun-daero, Dong-gu, Gwangju 61453, South Korea.2Department of Hepato-Biliary-Pancreas Surgery, Chonnam National University Hwasun Hospital and Chonnam National University Medical School, Gwangju 61469, South Korea.3Department of Biomedical Engineering, Kyung Hee University, 23 Kyungheedaero, Dongdaemungu, Seoul 02447, South Korea.
Received: 31 January 2019 Accepted: 9 October 2019
References
1. Jemal A, Siegel R, Ward E, Hao Y, Xu J, Murray T, Thun MJ. Cancer statistics, 2008. CA Cancer J Clin. 2008;58:71–96.
2. Catalona WJ. Prostate cancer screening. Med Clin North Am. 2018;102:199–214. 3. Price CP, Allard J, Davies G, Dawnay A, Duffy MJ, France M, Mandarino G, Ward
AM, Patel B, Sibley P, Sturgeon C. Pre- and post-analytical factors that may influence use of serum prostate-specific antigen and its isoforms in a screening programme for prostate cancer. Ann Clin Biochem. 2001;38:188–216. 4. McNeal JE. The zonal anatomy of the prostate. Prostate. 1981;2:35–49. 5. McNeal JE. Normal histology of the prostate. Am J Surg Pathol. 1988;12:
619–33.
6. Hoeks CM, Barentsz JO, Hambrock T, Yakar D, Somford DM, Heijmink SW, Scheenen TW, Vos PC, Huisman H, van Oort IM, Witjes JA, Heerschap A, Fütterer JJ. Prostate cancer: multiparametric MR imaging for detection, localization, and staging. Radiology. 2011;261:46–66.
7. Metcalfe P, Liney GP, Holloway L, Walker A, Barton M, Delaney GP, Vinod S, Tome W. The potential for an enhanced role for MRI in radiation-therapy treatment planning. Technol Cancer Res Treat. 2013;12:429–46. 8. Wallitt KL, Khan SR, Dubash S, Tam HH, Khan S, Barwick TD. Clinical PET
imaging in prostate cancer. Radiographics. 2017;37(5):1512–36.
9. Verma S, Rosenkrantz AB, Choyke P, Eberhardt SC, Eggener SE, Gaitonde K, Haider MA, Margolis DJ, Marks LS, Pinto P, Sonn GA, Taneja SS. Commentary regarding a recent collaborative consensus statement addressing prostate MRI and MRI-targeted biopsy in patients with a prior negative prostate biopsy. Abdom Radiol. 2017;42:346–9.
10. Katscher U, Voigt T, Findeklee C, Vernickel P, Nehrke K, Dössel O. Determination of electric conductivity and local SAR via B1 mapping. IEEE Trans Med Imaging. 2009;28:1365–74.
11. Seo JK, Kim MO, Lee J, Choi N, Woo EJ, Kim HJ, Kwon OI, Kim DH. Error analysis of non-constant admittivity for MR-based electric property imaging. IEEE Trans Med Imaging. 2012;31:430–7.
12. Kim HJ, Jeong WC, Sajib SZ, Kim MO, Kwon OI, Je Woo E, Kim DH. Simultaneous imaging of dual-frequency electrical conductivity using a combination of MREIT and MREPT. Magn Reson Med. 2014;71:200–8. 13. Haemmerich D, Staelin ST, Tsai JZ, Tungjitkusolmun S, Mahvi DM, Webster
14. Oh TI, Jeong WC, McEwan A, Park HM, Kim HJ, Kwon OI, Woo EJ. Feasibility of MREIT conductivity imaging to evaluate brain abscess lesion: in vivo canine model. J Magn Reson Imaging. 2013;38:189–97.
15. Lee SK, Bulumulla S, Wiesinger F, Sacolick L, Sun W, Hancu I. Tissue electrical property mapping from zero echo-time magnetic resonance imaging. IEEE Trans Med Imaging. 2015;34:541–50.
16. Halter RJ, Schned A, Heaney J, Hartov A, Paulsen KD. Electrical properties of prostatic tissues: I. single frequency admittivity properties. J Urol. 2009;182: 1600–7.
17. Seo JK, Woo EJ. Electrical tissue property imaging at low frequency using MREIT. IEEE Trans Biomed Eng. 2014;61:1390–9.
18. Sajib SZK, Kwon OI, Kim HJ, Woo EJ. Electrodeless conductivity tensor imaging (CTI) using MRI: basic theory and animal experiments. Biomed Eng Lett. 2018;8:273–82.
19. An D, Park J, Shin JI, Kim HJ, Jung DI, Kang JH, Kim G, Chang DW, Sur JH, Yang MP, Lee C, Kang BT. Temporal evolution of MRI characteristics in dogs with collagenase-induced intracerebral hemorrhage. Comp Med. 2015;65(6): 517–25.
20. Jeong WC, Meng ZJ, Kim HJ, Kwon OI, Woo EJ. Experimental validations of in vivo human musculoskeletal tissue conductivity images using MR-based electrical impedance tomography. Bioelectromagnetics. 2014;35:363–72. 21. Sajib SZK, Kim HJ, Kwon OI, Woo EJ. Regional absolute conductivity
reconstruction using projected current density in MREIT. Phys Med Biol. 2012;57:5841–59.
22. Lee JJ, Thomas IC, Nolley R, Ferrari M, Brooks JD, Leppert JT. Biologic differences between peripheral and transition zone prostate cancer. Prostate. 2015;75:183–90.
23. Noguchi M, Stamey TA, Neal J, Yemoto C. An analysis of 148 consecutive transition zone cancers: clinical and histological characteristics. J Urol. 2000; 163:1751–5.
24. McNeal JE, Redwine EA, Freiha FS, Stamey TA. Zonal distribution of prostatic adenocarcinoma: correlation with histologic pattern and direction of spread. Am J Surg Pathol. 1988;12:897–906.
25. Halter RJ, Schned A, Heaney J, Hartov A, Paulsen KD. Electrical properties of prostatic tissues: II. Spectral admittivity properties. J Urol. 2009;182:1608–13. 26. Halter RJ, Schned A, Heaney J, Hartov A. Passive bioelectrical properties for assessing high- and low-grade prostate adenocarcinoma. Prostate. 2011;71: 1759–67.
27. Katoch N, Choi BK, Sajib SZK, Lee EA, Kim HJ, Kwon OI, Woo EJ. Conductivity tensor imaging of in vivo human brain and experimental validation using giant vesicle suspension. IEEE Trans Med Imaging. 2019;38(7):1569–77. 28. Park JA, Kang KJ, Ko IO, Lee KC, Choi BK, Katoch N, Kim JW, Kim HJ, Kwon
OI, Woo EJ. In vivo measurement of brain tissue response after irradiation: comparison of T2 relaxation, apparent diffusion coefficient, and electrical conductivity. IEEE Trans Med Imaging.https://doi.org/10.1109/TMI.2019. 2913766.
Publisher’s Note
Springer Nature remains neutral with regard to jurisdictional claims in published maps and institutional affiliations.