RESEARCH
Hypoglycemia in blood glucose level in type
2 diabetic Japanese patients by continuous
glucose monitoring
Maiko Hajime, Yosuke Okada, Hiroko Mori, Fumi Uemura, Satomi Sonoda, Kenichi Tanaka, Akira Kurozumi,
Manabu Narisawa, Keiichi Torimoto and Yoshiya Tanaka
*Abstract
Background: Hypoglycemia is associated with cardiovascular diseases, increased risk of death. Therefore, it is impor-tant to avoid hypoglycemia. The aim of this study was to characterize hypoglycemia according to glycated hemo-globin (HbA1c) level and determine the contributing factors in type 2 diabetes mellitus (T2DM), using continuous glucose monitoring (CGM).
Methods: T2DM patients (n = 293) receiving inpatient care were divided into five groups according to HbA1c level on admission (Group 1: ≥ 6 to < 7%, Group 2: ≥ 7 to < 8%, Group 3: ≥ 8 to < 9%, Group 4: ≥ 9 to < 10%, and Group 5: ≥ 10%). The frequency of hypoglycemia and factors associated with hypoglycemia were analyzed.
Results: Hypoglycemia occurred in 15 patients (5.1%), including 4 (8%), 4 (6%), and 7 (10%) patients of Groups 1, 2, and 3, respectively, but in none of groups 4 and 5. Patients with hypoglycemia of Groups 1 had low insulin secretion and were high among insulin users, those of Groups 2 had low homeostasis model assessment of insulin resistance (HOMA-IR). Those of Group 2 and 3 had significantly lower mean blood glucose levels, those of Group 3 only had significantly lower maximum blood glucose level and percentage of AUC > 180 mg/dL. In any of the HbA1c groups, variations in blood glucose level were significantly larger in patients with hypoglycemia than without.
Conclusions: Hypoglycemia occurred in patients with a wide range of HbA1c on admission (range 6–9%), suggest-ing that prediction of hypoglycemia based on HbA1c alone is inappropriate. Among patients with low HbA1c, strict control sometimes induce hypoglycemia. Among patients with high HbA1c, the possibility of hypoglycemia should be considered if there is a marked discrepancy between HbA1c and randomly measured blood glucose level. Larger variations in blood glucose level induce hypoglycemia in any of the HbA1c groups. The treatment to reduce variations in blood glucose level is important to prevent hypoglycemia.
Keywords: Hypoglycemia, Type 2 diabetes mellitus, Continuous glucose monitoring
© The Author(s) 2019. This article is distributed under the terms of the Creative Commons Attribution 4.0 International License (http://creat iveco mmons .org/licen ses/by/4.0/), which permits unrestricted use, distribution, and reproduction in any medium, provided you give appropriate credit to the original author(s) and the source, provide a link to the Creative Commons license, and indicate if changes were made. The Creative Commons Public Domain Dedication waiver (http://creat iveco mmons .org/ publi cdoma in/zero/1.0/) applies to the data made available in this article, unless otherwise stated.
Background
The United Kingdom Prospective Diabetes Study and the ADVANCE Study demonstrated that strict blood glu-cose control can lessen the risk of microangiopathy [1, 2]. However, the Action to Control Cardiovascular Risk in Diabetes Study demonstrated increased overall death rate
following strict blood glucose control, and sub-analysis of their data disclosed a higher annual death rate in the hypoglycemia episode group than in the hypoglycemia-free group [3, 4]. In recent years, numerous studies have demonstrated that repeated episodes of hypoglycemia increase the risk for cardiovascular disease and dementia and the death rate. Thus, it is important to avoid hypogly-cemia during treatment of diabetes [5–8].
With regard to the clinical background of patients who develop hypoglycemia, it is thought that hypoglycemia tends to develop in patients with poorly controlled blood
Open Access
*Correspondence: tanaka@med.uoeh-u.ac.jp
glucose, patients with low HbA1c, young patients, insulin users, and in elderly patients (contrary to the abovemen-tioned report) and patients with long history of diabetes [8–10]. Another study reported that episodes of hypo-glycemia are independent of HbA1c level [11]. To our knowledge, there is currently little or no information on the relation between hypoglycemia and HbA1c level or the factors associated with hypoglycemia.
In view of the known usefulness of continuous glu-cose monitoring (CGM) for evaluation of hypoglycemia among patients with type 2 diabetes mellitus (T2DM), the present study was designed to determine the associa-tion of frequency of hypoglycemia with HbA1c level and to identify the factors associated with hypoglycemia in hospitalized Japanese patients with T2DM, using CGM [12].
Methods Subjects
The study subjects were inpatients with T2DM at the Hospital of The University of Occupational and Environ-mental Health, Japan for the purpose of education of dia-betes and its affiliated hospitals between April 2010 and April 2015 with available blood glucose data recorded by CGM system (CGMS System Gold, Medtronic Inc., Fridley, MN; and iPro™2, Medtronic, Northridge, CA) within 5 days of admission while taking the same medi-cations throughout the study period. The study popula-tion included patients of any age who were or were not taking glucose-lowering agents. In this study, we defined patients with T2DM as those with family history of dia-betes and obesity, those without autoimmune diabe-tes, and those without hyperglycemia due to pancreatic failure or medication. The study excluded patients with type 1 diabetes, pancreatic diabetes, steroid diabetes, severe infection, pre- or postoperative status, and serious trauma. The study protocol was approved by the review board of The University of Occupational and Environ-mental Health, Japan and informed consent was obtained from all patients. The study conformed to the Declara-tion of Helsinki.
Study protocol
In this retrospective study, 24-h CGM data were extracted from the second or third day of glucose moni-toring. Patients had hospital meals at 25–30 kcal/kg standard body weight according to the dietary ther-apy recommended by the Japan Diabetes Society and underwent blood testing under fasting conditions on the second day of glucose monitoring [13]. For statisti-cal analysis, the patients were stratified by HbA1c level
on admission into five subgroups (≥ 6.0 to < 7.0%, ≥ 7.0 to < 8.0%, ≥ 8.0 to < 9.0%, ≥ 9.0 to < 10.0%, and ≥ 10%).
With regard to medications, information was collected about the number of oral glucose-lowering drugs used (percentages of patients using any such drug and patients using two or more such drugs) and about the use of insu-lin (percentages of insuinsu-lin users and non-users).
The primary endpoint was the difference in the fre-quency of hypoglycemia among the different HbA1c groups. The secondary endpoint was the factors asso-ciated with episodes of hypoglycemia in each HbA1c subgroup.
Biochemical and clinical measurements
The CGM devices used in this study included the Gold™ (Medtronic Inc.) and iPro™2 (Medtronic). The subcuta-neous electrode measures glucose concentration in the interstitial fluid within a range of 40–400 mg/dL at a fre-quency of 288 times/day [14]. The sensor readings were calibrated against blood glucose levels measured in the morning, noon, and evening, and before bed (4 times/ day). The glucose concentration measured by CGM is reported to correlate with the venous blood glucose level and is hereafter termed blood glucose level [14].
We excluded patients with microcirculatory impair-ment, which could potentially affect sensor performance. Data over 24 h extracted from the second or third day of glucose monitoring were used to calculate the average glucose level ± standard deviation (SD), mean amplitude
of glycemic excursions (MAGE), coefficient of variation (CV), maximum blood glucose level, minimum blood glucose level, area under the blood concentration–time curve (AUC) > 180 mg/dL, percentage of AUC > 180 mg/ dL, area over the blood concentration–time curve (AOC) < 70 mg/dL, and percentage of AOC < 70 mg/ dL. MAGE was calculated using the Glycemic Variabil-ity Analyzer Program 1.1 (MATLABR 2010b) [15]. CV, Average glucose level′, SD′ and CV′ were calculated by the equation: CV = SD/average glucose level, Average
glucose level′= log10 (Average blood glucose level + 30), SD′= log10 (SD + 30), CV′= log10 (CV + 30) [16]. HbA1c (%) was determined using NGSP calculated by the equa-tion: HbA1c (NGSP) (%) = HbA1c [Japan relationship of
HbA1c (JDS) × 1.02 + 0.25 (%)] [17]. The equation used to
calculate the estimated glomerular filtration rate (eGFR) was 194 × serum creatinine − 1.094 × age − 0.287 for men
and 194 × serum creatinine − 1.094 × age − 0.287 × 0.739
for women. The homeostasis model assessment of insu-lin resistance (HOMA-IR) was calculated by the equation of fasting plasma glucose (mg/dL) × fasting plasma
HOMA-IR is not always correct in patients with blood glucose level > 180 mg/dL.
Patients were divided into five groups according to HbA1c level on admission (≥ 6 to < 7%, ≥ 7 to < 8%, ≥ 8 to < 9%, ≥ 9 to < 10%, and ≥ 10%), and data of each group were analyzed in terms of the presence/absence of hypo-glycemia episodes. Hypohypo-glycemia was defined as a CGM-based blood glucose level of < 70 mg/dL, regardless of the presence/absence of subjective symptoms. Blood glucose level < 50 mg/dL was considered severe hypoglycemia.
Endpoints
The primary endpoint was the change in HbA1c levels at 24 weeks. The secondary endpoints were changes in uri-nary albumin excretion and LDL-C levels at 24 weeks.
Statistical analysis
Data are expressed as mean ± SD. One-way analysis of variance (ANOVA) was used for comparison between groups, Wilcoxon was used for comparisons between the no hypoglycemia and hypoglycemia groups. The Chi square test was used to assess categorical data. Each test was performed at a significance level of 0.05. All statisti-cal analyses were performed using JMP 11 (SAS Institute Inc., Cary, NC).
Results
Patient demographics
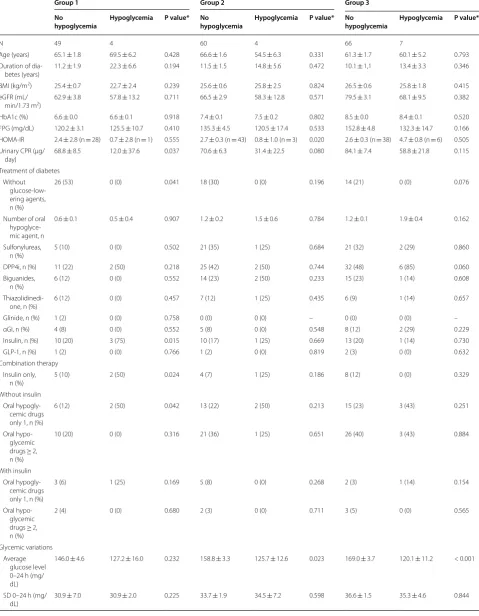
Table 1 shows the background variables of the study patients. The study included 293 patients (178 males and 115 females). Of these, 53, 64, 73, 49, and 54 patients were allocated to Group 1 (HbA1c (≥ 6 to < 7%), Group 2 (≥ 7 to < 8%), Group 3 (≥ 8 to < 9%), Group 4 (≥ 9 to < 10%), and Group 5 (≥ 10.0%), respectively. Patients of Group 5 were significantly younger with shorter duration of illness, and higher u-CPR. With regard to treatment, 51% of all patients of Group 1 were not using glucose-lowering drugs, whereas about half of the patients of Groups 2–4 were using dipeptidyl peptidase-4 (DPP-4) inhibitors. The percentage of insulin users was highest in Group 1 (25%) and lowest in Group 5 (2%).
Hypoglycemia
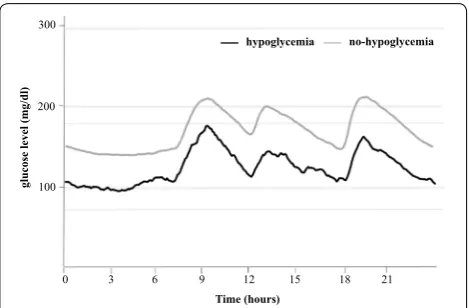
Figure 1 shows 24-h glycemic variations ± 1SD with or without hypoglycemia. Table 1 shows the percentage of patients with hypoglycemia for each group. For the whole group, episodes of hypoglycemia were recorded in 15 (5.1%) patients; 4 patients (8%) of Group 1, 4 (6%) of Group 2, 7 (10%) of Group 3, and none of Groups 4 and 5. In other words, patients with HbA1c of ≥ 9% never
developed hypoglycemia (p = 0.04). Severe hypoglycemia was seen in one patient each from Groups 1 and 3.
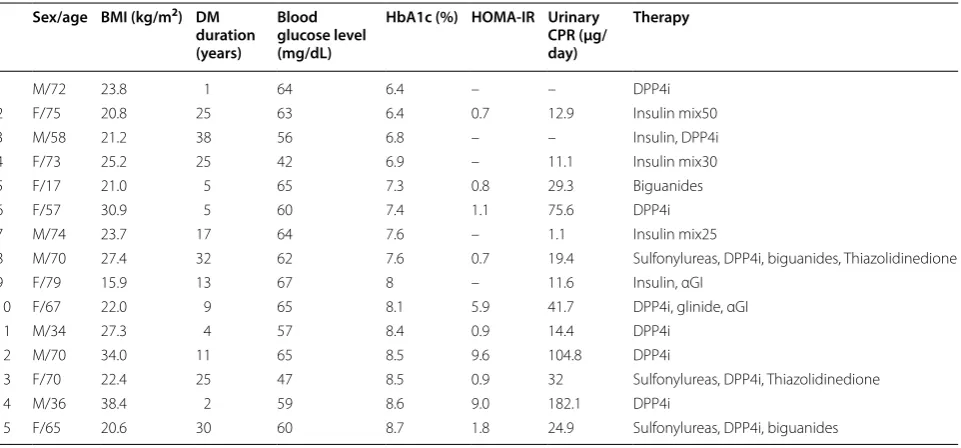
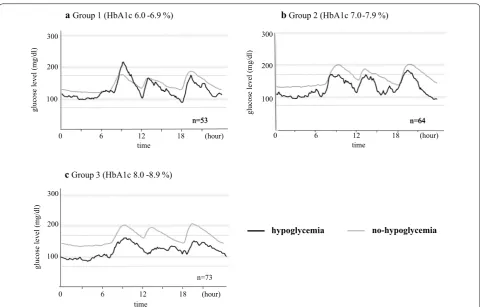
Clinical characteristics of patients with hypoglycemia Table 2 shows the clinical characteristics of patients strat-ified according to HbA1c level. Table 3 summarizes the clinical characteristics of patients of the different HbA1c groups, with and without hypoglycemia. Figure 2 shows 24-h glycemic variations ± 1SD in patients with or with-out hypoglycemia according to HbA1c level.
For patients of Group 1, the u-CPR was significantly lower in the hypoglycemia group (12.0 μg/day, n = 5) than those free of hypoglycemia (68.8 μg/day, n = 49). Patients with hypoglycemia of Groups 1 were high among insulin users (5.1%, p = 0.015). The hypoglycemia group included not only insulin users but also users of DPP-4 inhibitor. Of the insulin users of the hypoglycemia group, 2 patients used an insulin mixture and 1 patient was on intensive insulin therapy combined with DPP-4 inhibitor therapy. One of the two users of insulin mixture developed severe hypoglycemia. Moreover, one patient developed hypogly-cemia during treatment with a DPP-4 inhibitor alone.
With regard to patients of Group 2, HOMA-IR was lower in the hypoglycemia group than hypoglycemia-free group. Diverse drugs were being used by patients of the hypoglycemia subgroup (DPP-4 inhibitor by 1 patient, biguanide alone by 1, multiple oral glucose-lowering drugs by 1, and insulin mixture by 1 patient), but none developed severe hypoglycemia.
Patients with hypoglycemia of Groups 3 had signifi-cantly higher HOMA-IR. For medications used in the hypoglycemia group, 6 of the 7 patients used DPP-4 inhibitors, and half of these 6 patients also used insulin secretion stimulators [e.g., sulfonylureas (SU) and glin-ide] in combination with DPP-4 inhibitors. One of these patients developed severe hypoglycemia. This patient received three-drug combination therapy with DPP-4 inhibitor, high-dose SU, and thiazolidinedione. Hypogly-cemia also occurred in a patient who received intensive insulin therapy plus an α-glucosidase inhibitor.
CGM parameters of patients with hypoglycemia
with hypoglycemia than without. With regards to the markers of changes in blood glucose level, CV, SD′ and CV′ in Groups 1, SD′ in Groups 2 and CV, CV′ in Groups 3 were significantly larger in patients with hypoglycemia than without.
Discussion
In the present study, hospitalized patients with type 2 diabetes mellitus were evaluated to determine the status of hypoglycemia in relation to their HbA1c level, using CGM. Episodes of hypoglycemia were noted in patients
with a wide range of HbA1c levels (6–9%), corroborat-ing the previously reported findcorroborat-ing that prediction of hypoglycemia is not possible on the basis of HbA1c alone [18]. Noteworthy, although some investigators reported that hypoglycemia often develops in poorly controlled diabetic patients [8], hypoglycemia in the present study was not recorded in any of the patients of the poorly con-trolled groups (HbA1c ≥ 9%). This finding is probably
related to the following factors: (1) the poorly controlled patients (high HbA1c groups) in the present study were relatively young; (2) the duration of diabetes in these Table 1 Clinical characteristics according to HbA1c level
Data are mean ± SD, unless otherwise indicated
BMI body mass index, eGFR estimated glomerular filtration rate, HbA1c hemoglobin A1c, FPG fasting plasma glucose, HOMA-IR homeostasis model assessment of insulin resistance, CPR C peptide immunoreactivity, DPP4i dipeptidyl peptidase-4 inhibitor, αGI α-glucosidase inhibitor, GLP-1 glucagon-like peptide-1
* ANOVA for comparisons between each group, Chi square test for sex differences, treatment, hypoglycemia and severe hypoglycemia
Group 1 Group 2 Group 3 Group 4 Group 5 P value*
n 53 64 73 49 54
Age (years) 65.4 ± 1.7 65.9 ± 1.6 61.2 ± 1.5 63.3 ± 1.8 55.0 ± 1.8 < 0.001 Duration of diabetes (years) 12.1 ± 1.4 11.7 ± 1.3 10.4 ± 1.2 12.7 ± 1.5 6.2 ± 1.4 < 0.001 BMI (kg/m2) 25.2 ± 0.6 25.6 ± 0.6 26.5 ± 0.5 24.7 ± 0.6 26.9 ± 0.6 0.087
eGFR (mL/min/1.73 m2) 62.6 ± 3.6 66.1 ± 3.3 78.4 ± 3.0 74.7 ± 3.7 90.9 ± 3.5 < 0.001
HbA1c (%) 6.6 ± 0.1 7.4 ± 0.1 8.5 ± 0.1 9.5 ± 0.1 11.3 ± 0.1 < 0.001 FPG (mg/dL) 120.8 ± 5.0 134.4 ± 4.5 150.8 ± 4.2 164.2 ± 5.1 188.6 ± 4.9 < 0.001 HOMA-IR 2.4 ± 0.4 (n = 29) 2.5 ± 0.3 (n = 46) 2.9 ± 0.3 (n = 44) 2.2 ± 0.4 (n = 23) 2.5 ± 0.4 (n = 23) 0.628 Urinary CPR (μg/day) 66.0 ± 8.6 67.8 ± 7.4 81.5 ± 6.6 61.5 ± 8.2 107.0 ± 7.7 < 0.001 Treatment of diabetes
Without glucose-lowering agents, n (%) 27 (51) 18 (28) 14 (19) 8 (16) 18 (33) < 0.001 Sulfonylureas, n (%) 5 (9) 22 (34) 23 (32) 18 (37) 21 (39) 0.006 Biguanides, n (%) 4 (8) 16 (25) 16 (22) 15 (31) 11 (20) 0.058 DPP4i, n (%) 13 (25) 27 (42) 38 (52) 27 (55) 17 (31) 0.004 Thiazolidinedione, n (%) 6 (11) 8 (13) 7 (10) 6 (12) 7 (13) 0.978 Glinide, n (%) 1 (2) 0 (0) 0 (0) 2 (5) 0 (0) 0.154
αGI, n (%) 4 (8) 5 (8) 10 (14) 3 (6) 3 (6) 0.465
Insulin, n (%) 13 (25) 13 (20) 14 (19) 9 (18) 1 (2) 0.022
GLP-1, n (%) 1 (2) 1 (2) 2 (3) 1 (2) 3 (6) 0.699
Combination therapy
Insulin only, n (%) 7 (13) 5 (8) 8 (11) 0 (0) 0 (0) 0.011 Without insulin
Oral hypoglycemic drugs only 1, n (%) 8 (15) 15 (24) 18 (25) 14 (29) 17 (32) 0.336 Oral hypoglycemic drugs ≥ 2, n (%) 10 (19) 22 (35) 29 (40) 21 (43) 18 (34) 0.080 With insulin
Oral hypoglycemic drugs only 1, n (%) 4 (8) 6 (9) 3 (4) 8 (16) 0 (0) 0.019 Oral hypoglycemic drugs ≥ 2, n (%) 2 (4) 2 (3) 3 (4) 1 (2) 1 (2) 0.939 All (n = 294)
Hypoglycemia, n (%) 4 (8) 4 (6) 7 (10) 0 (0) 0 (0) 0.052 Severe hypoglycemia, n (%) 1 (2) 0 (0) 1 (1) 0 (0) 0 (0) 0.594 With glucose-lowering agents (n = 209) n 27 46 59 41 36
patients was short; (3) the percentage of insulin users was low; (4) 33% of all patients were under diet therapy alone; and (5) the percentage of patients recently diagnosed with diabetes and with retained insulin secreting capabil-ity was high.
The overall incidence of hypoglycemia in this study was 5.1%, which is much lower than that of 49.1% reported in a previous study using CGM [12]. It has been suggested that the risk for hypoglycemia increases in patients with T2DM on combination treatment with both insulin and oral glucose-lowering drugs [19]. The percentage of patients using insulin secretion stimulators (e.g., SU, gli-nide) was approximately 30% in both the previous study and in the present study, whereas the percentage of insu-lin users was lower in the present study (17%) than in the previous study (70%). This difference may be the cause of the different incidence of hypoglycemia between the pre-sent and previous study.
With regard to clinical features of diabetic patients who developed hypoglycemia, patients of Group 1 had signifi-cantly lower insulin secretion and were high among insu-lin users in the present study. If this result is combined with the previous report that the risk for hypoglycemia is higher in insulin users, it seems that strict blood glucose control by insulin therapy increases the risk of hypogly-cemia [19]. Some papers have reported localized amyloi-dosis at the site of repeated insulin injection in a diabetic patient was the risk for hypoglycemia, it might be a rea-son of hypoglycemia in insulin users [20].
Furthermore, insulin users who developed hypogly-cemia were often using an insulin mixture, and one of these patients developed severe hypoglycemia. A pre-vious study that compared patients on insulin mixture therapy with those on basal-bolus therapy demonstrated
significantly high incidence of hypoglycemia in the insu-lin mixture therapy group [21]. The results of the pre-sent study do not contradict the findings of this previous study [21].
On the other hand, poorly controlled patients who developed hypoglycemia in Group 3 had significantly higher HOMAIR. Thirty % of the patients who devel-oped hypoglycemia were receiving DPP-4 inhibitor + SU therapy. Although DPP-4 inhibitors are considered safe drugs, and unlikely to cause hypoglycemia, it has been reported that their use in combination with SU enhances the drug activity, mediated by the Epac2A/Rap1 signal-ing pathway, consequently leadsignal-ing to 50% rise in the risk of hypoglycemia [22, 23]. In addition, cases of noninsu-linoma pancreatogenous hypoglycemia due to excessive insulin secretion, regardless of the presence/absence of underlying diabetes mellitus, have been reported, at least partly explaining the episode of hypoglycemia in patients receiving DPP-4 inhibitors alone [24].
In the analysis of CGM data of Groups 1–3, the mean blood glucose and were significantly lower for the hypo-glycemia patients than hypohypo-glycemia-free patients in Group 1 and 2, maximum glucose levels, as well as the proportion of AUC > 180, were significantly lower for the hypoglycemia patients than hypoglycemia-free patients only in Group 3, whereas the proportion of AOC < 70 was significantly higher in the hypoglycemia group in all three HbA1c groups. These results highlight the importance of ongoing hypoglycemia and that it should be considered in patients showing discrepancies between HbA1c and randomly measured blood glucose levels even when the HbA1c level is high. In addition, one previous report stated that the rate of hypoglycemia among insulin users tended to increase along with increasing variations in blood glucose level [25]. In the present study, the vari-ations in blood glucose level were significantly larger for the hypoglycemia patients than hypoglycemia-free patients in any of the HbA1c groups. In Group 1, the per-centage of insulin users was high among the hypoglyce-mia cases. The treatment to reduce variations in blood glucose level is important to prevent hypoglycemia.
As mentioned above, the results of CGM suggest that prediction of hypoglycemia is not possible with HbA1c alone. Furthermore, in the low HbA1c groups, insulin secretion was lower and the incidence of hypoglycemia were high among insulin users, suggesting that strict blood glucose control can induce hypoglycemia. In the high HbA1c groups, it seems necessary to consider the possibility of hypoglycemia if a discrepancy between HbA1c and randomly measured blood glucose levels is noted.
The present study has several limitations, including (1) its retrospective study design, (2) small sample size,
300
200
100
3 6 9 12 15 18 21
Time (hours)
glucose level (mg/dl
)
0
hypoglycemia no-hypoglycemia
Table 2 Clinical characteristics of patients with or without hypoglycemia
Group 1 Group 2 Group 3
No
hypoglycemia Hypoglycemia P value* No hypoglycemia Hypoglycemia P value* No hypoglycemia Hypoglycemia P value*
N 49 4 60 4 66 7
Age (years) 65.1 ± 1.8 69.5 ± 6.2 0.428 66.6 ± 1.6 54.5 ± 6.3 0.331 61.3 ± 1.7 60.1 ± 5.2 0.793 Duration of
dia-betes (years)
11.2 ± 1.9 22.3 ± 6.6 0.194 11.5 ± 1.5 14.8 ± 5.6 0.472 10.1 ± 1,1 13.4 ± 3.3 0.346
BMI (kg/m2) 25.4 ± 0.7 22.7 ± 2.4 0.239 25.6 ± 0.6 25.8 ± 2.5 0.824 26.5 ± 0.6 25.8 ± 1.8 0.415
eGFR (mL/
min/1.73 m2) 62.9 ± 3.8 57.8 ± 13.2 0.711 66.5 ± 2.9 58.3 ± 12.8 0.571 79.5 ± 3.1 68.1 ± 9.5 0.382
HbA1c (%) 6.6 ± 0.0 6.6 ± 0.1 0.918 7.4 ± 0.1 7.5 ± 0.2 0.802 8.5 ± 0.0 8.4 ± 0.1 0.520 FPG (mg/dL) 120.2 ± 3.1 125.5 ± 10.7 0.410 135.3 ± 4.5 120.5 ± 17.4 0.533 152.8 ± 4.8 132.3 ± 14.7 0.166 HOMA-IR 2.4 ± 2.8 (n = 28) 0.7 ± 2.8 (n = 1) 0.555 2.7 ± 0.3 (n = 43) 0.8 ± 1.0 (n = 3) 0.020 2.6 ± 0.3 (n = 38) 4.7 ± 0.8 (n = 6) 0.505 Urinary CPR (μg/
day)
68.8 ± 8.5 12.0 ± 37.6 0.037 70.6 ± 6.3 31.4 ± 22.5 0.080 84.1 ± 7.4 58.8 ± 21.8 0.115
Treatment of diabetes Without
glucose-low-ering agents, n (%)
26 (53) 0 (0) 0.041 18 (30) 0 (0) 0.196 14 (21) 0 (0) 0.076
Number of oral hypoglyce-mic agent, n
0.6 ± 0.1 0.5 ± 0.4 0.907 1.2 ± 0.2 1.5 ± 0.6 0.784 1.2 ± 0.1 1.9 ± 0.4 0.162
Sulfonylureas, n (%)
5 (10) 0 (0) 0.502 21 (35) 1 (25) 0.684 21 (32) 2 (29) 0.860
DPP4i, n (%) 11 (22) 2 (50) 0.218 25 (42) 2 (50) 0.744 32 (48) 6 (85) 0.060
Biguanides, n (%)
6 (12) 0 (0) 0.552 14 (23) 2 (50) 0.233 15 (23) 1 (14) 0.608
Thiazolidinedi-one, n (%)
6 (12) 0 (0) 0.457 7 (12) 1 (25) 0.435 6 (9) 1 (14) 0.657
Glinide, n (%) 1 (2) 0 (0) 0.758 0 (0) 0 (0) – 0 (0) 0 (0) –
αGI, n (%) 4 (8) 0 (0) 0.552 5 (8) 0 (0) 0.548 8 (12) 2 (29) 0.229
Insulin, n (%) 10 (20) 3 (75) 0.015 10 (17) 1 (25) 0.669 13 (20) 1 (14) 0.730
GLP-1, n (%) 1 (2) 0 (0) 0.766 1 (2) 0 (0) 0.819 2 (3) 0 (0) 0.632
Combination therapy Insulin only,
n (%)
5 (10) 2 (50) 0.024 4 (7) 1 (25) 0.186 8 (12) 0 (0) 0.329
Without insulin Oral hypogly-cemic drugs only 1, n (%)
6 (12) 2 (50) 0.042 13 (22) 2 (50) 0.213 15 (23) 3 (43) 0.251
Oral hypo-glycemic drugs ≥ 2, n (%)
10 (20) 0 (0) 0.316 21 (36) 1 (25) 0.651 26 (40) 3 (43) 0.884
With insulin Oral
hypogly-cemic drugs only 1, n (%)
3 (6) 1 (25) 0.169 5 (8) 0 (0) 0.268 2 (3) 1 (14) 0.154
Oral hypo-glycemic drugs ≥ 2, n (%)
2 (4) 0 (0) 0.680 2 (3) 0 (0) 0.711 3 (5) 0 (0) 0.565
Glycemic variations Average
glucose level 0–24 h (mg/ dL)
146.0 ± 4.6 127.2 ± 16.0 0.232 158.8 ± 3.3 125.7 ± 12.6 0.023 169.0 ± 3.7 120.1 ± 11.2 < 0.001
SD 0–24 h (mg/
Data are mean ± SD, unless otherwise indicated
SD standard deviation, MAGE mean amplitude of glycemic excursions, CV coefficient of variation, Average glucose level′= log10 (Average glucose level +30);
SD′= log10 (SD + 30); CV′= log10 (CV + 30); AUC area under the blood concentration–time curve, AOC area over the blood concentration–time curve. See Table 1 for
abbreviations
* Wilcoxon for comparisons between the no hypoglycemia and hypoglycemia groups, Chi square test for sex differences
Table 2 (continued)
Group 1 Group 2 Group 3
No
hypoglycemia Hypoglycemia P value* No hypoglycemia Hypoglycemia P value* No hypoglycemia Hypoglycemia P value*
MAGE 0–24 h (mg/dL)
88.2 ± 3.5 110.5 ± 12.3 0.381 96.5 ± 4.2 109.3 ± 16.2 0.305 98.5 ± 3.1 94.8 ± 9.5 0.555
Maximum glucose level 0–24 h (mg/ dL)
223.3 ± 8.0 223.3 ± 8.0 0.893 237.6 ± 6.9 213.5 ± 26.8 0.332 256.3 ± 5.6 194.7 ± 17.1 < 0.001
Minimum glucose level 0–24 h (mg/ dL)
98.6 ± 2.8 56.3 ± 10.0 < 0.001 105.1 ± 2.8 62.0 ± 10.8 < 0.001 108.1 ± 3.2 60.0 ± 9.9 < 0.001
CV (%) 0.21 ± 0.01 0.30 ± 0.03 0.031 0.21 ± 0.01 0.27 ± 0.04 0.133 0.22 ± 0.01 0.29 ± 0.02 < 0.001 Average
glucose level′
0–24 h (mg/ dL)
2.23 ± 0.01 2.18 ± 0.03 0.114 2.26 ± 0.01 2.22 ± 0.03 0.148 2.28 ± 0.01 2.16 ± 0.03 < 0.001
SD′ 0–24 h (mg/dL)
0.07 ± 0.00 0.11 ± 0.01 0.020 0.08 ± 0.00 0.10 ± 0.01 0.010 0.08 ± 0.00 0.10 ± 0.01 0.071
CV′ (%) 3.18 ± 0.13 4.81 ± 0.44 0.011 3.35 ± 0.16 4.60 ± 0.65 0.068 3.52 ± 0.15 4.59 ± 0.45 0.027 Percentage of
AUC > 180 0–24 h (%)
17.6 ± 10.1 12.6 ± 10.1 0.735 26.7 ± 2.7 8.8 ± 10.4 0.076 34.5 ± 2.9 7.3 ± 8.9 < 0.001
Percentage of AOC < 70 0–24 h (%)
0 4.5 ± 0.4 < 0.001 0 4.2 ± 0.3 < 0.001 0 8.1 ± 1.3 < 0.001
Table 3 Characteristics of individual patients with hypoglycemia
See Table 1 for abbreviations
Sex/age BMI (kg/m2) DM
duration (years)
Blood glucose level (mg/dL)
HbA1c (%) HOMA-IR Urinary CPR (μg/ day)
Therapy
1 M/72 23.8 1 64 6.4 – – DPP4i
2 F/75 20.8 25 63 6.4 0.7 12.9 Insulin mix50 3 M/58 21.2 38 56 6.8 – – Insulin, DPP4i 4 F/73 25.2 25 42 6.9 – 11.1 Insulin mix30 5 F/17 21.0 5 65 7.3 0.8 29.3 Biguanides
6 F/57 30.9 5 60 7.4 1.1 75.6 DPP4i
7 M/74 23.7 17 64 7.6 – 1.1 Insulin mix25
8 M/70 27.4 32 62 7.6 0.7 19.4 Sulfonylureas, DPP4i, biguanides, Thiazolidinedione 9 F/79 15.9 13 67 8 – 11.6 Insulin, αGI
10 F/67 22.0 9 65 8.1 5.9 41.7 DPP4i, glinide, αGI
11 M/34 27.3 4 57 8.4 0.9 14.4 DPP4i
12 M/70 34.0 11 65 8.5 9.6 104.8 DPP4i
13 F/70 22.4 25 47 8.5 0.9 32 Sulfonylureas, DPP4i, Thiazolidinedione 14 M/36 38.4 2 59 8.6 9.0 182.1 DPP4i
(3) evaluation of hospitalized patients with discrepan-cies between HbA1c on admission and blood glucose level after admission, (4) the fact that the CGM data were lower than the actual self-monitored blood glucose lev-els (possible exaggeration of this difference during hypo-glycemia), and (5) high percentage of patients receiving multiple drugs, possibly modifying hypoglycemia. Fur-ther prospective studies of large number of outpatients, including larger number of patients receiving no medica-tion, are needed to confirm the present findings.
Abbreviations
T2DM: type 2 diabetes mellitus; HbA1c: glycated hemoglobin; CGM: continu-ous glucose monitoring; HOMA-IR: homeostasis model assessment of insulin resistance; SD: standard deviation; MAGE: mean amplitude of glycemic excursion; CV: coefficient of variation; AUC : area under the blood concentra-tion–time curve; AOC: area over the blood concentraconcentra-tion–time curve; eGFR: estimated glomerular filtration rate; uCPR: urinary C-peptide reactivity; SU: sulfonylureas.
Authors’ contributions
All authors listed on the manuscript participated in the design of the study and in writing the manuscript. KT performed the statistical analysis. All authors read and approved the final manuscript.
Acknowledgements
The authors thank Ms. N. Sakaguchi for the excellent technical assistance.
Competing interests
The authors declare that they have no competing interests.
Availability of data and materials
The data that support the findings of this study are available from the cor-responding author upon reasonable request.
Consent for publication
All authors have read and approved the submission of this manuscript, and the manuscript has not been published and is not being consideration for publication elsewhere, in whole or in art, in any language, expect as an abstract.
Ethics approval and consent to participate
The study protocols were approved by the Ethics Committee of UOEH, and written informed consent was provided by all subjects.
Publisher’s Note
Springer Nature remains neutral with regard to jurisdictional claims in pub-lished maps and institutional affiliations.
Received: 12 November 2018 Accepted: 6 February 2019
(hour) time
0
n=53 300
200
100
gl
ucose
level
(mg/dl
)
6 12 18
a Group 1 (HbA1c 6.0 -6.9 %)
300
200
100
gl
ucose
level
(mg/dl
)
(hour) time
0 6 12 18
n=64
b Group 2 (HbA1c 7.0-7.9 %)
(hour) time
0 300
200
100
gl
ucose
level
(mg/dl
)
6 12 18
c Group 3 (HbA1c 8.0 -8.9 %)
n=73
hypoglycemia no-hypoglycemia
•fast, convenient online submission •
thorough peer review by experienced researchers in your field • rapid publication on acceptance
• support for research data, including large and complex data types •
gold Open Access which fosters wider collaboration and increased citations maximum visibility for your research: over 100M website views per year •
At BMC, research is always in progress.
Learn more biomedcentral.com/submissions
Ready to submit your research? Choose BMC and benefit from:
References
1. UK Prospective Diabetes Study (UKPDS) Group. Effect of intensive blood-glucose control with metformin on complications in overweight patients with type 2 diabetes (UKPDS 34). Lancet. 1998;352:854–65.
2. ADVANCE Collaborative Group, Patel A, MacMahon S, et al. Intensive blood glucose control and vascular outcomes in patients with type 2 diabetes. N Engl J Med. 2008;358(24):2560–72.
3. Bonds DE, Miller ME, Bergenstal RM, et al. The association between symptomatic, severe hypoglycaemia and mortality in type 2 diabetes: retrospective epidemiological analysis of the ACCORD study. BMJ. 2010;340:b4909.
4. Goto A, Goto M, Terauchi Y, et al. Association between severe hypogly-cemia and cardiovascular disease risk in Japanese patients with type 2 diabetes. J Am Heart Assoc. 2016;5(3):1–9.
5. Sheen YJ, Sheu WH. Association between hypoglycemia and dementia in patients with type 2 diabetes. Diabetes Res Clin Pract. 2016;116:279–87. 6. McCoy RG, Van Houten HK, Ziegenfuss JY, et al. Increased mortality of
patients with diabetes reporting severe hypoglycemia. Diabetes Care. 2012;35(9):1897–901.
7. Zoungas S, Patel A, Chalmers J, et al. Severe hypoglycemia and risks of vascular events and death. N Engl J Med. 2010;363(15):1410–8. 8. Miller CD, Phillips LS, Ziemer DC, et al. Hypoglycemia in patients with
type 2 diabetes mellitus. Arch Intern Med. 2001;161(13):1653–9. 9. Miller ME, Bonds DE, Gerstein HC, et al. The effects of baseline
character-istics, glycaemia treatment approach, and glycated haemoglobin con-centration on the risk of severe hypoglycaemia: post hoc epidemiological analysis of the ACCORD study. BMJ. 2010;340:b5444.
10. Leese GP, Wang J, Broomhall J, et al. Frequency of severe hypoglyce-mia requiring emergency treatment in type 1 and type 2 diabetes: a population-based study of health service resource use. Diabetes Care. 2003;26:1176–80.
11. Lipska KJ, Warton EM, Huang ES, et al. HbA1c and risk of severe hypogly-cemia in type 2 diabetes: the Diabetes and Aging Study. Diabetes Care. 2013;36(11):3535–42.
12. Gehlaut RR, Dogbey GY, Schwartz FL, et al. Hypoglycemia in type 2 diabetes-more common than you think: a continuous glucose monitor-ing study. J Diabetes Sci Technol. 2015;9(5):999–1005.
13. United Kingdom Prospective Diabetes Study (UKPDS) Group. UK Prospec-tive Diabetes Study 7. Response of fasting plasma glucose to diet therapy in newly presenting type 2 diabetic patients, UKPDS Group. Metabolism. 1990;39:905–12.
14. Boyne MS, Silver DM, Kaplan J, et al. Timing of changes in interstitial and venous blood glucose measured with a continuous subcutaneous glucose sensor. Diabetes. 2003;52:2790–4.
15. Marics G, Lendvai Z, Lodi C, et al. Evaluation of an open access software for calculating glucose variability parameters of a continuous glucose monitoring system applied at pediatric intensive care unit. Biomed Eng Online. 2015;14:37.
16. Rodbard D. Hypo- and hyperglycemia in relation to the mean, standard deviateon, coefficient of variation, and nature of the glucose distribu-teon. Diabetes Technol Ther. 2012;14(10):868–76.
17. Seino T, Nanjo K, Tajima N, et al. Report of the committee on the clas-sification and diagnostic criteria of diabetes mellitus. J Diabetes Invest. 2010;1:212–28.
18. Morimoto A, Nishimura R, Tsujino D, et al. Relationship among A1C, hypoglycemia, and hyperglycemia in Japanese with type 2 diabetes— results from continuous glucose monitoring data. Diabetes Technol Ther. 2011;13(6):667–760.
19. Weber KK, Lohmann T, Busch K, et al. High frequency of unrecog-nized hypoglycaemias in patients with type 2 diabetes is discovered by continuous glucose monitoring. Exp Clin Endocrinol Diabetes. 2007;115(8):491–4.
20. Shikawa W, Kitazawa J, Yagihashi N, et al. Localized amyloidosis at the site of repeated insulin injection in a diabetic patient. Intern Med. 2010;49(5):397–401.
21. Bellido V, Suarez L, Rodriguez MG, et al. Comparison of basal-bolus and premixed insulin regimens in hospitalized patients with type 2 diabetes. Diabetes Care. 2015;38(12):2211–6.
22. Takahashi H, Shibasaki T, Park JH, et al. Role of Epac2A/Rap1 signaling in interplay between incretin and sulphonylurea in insulin secretion. Diabe-tes. 2015;64(4):1262–72.
23. Salvo F, Moore N, Arnaud M, et al. Addition of dipeptidyl peptidase-4 inhibitors to sulphonylureas and risk of hypoglycaemia: systematic review and meta-analysis. BMJ. 2016;353:i2231.
24. Cryer PE, Axelrod L, Grossman AB, et al. Evaluation and management of adult hypoglycemic disorders: an Endocrine Society Clinical Practice Guideline. J Clin Endocrinol Metab. 2009;94(3):709–28.