R E S E A R C H
Open Access
Quantification of atopy, lung function and airway
hypersensitivity in adults
Susana Marinho
*, Angela Simpson, Paul Marsden, Jacky A Smith and Adnan Custovic
Abstract
Background:Studies in children have shown that concentration of specific serum IgE (sIgE) and size of skin tests to inhalant allergens better predict wheezing and reduced lung function than the information on presence or absence of atopy. However, very few studies in adults have investigated the relationship of quantitative atopy with lung function and airway hyperresponsiveness (AHR).
Objective:To determine the association between lung function and AHR and quantitative atopy in a large sample of adults from the UK.
Methods:FEV1 and FVC (% predicted) were measured using spirometry and airway responsiveness by
methacholine challenge (5-breath dosimeter protocol) in 983 subjects (random sample of 800 parents of children enrolled in a population-based birth cohort enriched with 183 patients with physician-diagnosed asthma). Atopic status was assessed by skin prick tests (SPT) and measurement of sIgE (common inhalant allergens). We also measured indoor allergen exposure in subjects’homes.
Results:Spirometry was completed by 792 subjects and 626 underwent methacholine challenge, with 100 (16.0%) having AHR (dose-response slope>25). Using sIgE as a continuous variable in a multiple linear regression analysis, we found that increasing levels of sIgE to mite, cat and dog were significantly associated with lower FEV1 (mite p = 0.001, cat p = 0.0001, dog p = 2.95 × 10⁻⁸). Similar findings were observed when using the size of wheal on skin testing as a continuous variable, with significantly poorer lung function with increasing skin test size (mite p = 8.23 × 10⁻⁸, cat p = 3.93 × 10⁻¹⁰, dog p = 3.03 × 10⁻¹⁵, grass p = 2.95 × 10⁻⁹). The association between quantitative atopy with lung function and AHR remained unchanged when we repeated the analyses amongst subjects defined as sensitised using standard definitions (sIgE>0.35 kUa/l, SPT-3 mm>negative control).
Conclusions:In the studied population, lung function decreased and AHR increased with increasing sIgE levels or SPT wheal diameter to inhalant allergens, suggesting that atopy may not be a dichotomous outcome influencing lung function and AHR.
Keywords:IgE, atopy, quantitative assay, lung function, airway hyperresponsiveness
Background
The association between reduced lung function and allergen sensitisation (mainly to inhalant allergens) has been clearly documented, both among children[1-7] and adults[8], often in the context of high allergen exposure [1,8]. A similar association has also been demonstrated for increased airway hyperresponsiveness amongst atopic individuals compared to those not sensitised[7-13].
Most of the studies investigating the relationship between allergen sensitisation and lung function or air-way hyperresponsiveness (AHR) considered atopy as a simple dichotomous variable, assigning individuals as atopic or non-atopic based on arbitrary and differing cut-off points, either for IgE measurement or skin prick testing. [1-5,8-11]. Similar is the case for the studies reporting on the association between atopy and wheeze or other symptoms of allergic disease[14,15]. Analysing sensitisation quantitatively has been shown to improve the specificity of these tests. For example, the level of specific IgE may predict the likelihood of patients having * Correspondence: [email protected]
The University of Manchester, Manchester Academic Health Science Centre, University Hospital of South Manchester NHS Foundation Trust, Manchester, UK
symptomatic food allergy[16] and the size of the skin prick test wheal can be used in a similar way[17]. We have previously demonstrated similar quantitative rela-tionship between specific serum IgE levels to common inhalant allergens and the presence and persistence of childhood wheezing and reduced lung function[6]. We have also shown a similar association between increasing levels of sIgE or size of skin test wheal to inhalant aller-gens and the presence of childhood allergic rhinitis[18]. However, very few studies in adults have investigated a quantitative relationship between atopy and lung func-tion. A study in the US has demonstrated that AHR increased significantly amongst adult asthmatics with increasing size of skin test wheals to inhalant allergens [11]. A significant association was also reported amongst non-asthmatic individuals with increasing level of mite specific IgE[12].
We aimed to investigate the associations between the quantification of atopy (using specific IgE levels and the size of skin test wheal to a range of common inhalant allergens) and lung function parameters (FEV1, FVC)
and AHR in a population of adults with and without asthma, evaluating this in the context of smoking habits and indoor allergen exposure.
Methods
Study Population
Detailed phenotyping which included information on symptoms and assessment of lung function, airway reac-tivity and atopy was carried out amongst parents of chil-dren enrolled in a population-based birth cohort study (Manchester Asthma and Allergy Study) [19,20]). We enriched the study population with carefully phenotyped asthmatics fulfilling the following criteria: (1) physician-diagnosed asthma; (2) asthma symptoms (wheeze, cough, chest tightness, or breathlessness) in the previous 12 months; (3) currently using asthma treatment; and (4) no asthma exacerbation or respiratory infection within 4 weeks before the study.[8]. Only subjects of mixed European origin were included in this analysis. The study was approved by the Local Research Ethics Committee. Written informed consent was obtained from all subjects.
Data sources
Symptoms
A validated questionnaire[21] was interviewer-adminis-tered to collect information on symptoms, physician-diagnosed illnesses, treatments received, pet ownership and smoking habits.
Lung function
FEV1 and FVC were assessed using spirometry
accord-ing to ATS/ERS guidelines[22,23], and expressed as % predicted.
Airway responsiveness
assessed by methacholine challenge using the 5-breath dosimeter protocol, as per ATS guidelines[24].
Atopy
We performed skin prick tests (SPT) toD.
pteronyssi-nus, cat, dog, grass pollen mix, tree pollen mix (Staller-génes, France), and mould mix (Dome-Hollister-Stier, USA). We measured specific serum IgE (sIgE) to D.
pteronyssinus, cat, dog and grass pollen mix by Immu-noCAP© (Phadia, Uppsala, Sweden).
Indoor allergen exposure
We visited homes and collected dust samples from the subjects’bed and the lounge floor by vacuuming 1 m2 areas for two minutes in a standardised fashion. Mite (Der p 1), cat (Fel d 1) and dog (Can f 1) allergens were assayed using enzyme-linked immunoassays[25].
Definition of outcomes and exposures
Current asthma
Physician-diagnosed asthma with asthma symptoms and/or use of asthma medication in the last 12 months [26].
Airway hyperresponsiveness (AHR)
expressed as methacholine dose-response slope (MDRS) [27,28]. Participants were considered to have AHR if MDRS was >25.
Allergic sensitisation as a dichotomous variable
SPT wheal mean diameter (WMD)≥3 mm compared to
negative control and/or specific IgE (sIgE)>0.35 kUA/l to
any allergen. Tobacco smoking
Questionnaire information on smoking habits was used to derive continuous measures of smoke exposure for all subjects as smoke-pack-years (SPY): non-smokers = 0; calculated for both current and ex-smokers (SPY=num-ber of cigarettes smoked per day/20 × num(SPY=num-ber of years of smoking).
Allergen exposure
Individual exposure to house dust mite (Der p 1), cat (Fel d 1) and dog (Can f 1) allergens were expressed as allergen concentration per gram of fine dust (μg/g)[29].
Statistical analysis
The primary outcome measures were lung function parameters and AHR. All dynamic lung volumes (FEV1
and FVC % predicted and FEV1/FVC) followed a normal
distribution and results are expressed as mean and stan-dard deviation (SD). Methacholine dose-response slope (MDRS) distribution was normalised using the transfor-mation 100/(MDRS+10) = tMDRS[27,30]. The levels of specific IgE were subject to a loge-transformation prior
The correlation between SPT-WMD and sIgE levels for each allergen was assessed using Spearman’s rho test. The relationship between quantitative sensitisation and outcome measures was analyzed using linear regres-sion and General Linear Model Univariate ANOVA, with a p-value of 0.05 considered as significant. Regres-sion slope, R2 (as measure of effect direction and size, respectively) and 95% confidence intervals (95% CI) were estimated using linear regression models. General Linear Model multivariate ANCOVA analyses were per-formed, including all the factors identified as significant in the univariate analysis. Fitted predicted value curves according to the level of specific IgE/size of SPT-WMD were plotted using the results from the regression analy-sis. Statistical analysis was carried out using SPSS 15.0 (SPSS Inc., Chicago, IN, USA).
Results
Participants
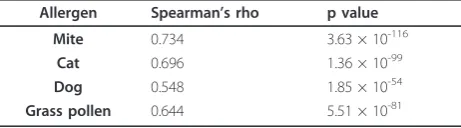
We contacted 1446 parents of the children recruited in the Manchester Asthma and Allergy Study (population-based birth cohort representative of the general popula-tion). Of these, 178 declined the invitation and 99 did not respond. Of the 1169 subjects who expressed an interest, 831 (71.1%) signed informed consent, of whom 800 were included in the analysis (12 with insufficient data and 19 non-Caucasians were excluded). We then enriched the study population with 183 asthmatic patients, with the analysed sample including 983 Caucasian subjects (416 [42.3%] male; mean age 48.3 years, range 19.8-72.9). Demographic characteristics of the study population are presented in Table 1. Skin tests were performed on 730 subjects (74.3%) and 748 (76.1%) provided blood sample for IgE measurement; 680 subjects had both skin tests and IgE data. We found no significant differences between the subjects with and without skin tests and IgE data in any of the outcomes studied. Spirometry was done by 792 subjects (80.6%) and 626 (63.7%) underwent a methacholine challenge, with 100 (16.0%) having AHR (MDRS>25). Of the 748 subjects with IgE data, 473 (63.2%) were atopic with raised specific IgE to one or more allergens. Table 2 presents details of atopic status considering both dichotomous and quantitative defini-tions. Table 3 presents the correlation between SPT-WMD and sIgE levels for each allergen.
Specific IgE, Skin Prick tests and Lung Function
Table 4 present the associates of the lung function para-meters studied. When using IgE measurement to define subjects as atopic or not (i.e., dichotomous definition), there was a strong association between atopy and poorer lung function (FEV1and FVC % predicted, FEV1/FVC)
and the same was seen when using SPT to define atopy (Table 4). This was also true when looking at specific
sensitisation to a range of inhalant allergens on either IgE or SPT, with particularly strong associations with sensitisa-tion to cat (e.g., for FEV1% predicted on specific IgE p =
0.0007, on SPT p = 5.02 × 10⁻⁷) and dog (for FEV1%
pre-dicted on SPT p = 4.16 × 10⁻¹², for sIgE p = 8.57 × 10⁻⁸). Using sIgE as a continuous variable in a linear regres-sion analysis, we found that increasing levels of sIgE to mite, cat and dog were significantly associated with poorer level of FEV1 % predicted (for mite p = 0.001,
cat p = 0.0001, dog p = 2.95 × 10⁻⁸, Table 4 and Figure 1); the same was also observed for FEV1/FVC, though
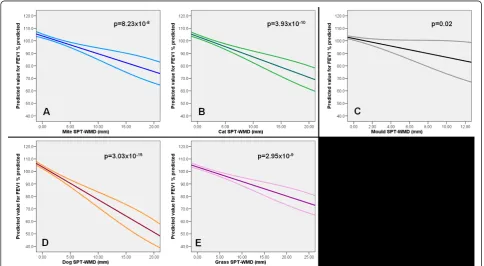
only increasing levels of sIgE to dog were associated with poorer FVC % predicted (Table 4). Similar findings were observed when using SPT as continuous variable, with significantly poorer lung function with increasing size of SPT-WMD for inhalant allergens (Table 4). This is illustrated for FEV1% predicted in Figure 2: mite p =
8.23 × 10⁻⁸, cat p = 3.93 × 10⁻¹⁰, dog p = 3.03 × 10⁻¹⁵, grass p = 2.95 × 10⁻⁹, mould p = 0.02.
When the levels of specific IgE for the individual aller-gens (mite, cat, dog, grass) were summed, the strength of this effect was slightly weakened or lost for FEV1and
FVC % predicted and FEV1/FVC (p = 0.01, p = 0.17 and
p = 0.002, respectively). However, this was not the case when adding the sizes of SPT-WMD for the same aller-gens (FEV1 % predicted p = 1.89 × 10⁻¹⁵, FVC %
pre-dicted p = 3.20 × 10⁻⁶, FEV1/FVC p = 1.99 × 10⁻¹⁶).
Specific IgE, Skin prick tests and Airway Hyperresponsiveness
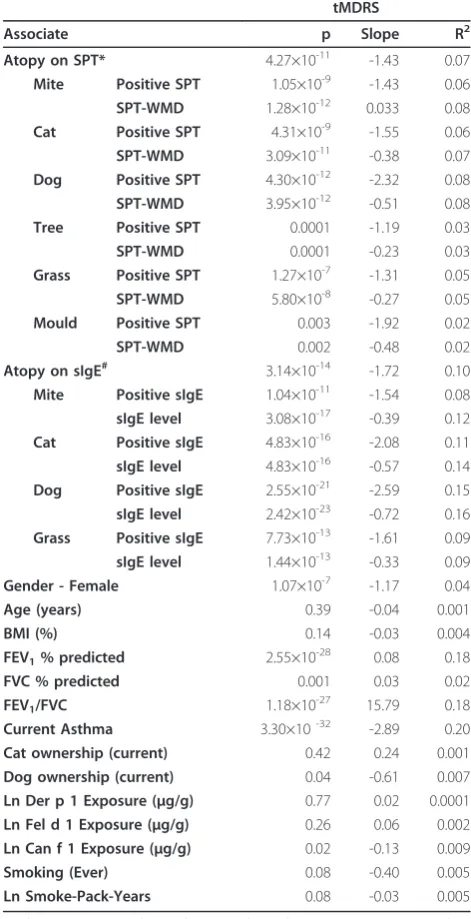
Associates of airway hyperresponsiveness (MDRS) from univariate regression analysis are shown in Table 5. Increased MDRS was strongly associated with atopy (on either SPT or sIgE, p≤3.14 × 10⁻¹⁴) and with sensitisa-tion to all inhalant allergens tested when using dichoto-mous definitions (Table 5). When analysing this using sensitisation as quantitative measure, we found that increasing levels of sIgE/increasing size of SPT-WMD were strongly associated with increasing MDRS (Table 5 and Figure 3, illustrative of these associations for sIgE level). When the levels of sIgE or SPT-WMD sizes to each individual allergen were summed, this association remained strongly significant (p = 1.63 × 10⁻²⁴ for sum of sIgE or SPT-WMD).
Specific IgE antibodies, Skin Test Size and Lung Function and Airway Hyperresponsiveness amongst sensitised subjects
based on sIgE and 402 based on SPT (Table 1). Even within the group of atopic individuals, increasing level of sIgE or SPT-WMD size to individual allergens was associated with significantly poorer lung function or increasing AHR (data shown for FEV1 % predicted and
MDRS in Table 6).
Multivariate analysis
To assess the relative contribution of sIgE levels and size of SPT-WMD to lung function (FEV1 % predicted)
and AHR (MDRS), we performed a multivariate ANCOVA, controlling for all the factors that we found
associated with these outcomes in the univariate ana-lyses, including current asthma, smoking habits and indoor allergen exposure. In these models (Table 7), increasing level of sIgE to dog remained a strong and highly significant independent associate of FEV1 and
FVC % predicted and FEV1/FVC; the same was true for
increasing level of sIgE/size of SPT-WMD to mite, which remained an independent associates of MDRS. Increasing level of sIgE to mite was an independent associate of FEV1/FVC. The significant independent
associates and the size of their effect varied slightly depending on whether SPT or sIgE data were used.
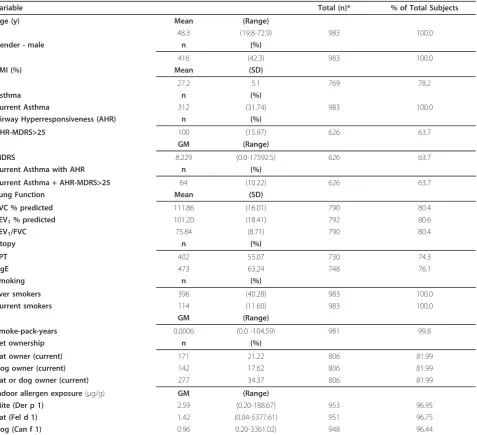
Table 1 Characteristics of the 983 subjects included in the study
Variable Total (n)* % of Total Subjects
Age (y) Mean (Range)
48.3 (19.8-72.9) 983 100.0
Gender - male n (%)
416 (42.3) 983 100.0
BMI (%) Mean (SD)
27.2 5.1 769 78.2
Asthma n (%)
Current Asthma 312 (31.74) 983 100.0
Airway Hyperresponsiveness (AHR) n (%)
AHR-MDRS>25 100 (15.97) 626 63.7
GM (Range)
MDRS 8.229 (0.0-17592.5) 626 63.7
Current Asthma with AHR n (%)
Current Asthma + AHR-MDRS>25 64 (10.22) 626 63.7
Lung Function Mean (SD)
FVC % predicted 111.86 (16.01) 790 80.4
FEV1% predicted 101.20 (18.41) 792 80.6
FEV1/FVC 75.84 (8.71) 790 80.4
Atopy n (%)
SPT 402 55.07 730 74.3
sIgE 473 63.24 748 76.1
Smoking n (%)
Ever smokers 396 (40.28) 983 100.0
Current smokers 114 (11.60) 983 100.0
GM (Range)
Smoke-pack-years 0.0006 (0.0 -104.59) 981 99.8
Pet ownership n (%)
Cat owner (current) 171 21.22 806 81.99
Dog owner (current) 142 17.62 806 81.99
Cat or dog owner (current) 277 34.37 806 81.99
Indoor allergen exposure(μg/g) GM (Range)
Mite (Der p 1) 2.59 (0.20-188.67) 953 96.95
Cat (Fel d 1) 1.42 (0.04-5377.61) 951 96.75
Dog (Can f 1) 0.96 0.20-3361.02) 948 96.44
*Total number of patients with available data; BMI - Body mass index; AHR - Airway Hyperresponsiveness; MDRS - methacholine dose-response slope; SPT - skin prick tests; sIgE - serum specific Immunoglobulin E; GM - Geometric mean.
Discussion
Principal Findings
Our results confirm that sensitisation to inhalant aller-gens is an associate of lung function and airway hyper-responsiveness in adults. Furthermore, our data suggest that amongst adults there is a quantitative relationship between the level of allergen-specific IgE or the size of skin prick test reaction and the level of lung function and airway hyperresponsiveness, with decreasing lung function and increasing AHR with increasing level of specific IgE or skin test wheal size. We have demon-strated that the absolute level of specific IgE or the size of the skin test wheal diameter to mite and dog remain independent associates of lung function and airway hyperresponsiveness in our sample of adults in the UK after adjusting for potential confounding variables, including current asthma, smoking habits and indoor allergen exposure. In addition, we have extended this observation in demonstrating that the same associations remain within the group of subjects defined as atopic using standard definitions[6].
Limitations and strengths
We were not able to obtain skin prick test data or specific IgE measurements for all subjects studied (74.3% had skin tests and 76.1% IgE). However, it is unlikely that this has
influenced our results, since we found no significant differ-ences between the subjects with and without these data in any of the outcomes studied. Moreover, the prevalence of allergic sensitisation among our subjects is similar to that of young adults in the UK[31], suggesting that our results are applicable to the general population.
As fewer subjects had skin prick testing data than measurements of specific IgE, fewer subjects were used in the analysis of the former, which may account for the small differences in the results (however, all of the trends remained the same). Similarly, some subjects in our study did not do lung function tests of had a metha-choline challenge; however, there was no difference in atopy between the groups with and without these tests.
This was a cross-sectional study, and we cannot com-ment on the role of quantitative measures of allergen-specific serum IgE or skin prick tests on the change in lung function or AHR over time. This is an important question which needs to be addressed in cohort studies, which are unfortunately lacking in adults.
We acknowledge that the observed associations may differ between different ethnic groups. We decided to carry out our analysis amongst Caucasian participants, as the number of participants of other ethnic origins was too small to make any meaningful conclusions. We therefore wish to emphasise that our finding cannot be extrapolated to other ethnic groups, and further work is essential to address this important question.
We acknowledge that atopy is strongly associated with asthma, which could therefore be a confounder. How-ever, by adjusting for asthma in the multiple regression models, we were able to take this into account and tease out independent associations between quantitative atopy, lung function and AHR. It is also possible that the association of quantitative atopy with lung function
Table 2 Allergen sensitisation: Dichotomous definitions on SPT and sIgE, SPT wheal mean diameters (WMD, mm) and sIgE level (kUA/l)
Dichotomous Quantitative Total (n) % of Total Subjects
SPT n (%) Median* (Range)
Mite 256 (35.07) 4.5 (0-19.5) 730 74.26
Cat 175 (23.97) 4.5 (0-20.0) 730 74.26
Dog 112 (15.34) 4.0 (0-16.5) 730 74.26
Tree pollen mix 84 (14.43) 5.0 (0-11.0) 582 59.21
Grass pollen mix 213 (29.18) 5.0 (0-23.0) 730 74.26
Mould mix 32 (4.40) 4.0 (0-12.0) 727 73.96
Specific IgE n (%) GM (Range)
Mite 343 (45.86) 0.48 (0.05-160.77) 748 76.09
Cat 211 (28.21) 0.16 (0.05-146.94) 748 76.09
Dog 170 (22.73) 0.14 (0.05-100.48) 748 76.09
Grass pollen mix 336 (44.92) 2.18 (0.05-407.48) 748 76.09
*Median SPT-WMD among subjects with positive SPTs only (median in whole population = 0 for all allergens due to non-sensitised subjects); GM - Geometric mean; SPT - skin prick tests.
Note: for specific IgE, GM was calculated based on logetransformation.
Table 3 Correlation between SPT-WMD (mm) and sIgE levels (kUA/l) for each allergen
Allergen Spearman’s rho p value
Mite 0.734 3.63 × 10-116
Cat 0.696 1.36 × 10-99
Dog 0.548 1.85 × 10-54
and AHR differs between asthmatics and healthy indivi-duals. Our study population comprised a sample which is likely to be representative of the general population (800 parents of children enrolled in a population-based birth cohort), enriched by carefully phenotyped asth-matic subjects, giving us a total of 312 patients with cur-rent asthma. We enriched the study population with asthma cases to increase the range of lung function values and the number of subjects with AHR, and thus increase the power to detect associations. In addition, by enriching the study population with well-defined group of asthmatics, this design has increased our confidence that we could detect any difference between asthmatics and non asthmatics. In this population, we did not
observe a significant difference between asthmatics and non-asthmatics with respect to the findings on the asso-ciation between quantitative atopy and our outcomes of interest (i.e. lung function and AHR). However, this finding needs to be interpreted with great caution, as our study might not have sufficient power to detect such differences. This question needs to be addressed in a much larger study, using for example a matched case-control design.
Interpretation
Many studies have identified allergic sensitisation (in particular to inhalant allergens) as a strong associate of lung function[1-8] and airway hyperresponsiveness
Table 4 Associates of FEV1and FVC % predicted and FEV1/FVC (univariate analysis)
FEV1% predicted FVC % predicted FEV1/FVC
Associate P Slope R2 P Slope R2 P Slope R2
Atopy on SPT* 0.00001 -5.93 0.03 0.03 -2.61 0.007 5.39×10⁻⁸ -9.81 0.03
Mite Positive SPT 0.00001 -6.27 0.03 0.01 -3.25 0.009 6.17×10⁻⁷ -9.76 0.03
SPT-WMD 8.23×10⁻⁸ -1.40 0.04 0.002 -0.75 0.01 4.12×10⁻⁹ -2.11 0.05
Cat Positive SPT 5.02×10⁻⁷ -7.69 0.03 0.02 -2.96 0.007 1.08×10⁻⁷ -13.61 0.05
SPT-WMD 3.93×10⁻¹⁰ -1.63 0.05 0.0007 -0.81 0.02 2.80×10⁻¹⁰ -2.55 0.06
Dog Positive SPT 4.16×10⁻¹² -12.22 0.06 0.0001 -6.06 0.02 1.38×10⁻¹³ -18.21 0.07
SPT-WMD 3.03×10⁻¹⁵ -2.49 0.08 1.70×10⁻⁶ -1.41 0.03 8.53×10⁻¹⁶ -3.68 0.09
Tree Positive SPT 0.73 0.52 0.0002 0.51 0.97 0.0008 0.85 -1.36 0.0005
SPT-WMD 0.93 -0.07 0.00001 0.70 0.02 0.0003 0.37 -0.51 0.002
Grass Positive SPT 2.06×10⁻⁶ -6.78 0.03 0.004 -3.64 0.01 2.79×10⁻⁷ -9.40 0.03
SPT-WMD 2.95×10⁻⁹ -1.04 0.05 0.0002 -0.59 0.02 9.62×10⁻¹⁰ -1.50 0.05
Mould Positive SPT 0.22 -3.22 0.002 0.61 -1.10 0.0004 0.17 -8.17 0.005
SPT-WMD 0.02 -1.53 0.007 0.24 -0.77 0.002 0.006 -2.60 0.01
Atopy on sIgE# 0.0007 -4.83 0.02 0.10 -2.03 0.004 0.0001 -7.22 0.02
Mite Positive sIgE 0.03 -2.97 0.006 0.45 -0.89 0.0008 0.008 -5.31 0.01
sIgE level 0.001 -0.88 0.01 0.21 -0.30 0.002 0.0004 -1.49 0.02
Cat Positive sIgE 0.0007 -5.16 0.02 0.57 -0.75 0.0004 0.00006 -11.76 0.04
sIgE level 0.0001 -1.37 0.02 0.28 -0.33 0.002 0.00003 -2.78 0.04
Dog Positive sIgE 8.57×10⁻⁸ -8.70 0.04 0.02 -3.39 0.008 7.30×10⁻⁸ -16.05 0.06
sIgE level 2.95×10⁻⁸ -2.29 0.04 0.004 -1.04 0.01 1.96×10⁻⁷ -3.87 0.06
Grass Positive sIgE 0.04 -2.82 0.006 0.72 -0.42 0.0002 0.002 -5.83 0.01
sIgE level 0.15 -0.38 0.003 0.82 -0.05 0.00007 0.05 -0.84 0.006
Gender - Female 0.09 2.27 0.004 1.00×10⁻⁶ 5.66 0.03 0.0009 0.02 0.01
Age (years) 1.22×10⁻¹³ -0.62 0.07 3.29×10⁻⁶ -0.30 0.03 1.31×10⁻³¹ -0.005 0.16
BMI (%) 0.0008 -0.42 0.01 4.80×10⁻⁹ -0.64 0.04 0.36 0.001 0.001
Current Asthma 1.18×10-41 -17.46 0.21 3.05×10⁻¹³ -8.53 0.07 3.68×10-43 -0.08 0.21
Cat ownership (current) 0.32 -1.65 0.001 0.96 -0.12 2.54×10⁻⁶ 0.10 -0.01 0.003
Dog ownership (current) 0.25 -1.99 0.002 0.68 -0.60 0.0002 0.14 -0.01 0.003
Ln Der p 1 Exposure (μg/g) 0.62 0.17 0.0003 0.33 0.29 0.001 0.68 -0.001 0.0002
Ln Fel d 1 Exposure (μg/g) 0.39 -0.22 0.0010 0.77 0.08 0.0001 0.01 -0.003 0.008
Ln Can f 1 Exposure (μg/g) 0.0001 -1.22 0.02 0.002 -0.87 0.01 0.003 -0.005 0.01
Smoking (Ever) 0.0008 -4.46 0.01 0.07 -2.08 0.004 0.0001 -0.02 0.02
Ln Smoke-Pack-Years 0.0002 -0.31 0.02 0.03 -0.16 0.006 0.0001 -0.002 0.02
*At least one positive skin prick test result; #At least one positive sIgE result; SPT-WMD - Skin prick test wheal mean diameter (mm); sIgE level (kUA/l). BMI - Body
[7-13], both in children and in adults, with reduced lung function and increased airway hyperresponsiveness in sensitised compared to non-sensitised individuals. How-ever, as outlined previously, most such studies have con-sidered sensitisation as either present or not[1-5,8-11]. A previous study by Burrows and colleagues[13]
investigated the associates of AHR in children, looking at the sizes of skin test wheals when analysing atopy, and demonstrated that the sizes of the reactions to mite, cat, dog andAspergillus fumigatus were independently correlated with airway hyperresponsiveness, particularly when summed. Another study by Nogalo et al.[12] looked specifically at the associations between airway hyperresponsiveness and level of specific mite specific IgE amongst mite-sensitised non-asthmatic children, and found that these were independently associated.
Our findings add to the above by demonstrating a quantitative rather than dichotomous relationship between atopy and the level of lung function and airway hyperresponsiveness in adults, when using both the size of skin prick tests and the level of specific IgE to inha-lant allergens. In multivariate analyses adjusted for other relevant associates (such as asthma and smoking), we demonstrated significant independent associations for quantitative dog skin test and IgE levels and lung func-tion, with quantitative mite IgE and skin test responses being associated with airway hyperresponsiveness. It is important to emphasise that the same quantitative rela-tionships were demonstrated even when adults without allergic sensitisation were excluded from the analysis, confirming the importance of the quantitative approach.
Similar to our previous findings for lower respiratory symptoms and lung function in children[6], but in Figure 1Predicted value for FEV1% predicted in relation to
sensitization to mite (A), cat (B) and dog (C) - sIgE level (kUA/l), derived from the linear regression analysis (regression line with 95% CI).
contrast to our findings for rhinitis and rhinoconjunc-tivitis[18], the associations between quantitative atopy and lung function and airway hyperresponsiveness remained strongly significant when the IgE levels/sizes of skin tests for individual allergens (mite, cat, dog and grass) were summed (with the single exception of the sum of sIgE levels and lung function parameters). Clearly, different clinical presentations of allergic
airway disease are associated with different patterns of quantitative atopy, with the sum of inhalant allergens being important in childhood wheezing[6], grass pollen in seasonal and dust mite in perennial rhinitis[18], spe-cific responses to dog in lung function and spespe-cific responses to dust mite in airway hyperresponsiveness. Dog allergen is readily inhaled into the lower airways, and may have an immediate impact on lung function. Dust mite allergens are carried on much larger
Table 5 Associates of MDRS (univariate analysis)
tMDRS
Associate p Slope R2
Atopy on SPT* 4.27×10⁻¹¹ -1.43 0.07
Mite Positive SPT 1.05×10⁻⁹ -1.43 0.06
SPT-WMD 1.28×10⁻¹² 0.033 0.08
Cat Positive SPT 4.31×10⁻⁹ -1.55 0.06
SPT-WMD 3.09×10⁻¹¹ -0.38 0.07
Dog Positive SPT 4.30×10⁻¹² -2.32 0.08
SPT-WMD 3.95×10⁻¹² -0.51 0.08
Tree Positive SPT 0.0001 -1.19 0.03
SPT-WMD 0.0001 -0.23 0.03
Grass Positive SPT 1.27×10⁻⁷ -1.31 0.05
SPT-WMD 5.80×10⁻⁸ -0.27 0.05
Mould Positive SPT 0.003 -1.92 0.02
SPT-WMD 0.002 -0.48 0.02
Atopy on sIgE# 3.14×10⁻¹⁴ -1.72 0.10
Mite Positive sIgE 1.04×10⁻¹¹ -1.54 0.08
sIgE level 3.08×10⁻¹⁷ -0.39 0.12
Cat Positive sIgE 4.83×10⁻¹⁶ -2.08 0.11
sIgE level 4.83×10⁻¹⁶ -0.57 0.14
Dog Positive sIgE 2.55×10⁻²¹ -2.59 0.15
sIgE level 2.42×10⁻²³ -0.72 0.16
Grass Positive sIgE 7.73×10⁻¹³ -1.61 0.09
sIgE level 1.44×10⁻¹³ -0.33 0.09
Gender - Female 1.07×10⁻⁷ -1.17 0.04
Age (years) 0.39 -0.04 0.001
BMI (%) 0.14 -0.03 0.004
FEV1% predicted 2.55×10⁻²⁸ 0.08 0.18
FVC % predicted 0.001 0.03 0.02
FEV1/FVC 1.18×10⁻²⁷ 15.79 0.18
Current Asthma 3.30×10⁻³² -2.89 0.20
Cat ownership (current) 0.42 0.24 0.001
Dog ownership (current) 0.04 -0.61 0.007
Ln Der p 1 Exposure (μg/g) 0.77 0.02 0.0001
Ln Fel d 1 Exposure (μg/g) 0.26 0.06 0.002
Ln Can f 1 Exposure (μg/g) 0.02 -0.13 0.009
Smoking (Ever) 0.08 -0.40 0.005
Ln Smoke-Pack-Years 0.08 -0.03 0.005
*At least one positive skin prick test result; #At least one positive sIgE result; SPT-WMD - Skin prick test wheal mean diameter (mm); sIgE level (kUA/l)
BMI - Body mass index; MDRS - methacholine dose-response slope; SPT - skin prick tests; sIgE - serum specific IgE. Current Asthma - Physician-diagnosed asthma with asthma symptoms and/or use of asthma medication in the last 12 months[26].
Note: tMDRS = 100/(MDRS+10), thus negative slope means increasing MDRS
Figure 3Predicted value for MDRS in relation to sensitization to mite (A), cat (B), dog (C) and grass pollen (D) - sIgE level (kUA/l), derived from the linear regression analysis (regression line with 95% CI).Note: analysis done with tMDRS (= 100/(MDRS +10), with converted values shown in Y axis, hence inverted scale.
Table 6 Quantification of IgE and SPT and FEV1%
predicted and tMDRS amongst sensitised subjects (univariate analysis)
FEV1% predicted tMDRS
p Slope R2 p Slope R2
SPT-WMD
Mite 0.001 -1.33 0.04 0.001 -0.19 0.03
Cat 2.26×10⁻⁶ -1.41 0.05 1.57×10⁻⁵ -0.27 0.06
Dog 3.69×10⁻¹¹ -2.43 0.1 2.64×10⁻⁶ -0.37 0.07
Tree 0.84 0.07 0.0001 0.08 -0.12 0.01
Grass 3.77×10⁻⁶ -1.04 0.05 0.03 -0.11 0.01
Mould 0.17 -0.99 0.005 0.09 -0.29 0.009
sIgE
Mite 0.09 -0.50 0.004 6.08×10⁻⁶ -0.28 0.06
Cat 0.01 -1.05 0.01 1.14×10⁻¹⁰ -0.46 0.12
Dog 9.33×10⁻⁶ -2.08 0.04 2.90×10⁻¹² -0.59 0.13
Grass 0.35 0.34 0.002 0.02 -0.19 0.03
SPT-WMD - Skin prick test wheal mean diameter (mm); sIgE level (kUA/l)
SPT - skin prick tests; sIgE - serum specific IgE
particles and may contribute to the chronic inflamma-tory process best represented by airway hyperrespon-siveness. The importance of dog and mite allergens in this study may also reflect the high concentrations of these allergens in UK homes. Our findings for lung function and airway hyperresponsiveness are consistent with recent studies demonstrating that quantification of IgE may be useful not only to diagnose allergic dis-eases in young children but to serve as a marker of persistence of wheeze[6] and severity of asthma[32,33].
Conclusions
In our study population, we observed a quantitative rela-tionship between IgE-mediated sensitisation and lung function or airway hyperresponsiveness in adults. Our results have important implications in clinical practice: the quantification of allergic sensitisation may offer more information to the clinician compared to the sim-ple presence or absence of atopy.
Abbrevations
AHR: Airway hyperresponsiveness;BMI: Body mass index;FEV1: Forced expiratory volume in one second;FVC: Forced vital capacity;MDRS: Methacholine dose-response slope;sIgE: specific serum immunoglobulin E; SPT: Skin prick tests;SPT-WMD: Skin prick test wheal mean diameter;SPY: Smoke pack years.
Acknowledgements
The authors would like to thank the ASMAL study participants, MAAS children and their parents for their continued support and enthusiasm. We greatly appreciate the commitment they have given to the project. We would also like to acknowledge the hard work and dedication of the study team (research fellows, nurses, physiologists, technicians and clerical staff). JP Moulton Charitable Foundation; S Marinho was supported by a grant from Fundação para a Ciência e Tecnologia, Portugal - POCI 2010.
Authors’contributions
SM participated in the design of the study, recruited and phenotyped the subjects, analysed and interpreted the data and drafted the manuscript. PM and JS phenotyped a subgroup of subjects. AS and AC conceived the study and its design, participated in its co-ordination and critically revised the manuscript. All authors read and approved the manuscript.
Competing interests
The authors declare that they have no competing interests.
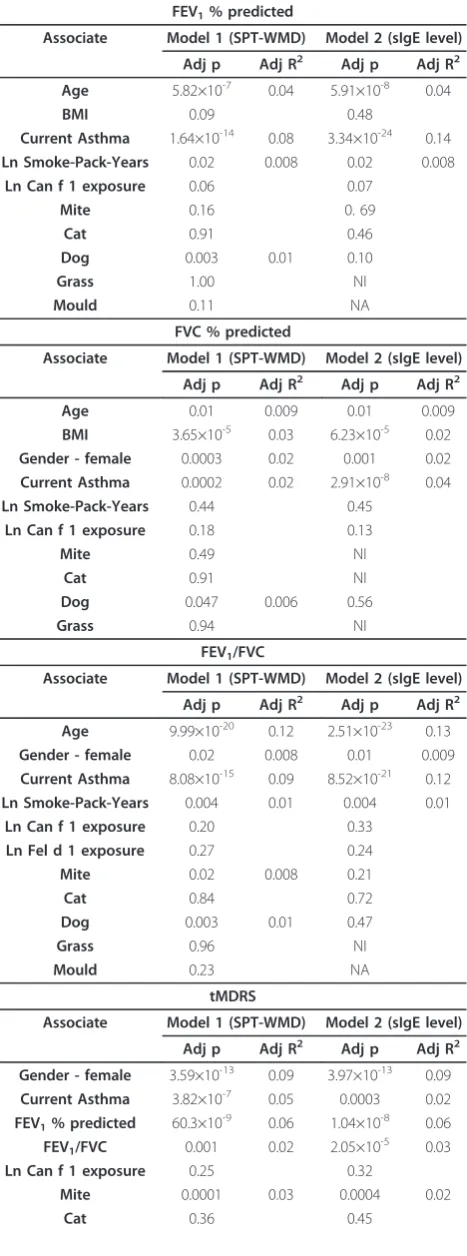
Table 7 Independent associates of lung function and AHR (multivariate analysis)
FEV1% predicted
Associate Model 1 (SPT-WMD) Model 2 (sIgE level)
Adj p Adj R2 Adj p Adj R2
Age 5.82×10⁻⁷ 0.04 5.91×10⁻⁸ 0.04
BMI 0.09 0.48
Current Asthma 1.64×10⁻¹⁴ 0.08 3.34×10⁻²⁴ 0.14
Ln Smoke-Pack-Years 0.02 0.008 0.02 0.008
Ln Can f 1 exposure 0.06 0.07
Mite 0.16 0. 69
Cat 0.91 0.46
Dog 0.003 0.01 0.10
Grass 1.00 NI
Mould 0.11 NA
FVC % predicted
Associate Model 1 (SPT-WMD) Model 2 (sIgE level)
Adj p Adj R2 Adj p Adj R2
Age 0.01 0.009 0.01 0.009
BMI 3.65×10⁻⁵ 0.03 6.23×10⁻⁵ 0.02
Gender - female 0.0003 0.02 0.001 0.02
Current Asthma 0.0002 0.02 2.91×10⁻⁸ 0.04
Ln Smoke-Pack-Years 0.44 0.45
Ln Can f 1 exposure 0.18 0.13
Mite 0.49 NI
Cat 0.91 NI
Dog 0.047 0.006 0.56
Grass 0.94 NI
FEV1/FVC
Associate Model 1 (SPT-WMD) Model 2 (sIgE level)
Adj p Adj R2 Adj p Adj R2
Age 9.99×10⁻²⁰ 0.12 2.51×10⁻²³ 0.13
Gender - female 0.02 0.008 0.01 0.009
Current Asthma 8.08×10⁻¹⁵ 0.09 8.52×10⁻²¹ 0.12
Ln Smoke-Pack-Years 0.004 0.01 0.004 0.01
Ln Can f 1 exposure 0.20 0.33
Ln Fel d 1 exposure 0.27 0.24
Mite 0.02 0.008 0.21
Cat 0.84 0.72
Dog 0.003 0.01 0.47
Grass 0.96 NI
Mould 0.23 NA
tMDRS
Associate Model 1 (SPT-WMD) Model 2 (sIgE level)
Adj p Adj R2 Adj p Adj R2
Gender - female 3.59×10⁻¹³ 0.09 3.97×10⁻¹³ 0.09
Current Asthma 3.82×10⁻⁷ 0.05 0.0003 0.02
FEV1% predicted 60.3×10 -9
0.06 1.04×10⁻⁸ 0.06
FEV1/FVC 0.001 0.02 2.05×10
-5 0.03
Ln Can f 1 exposure 0.25 0.32
Mite 0.0001 0.03 0.0004 0.02
Cat 0.36 0.45
Table 7 Independent associates of lung function and AHR (multivariate analysis)(Continued)
Dog 0.56 0.44
Grass 0.20 0.007 0.01
Mould 0.30 NA
Models using quantitative measures of sensitisation to inhalant allergens: either SPT-WMD in mm for Model 1 or level of sIgE in kUA/l for Model 2.
BMI - body mass index; tMDRS - transformed methacholine dose-response slope (tMDRS = 100/(MDRS+10); SPT - skin prick tests; sIgE - serum specific IgE.
Current Asthma - Physician-diagnosed asthma with asthma symptoms and/or use of asthma medication in the last 12 months[26].
Received: 28 October 2011 Accepted: 12 December 2011 Published: 12 December 2011
References
1. Lowe LA, Woodcock A, Murray CS, Morris J, Simpson A, Custovic A:Lung function at age 3 years: effect of pet ownership and exposure to indoor allergens.Arch Pediatr Adolesc Med2004,158:996-1001.
2. Lowe L, Murray CS, Custovic A, Simpson BM, Kissen PM, Woodcock A: Specific airway resistance in 3-year-old children: a prospective cohort study.Lancet2002,359:1904-1908.
3. Anthracopoulos MB, Mantzouranis E, Paliatsos AG, Tzavelas G, Lagona E, Nicolaidou P, Priftis KN:Different effects of sensitization to mites and pollens on asthma symptoms and spirometric indices in children: a population-based cohort study.Ann Allergy Asthma Immunol2007, 99:122-129.
4. Illi S, von Mutius E, Lau S, Niggemann B, Gruber C, Wahn U:Perennial allergen sensitisation early in life and chronic asthma in children: a birth cohort study.Lancet2006,368:763-770.
5. Hallberg J, Anderson M, Wickman M, Svartengren M:Factors in infancy and childhood related to reduced lung function in asthmatic children: a birth cohort study (BAMSE).Pediatr Pulmonol2010,45:341-348. 6. Simpson A, Soderstrom L, Ahlstedt S, Murray CS, Woodcock A, Custovic A:
IgE antibody quantification and the probability of wheeze in preschool children.J Allergy Clin Immunol2005,116:744-749.
7. Simpson A, Tan VY, Winn J, Svensen M, Bishop CM, Heckerman DE, Buchan I, Custovic A:Beyond atopy: multiple patterns of sensitization in relation to asthma in a birth cohort study.Am J Respir Crit Care Med2010, 181:1200-1206.
8. Langley SJ, Goldthorpe S, Craven M, Morris J, Woodcock A, Custovic A: Exposure and sensitization to indoor allergens: association with lung function, bronchial reactivity, and exhaled nitric oxide measures in asthma.J Allergy Clin Immunol2003,112:362-368.
9. Langley SJ, Goldthorpe S, Custovic A, Woodcock A:Relationship among pulmonary function, bronchial reactivity, and exhaled nitric oxide in a large group of asthmatic patients.Ann Allergy Asthma Immunol2003, 91:398-404.
10. Fowler SJ, Lipworth BJ:Relationship of skin-prick reactivity to
aeroallergens and hyperresponsiveness to challenges with methacholine and adenosine monophosphate.Allergy2003,58:46-52.
11. Craig TJ, King TS, Lemanske RF Jr, Wechsler ME, Icitovic N, Zimmerman RR Jr, Wasserman S:Aeroallergen sensitization correlates with PC(20) and exhaled nitric oxide in subjects with mild-to-moderate asthma.J Allergy Clin Immunol2008,121:671-677.
12. Nogalo B, Miric M, Maloca I, Turkalj M, Plavec D:Normal variation of bronchial reactivity in nonasthmatics is associated with the level of mite-specific IgE.J Asthma2008,45:273-277.
13. Burrows B, Sears MR, Flannery EM, Herbison GP, Holdaway MD:Relations of bronchial responsiveness to allergy skin test reactivity, lung function, respiratory symptoms, and diagnoses in thirteen-year-old New Zealand children.J Allergy Clin Immunol1995,95:548-556.
14. Gergen PJ, Turkeltaub PC:The association of individual allergen reactivity with respiratory disease in a national sample: data from the second National Health and Nutrition Examination Survey, 1976-80 (NHANES II). J Allergy Clin Immunol1992,90:579-588.
15. Sears MR, Herbison GP, Holdaway MD, Hewitt CJ, Flannery EM, Silva PA:The relative risks of sensitivity to grass pollen, house dust mite and cat dander in the development of childhood asthma.Clin Exp Allergy1989, 19:419-424.
16. Sampson HA:Update on food allergy.J Allergy Clin Immunol2004, 113:805-819.
17. Sporik R, Hill DJ, Hosking CS:Specificity of allergen skin testing in predicting positive open food challenges to milk, egg and peanut in children.Clin Exp Allergy2000,30:1540-1546.
18. Marinho S, Simpson A, Soderstrom L, Woodcock A, Ahlstedt S, Custovic A: Quantification of atopy and the probability of rhinitis in preschool children: a population-based birth cohort study.Allergy2007, 62:1379-1386.
19. Simpson BM, Custovic A, Simpson A, Hallam CL, Walsh D, Marolia H, Campbell J, Woodcock A:NAC Manchester Asthma and Allergy Study (NACMAAS): risk factors for asthma and allergic disorders in adults.Clin Exp Allergy2001,31:391-399.
20. Custovic A, Simpson BM, Murray CS, Lowe L, Woodcock A:The National Asthma Campaign Manchester Asthma and Allergy Study.Pediatr Allergy Immunol2002,13(Suppl 15):32-37.
21. Janson C, Anto J, Burney P, Chinn S, de Marco R, Heinrich J, Jarvis D, Kuenzli N, Leynaert B, Luczynska C,et al:The European Community Respiratory Health Survey: what are the main results so far? European Community Respiratory Health Survey II.Eur Respir J2001,18:598-611. 22. Pellegrino R, Viegi G, Brusasco V, Crapo RO, Burgos F, Casaburi R, Coates A,
van der Grinten CP, Gustafsson P, Hankinson J,et al:Interpretative strategies for lung function tests.Eur Respir J2005,26:948-968. 23. Miller MR, Hankinson J, Brusasco V, Burgos F, Casaburi R, Coates A, Crapo R,
Enright P, van der Grinten CP, Gustafsson P,et al:Standardisation of spirometry.Eur Respir J2005,26:319-338.
24. Crapo RO, Casaburi R, Coates AL, Enright PL, Hankinson JL, Irvin CG, MacIntyre NR, McKay RT, Wanger JS, Anderson SD,et al:Guidelines for methacholine and exercise challenge testing-1999. This official statement of the American Thoracic Society was adopted by the ATS Board of Directors, July 1999.Am J Respir Crit Care Med2000,161:309-329. 25. Simpson A, Simpson B, Custovic A, Craven M, Woodcock A:Stringent
environmental control in pregnancy and early life: the long-term effects on mite, cat and dog allergen.Clin Exp Allergy2003,33:1183-1189. 26. de Marco R, Marcon A, Jarvis D, Accordini S, Almar E, Bugiani M, Carolei A,
Cazzoletti L, Corsico A, Gislason D:Prognostic factors of asthma severity: A 9-year international prospective cohort study.J Allergy Clin Immunol 2006,117:1249-1256.
27. Chinn S, Burney P, Jarvis D, Luczynska C:Variation in bronchial responsiveness in the European Community Respiratory Health Survey (ECRHS).Eur Respir J1997,10:2495-2501.
28. O’Connor G, Sparrow D, Taylor D, Segal M, Weiss S:Analysis of dose-response curves to methacholine. An approach suitable for population studies.Am Rev Respir Dis1987,136:1412-1417.
29. Simpson A, Simpson B, Custovic A, Craven M, Woodcock A:Stringent environmental control in pregnancy and early life: the long-term effects on mite, cat and dog allergen.Clin Exp Allergy2003,33:1183-1189. 30. Chinn S:Choosing a transformation.J Appl Stat1996,23:395-404. 31. Broadfield E, McKeever TM, Scrivener S, Venn A, Lewis SA, Britton J:
Increase in the prevalence of allergen skin sensitization in successive birth cohorts.J Allergy Clin Immunol2002,109:969-974.
32. Wickman M, Ahlstedt S, Lilja G, van Hage HM:Quantification of IgE antibodies simplifies the classification of allergic diseases in 4-year-old children. A report from the prospective birth cohort study–BAMSE. Pediatr Allergy Immunol2003,14:441-447.
33. Wickman M:Experience with quantitative IgE antibody analysis in relation to allergic disease within the BAMSE birth cohort–towards an improved diagnostic process.Allergy2004,59(Suppl 78):30-31.
doi:10.1186/2045-7022-1-16
Cite this article as:Marinhoet al.:Quantification of atopy, lung function and airway hypersensitivity in adults.Clinical and Translational Allergy
20111:16.
Submit your next manuscript to BioMed Central and take full advantage of:
• Convenient online submission
• Thorough peer review
• No space constraints or color figure charges
• Immediate publication on acceptance
• Inclusion in PubMed, CAS, Scopus and Google Scholar
• Research which is freely available for redistribution