R E S E A R C H A R T I C L E
Open Access
Lost in the crowd? Using eye-tracking to
investigate the effect of complexity on
attribute non-attendance in discrete choice
experiments
Jean Spinks
1,2*and Duncan Mortimer
1Abstract
Background:The provision of additional information is often assumed to improve consumption decisions, allowing consumers to more accurately weigh the costs and benefits of alternatives. However, increasing the complexity of decision problems may prompt changes in information processing. This is particularly relevant for experimental methods such as discrete choice experiments (DCEs) where the researcher can manipulate the complexity of the decision problem. The primary aims of this study are (i) to test whether consumers actually process additional information in an already complex decision problem, and (ii) consider the implications of any such‘complexity-driven’ changes in information processing for design and analysis of DCEs.
Methods:A discrete choice experiment (DCE) is used to simulate a complex decision problem; here, the choice between complementary and conventional medicine for different health conditions. Eye-tracking technology is used to capture the number of times and the duration that a participant looks at any part of a computer screen during completion of DCE choice sets. From this we can analyse what has become known in the DCE literature as‘attribute non-attendance’(ANA). Using data from 32 participants, we model the likelihood of ANA as a function of choice set complexity and respondent characteristics using fixed and random effects models to account for repeated choice set completion. We also model whether participants are consistent with regard to which characteristics (attributes) they consider across choice sets.
Results:We find that complexity is the strongest predictor of ANA when other possible influences, such as time pressure, ordering effects, survey specific effects and socio-demographic variables (including proxies for prior experience with the decision problem) are considered. We also find that most participants do not apply a consistent information processing strategy across choice sets.
(Continued on next page)
* Correspondence:[email protected]
1Centre for Health Economics, Monash University, Melbourne, Australia 2Centre for Applied Health Economics, Menzies Health Institute
(Queensland), Griffith University (Logan Campus - LO3 2.15), University Drive, Meadowbrook, Brisbane, QLD 4131, Australia
(Continued from previous page)
Conclusions:Eye-tracking technology shows promise as a way of obtaining additional information from consumer research, improving DCE design, and informing the design of policy measures. With regards to DCE design, results from the present study suggest that eye-tracking data can identify the point at which adding complexity (and realism) to DCE choice scenarios becomes self-defeating due to unacceptable increases in ANA. Eye-tracking data therefore has clear application in the construction of guidelines for DCE design and during piloting of DCE choice scenarios. With regards to design of policy measures such as labelling requirements for CAM and conventional medicines, the provision of
additional information has the potential to make difficult decisions even harder and may not have the desired effect on decision-making.
Keywords:Attribute non-attendance, Complexity, Information processing, Eye tracking, Complementary medicine, Labelling
Background
The use of discrete choice experiments (DCEs) in health care has increased dramatically over the past decade [1–4]. Arising from the disciplines of psychology and economics, the theoretical basis for DCEs can be found in random util-ity theory (RUT), developed by McFadden [5] and later Hanemann [6]. There is increasing evidence suggesting that decision making of the type emulated by DCEs is prone to diversions from the underlying theory [7, 8], which assumes that consumers are both fully informed and make‘rational’(optimising) decisions.
Mainstream economic models typically assume that con-sumption choices can be improved simply by providing people with more and better information. There are, how-ever, many situations where this assumption may not hold due to limits on information-processing capacity. For very complex problems, consumers may be boundedly (rather than fully) rational [9, 10] and there is evidence to suggest that consumers attempting to evaluate all available infor-mation and all available options are increasingly likely to make mistakes through this process [11]. Many consumers will instead employ a ‘satisficing’ [12] or ‘fast and frugal’ [13] heuristic whereby the mental task of calculating the cost and consequences of all possible options is overwhelm-ing; taking mental short-cuts to make decisions easier [14]. Recent findings from behavioural economics confirm that increases in the complexity of decision tasks may paralyse decision-making [15], although others argue that it is the nature of the information that is important, rather than the absolute amount [16]. One area of recent research activity focuses on so-called ‘attribute non-attendance’ (ANA) [17, 18] which in simple terms means that individ-uals may either ignore or attach threshold values to cer-tain product characteristics before considering them. In the presence of ANA, DCE data may not characterise the preferences of affected individuals and standard ap-proaches to analysis may produce biased estimates of the relative importance of product attributes [19].
Empirically, two main methods have been employed to assess the existence and extent of ANA - (i) using
qualitative methods such as think-aloud protocols along-side stated-preference surveys [20], in-depth interviews and other supplementary questioning [21] to directly question the respondent about their cognitive processing strategy in answering stated-preference surveys; and (ii) using quantitative models that allow the researcher some latitude for inference, such as latent-class models, to ana-lyse stated-preference data [22–25]. From this growing lit-erature, it does appear that ANA may in fact be important when assessing the validity of stated-preference studies [17, 26] and that modelled coefficients should be adjusted accordingly. However, there are limitations when using both methods to reliably assess the presence and extent of any ANA.
Eye-tracking technology provides a novel alternative capable of directly measuring ANA without interfering with the decision making process or being constrained by computational limitations. First described in the 1970s [27], eye-tracking technology allows the researcher to record where and for how long a respondent to a computer-based survey focuses their eyes. This means that researchers can assess if, and for how long, each at-tribute or choice is focused relative to all else, including the sequence of focusing. If this information can be meaningfully interpreted, it may be used to determine whether attribute non-attendance is directly evident, whether systematic departures from the underlying the-ory can be identified, and ultimately, to inform how the predictive power of choice models can be improved to account for violations of the underlying assumptions.
deviation from the underlying assumptions, acknow-ledging that work in this area is just beginning and there is still much to learn about the extent and effect that such deviations might have on the predictive ability of choice modelling.
Here, we make use of eye-tracking in simulated con-sumption decisions using a DCE framework to under-stand the process of consumer decision making in a complex, yet familiar, health environment – the pur-chase of medicine to treat a minor ailment. To begin with, we assess the presence of ANA under varying con-ditions of complexity and framing (different ailments). We then look at whether particular product attributes are more prone to ANA than others. Next, we focus on the potential determinants of any ANA found. As sug-gested by Lagarde [25], information processing is “… likely to be influenced by the decision problem itself (e.g. its complexity), respondent specific characteristics (e.g. familiarity to the choice task, cognitive skills) and the broader context in which the choice task is taken (e.g. time pressure)”. Using this framework, we aim to model ANA as a function of these influences in an attempt to identify their relative importance. Finally, we test the assumption made in previous work in this area [23] that respondents are consistent with their informa-tion processing rules, that is, “the decision on which attributes to consider does not change over the choices made by the same respondent”(page 205).
Methods Study context
Our data was collected alongside the pilot study of a DCE which tests the effect of providing consumers with additional information in the form of (i) regulatory state-ments; and /or (ii) summary information in the form of a‘traffic light’logo, on the label of both‘complementary’ (natural) or ‘conventional’ (pharmaceutical) medicines. Two different decision ‘frames’ were tested in the form of two common ailments: sleep problems and joint pain [see Additional file 1: Figures A1 and A2]. The design of the main DCE aimed to address a real and current policy issue – whether consumers make better (or different) medicine purchasing decisions if compulsory labelling changes are implemented in an attempt to simplify the purchasing decision [31].
Different wordings of the proposed regulatory statement have appeared in the literature or the media [32–34] [see Additional file 1: Figure A1 for descriptions]. Thus, we aim to test the potential effect on information processing of adding such statements to the already large amount of information that must be processed by consumers. As an alternative to regulatory statements, we also investigate the addition of a traffic-light advisory system, similar to what is being used on many foods [35, 36], as a
way of highlighting key information for consumers [see Additional file 1: Figure A2].
Participants
As geographical proximity was required (the eye-trackers were located at Monash University, Melbourne), a local recruitment strategy was necessary. Members of the University Staff (both academic and administrative) were invited to participate through a regular university e-newsletter. We focused on staff rather than under-graduate students (although PhD students were allowed to participate) so as to gain a more representative group in terms of demographics such as age and health status. Ethics approval was granted by Monash University [CF11/2535–2011001482] and all participants provided written informed consent.
Choice scenarios
A DCE is one way of simulating the consumption choice and estimating how consumers may behave when characteristics (attributes) of the different choices (alternatives) are altered. By accounting statistically for the different levels of attributes presented, researchers can estimate the relative contributions of the different attributes towards the chosen alternative. The intention of the present study is not, however, to estimate part-worth utilities and we were not constrained by consid-erations of efficiency or orthogonality that would motivate use of a formal experimental design when constructing choice scenarios. In the present study, we manually constructed choice scenarios (described below) to simulate the effect of complexity on decision-making and to allow observation and recollection of decision-processes using eye-tracking and semi-structured interviews.1 Methods and results from the larger DCE using an experimental design (permitting efficient estimation of part-worth utilities) are reported elsewhere [31].
The online survey included eight choice scenarios per respondent, split equally across the two health condi-tions. To test the influence of complexity of the choice scenario (and cognitive burden), we allowed the num-ber of attributes presented in choice scenarios to vary from three to eight (see Table 2). Half the participants were presented with an increasing number of attributes (increasing complexity); the other half was shown a decreasing number of attributes (decreasing complex-ity). In an attempt to minimise unthinking / mechanical choice, levels of attributes were varied across choice scenarios to obtain as much attribute balance as pos-sible within the constraints of the study design.
range of self-care options are available. These two condi-tions were chosen due to their prevalence in the general population as well as the availability of both comple-mentary and conventional medicines for self-selection and treatment. Within each condition, participants were asked to choose between three alternatives - a conven-tional medicine, a complementary medicine and‘neither of these’(opt out option).
This study forms part of a larger, multi-disciplinary project focused on complementary and alternative medicine (CAM) use in people with chronic illness. The identification of attributes and levels for inclusion in the DCE choice scenarios therefore drew on qualita-tive work completed as part of the broader project, as well as a survey in the target population (N= 2,915) describing motivations for and use of CAM alongside conventional medicine [37–39]. A summary of all iden-tified attributes and levels tested in the pilot is available in the Additional file 1: Table A1.
Some of the attributes, such as ‘who recommended the product’ and ‘where it is available’, were arranged (formatted) in a number of boxes underneath the initial health scenario description and above the product label. The remaining attributes, apart from price, were dis-played as part of a product label, designed to be as real-istic as possible and to group related attributes. Price was displayed under the labels, to represent how items are usually displayed on shop shelves. An example sce-nario is available in the Additional file 1: Table A2. Choice scenarios were uploaded as an online survey. Par-ticipants were asked to complete the online survey on spe-cialized computers with eye-tracking capabilities as their first task. No specific training materials were provided to participants apart from a general introduction and a prac-tice DCE choice set (using a transport scenario) and no prior mention of the traffic light or regulatory statements was made before the survey commenced.
Measurement of attribute non-attendance (ANA)
Eye-tracking technology has evolved rapidly in recent years. Earlier prototypes required participants to wear bulky headwear and/or electrodes and stay in rela-tively uncomfortable positions for periods of time. Newer eye-trackers can be installed into regular-looking desktop computers and do not require the use of additional external hardware. For the present study, there was no requirement for headwear or electrodes and, apart from completion of a short cali-bration of each individual’s eyes to the screen (about 30 s) and being asked to remain as still as possible during the survey to maximise the likelihood of being detected by the eye-tracker, participants should have remained relatively unaware that they are working on anything other than a regular computer. Informed
consent was obtained from all participants to use the eye-tracking technology. Here we used a Tobii T120 eye-tracker and associated software (Studio Version 2.3.2.0) to formulate the raw data which was then exported and analysed in Stata 13 statistical software [40]. The eye-tracking data so obtained consists of fixations (unique observations for each time a partici-pant focuses or fixates on anything within the cali-brated screen) and saccades and allowed identification of area of fixations, duration of fixations and order of fixations. Data for pupil dilation was also available but not made use of in this analysis.
Using the specialised Tobii software, we can build a matrix of “areas of interest” (AOI) overlaying the image for each choice set. Each AOI represents one cell and here the cells of interest are alternative-specific attributes. An example of an AOI coded choice set is provided in the Additional file 1: Figure A5. The software can then calculate a number of metrics for each AOI including the number of times each attribute was visited, how long each ‘fixation’2 (look) lasted and the size of the pupil. Given the large amount of data available, we limit our analysis here to the number of times an attribute was visited. From this we can calculate the inverse – whether the attri-bute was fixated at all during the choice set. As the level of an attribute can only influence attendance to an attribute if that attribute is first fixated, here we leave aside attribute levels as predictors of ANA.
Statistical analysis
(i)Description of the existence, extent and variation of attribute non-attendance (ANA) across questions and attributes:We summarise the eye-tracking data to show the extent of attendance to each attribute across different questions and for questions with different levels of complexity (number of attributes). We present results for whether ANA occurs across both alternatives (CAM and conventional), before considering whether ANA occurs for each alternative taken individually. The ANA data is then disaggregated to describe ANA by attribute.
effects panel regressions. Equation (1) specifies the model:
ANAij¼αiþδcomplexityijþτconditionij
þηtime pressureiþγdirectioniþωWiþεij ð1Þ where ANAij (attribute non-attendance) is the number of attributes with zero fixations for participant i in choice-set j; αi captures individual-specific fixed/random effects
controlling for observed and unobserved respondent characteristics; complexityj is the number of attributes present in choice-set t; conditionj is a dummy indicator coded as 1 if choice-setjrelates to the joint pain scenario (and 0 for the insomnia scenario); time_pressure is a dummy indicator of whether the appointment time was late (after 5.30 pm)5; direction
i is a dummy indicator of whether the participant received choice-sets ordered in increasing (forward) or decreasing (reverse) complexity; Wi is the matrix of respondent characteristics; and εij is
an idiosyncratic error. The intention here is not to estimate part-worth utilities and the parameter of primary interest is
δ. Where δ is positive and significant, attribute non-attendance increases with complexity (as hypothesised). We also include complexity as a quadratic term to allow a non-linear relationship between ANA and complexity.
Included in the matrix of respondent characteristics are dummy variables for gender; a continuous measure for age (and age squared to allow for non-linear effects); a dummy variable coded 1 for education levels below university level6; and a dummy variable coded 1 for post-graduate students.7Also included is a dummy variable indicating if the participant reported using different CM products in the previous 12 months to account for prior experience and to proxy fora priori preferences. Three variables are included:
i. vitamin (self-selected) = taken a vitamin, mineral or herbal supplement not prescribed by a medical doctor in the past 12 months;
ii. vitamin (prescribed) = taken a vitamin, mineral or herbal supplement prescribed by a medical doctor in the past 12 months;
iii. other CAM = used other complementary and alternative medicine products or therapies (here it includes Western herbal medicines; Chinese medicines; acupuncture or indigenous or traditional folk therapies)
We hypothesised that participants’a priori
preferences may make them more inclined towards choosing particular alternatives, and as the
alternatives here are labelled (that is, they are specified to be‘conventional’and‘complementary’ medicines rather than a generic option of ‘Medicine A’versus‘Medicine B’), then we may also expect
ANA to vary between alternatives, as well as between attributes. To account for this potential labelling effect, we also run the regression specified in Equation (1), but with ANA now‘alternative specific’ –that is, the dependent variable is now the number of attributes not attended to within an alternative, rather than across all alternatives. This is expressed in equations (2) and (3) below:
ANA convij¼αiþδcomplexityjþτconditionj
þηtime pressureiþγdirectioniþωWiþεij
ð2Þ
ANA CMij¼αiþδcomplexityjþτconditionj
þηtime pressureiþγdirectioniþωWiþεij
ð3Þ
Definitions of explanatory variables remain consistent with equation (1).
(iii)Consistency with which decision rules are applied: Finally, we also test a previous assumption made by others investigating ANA [41] whereby participants are consistent with regard to which attributes they consider across choice sets (and by implication, which to ignore). To do this, we construct a measure of ‘consistency’of individual i, detailed in Equation (4):
consistencyi¼mean sij−Si
2 ð
4Þ
where s is the proportion of attributes attended to in choice setjby individualiandSiis the mean ofsfor in-dividuali. Here, a higher value indicates less consistency across choice sets and more deviation in terms of the number of available attributes attended/not attended to. We then regress consistency as the dependent variable with the same set of explanatory variables detailed in equations 1, 2 and 3, with the exclusion of complexity and condition (which are invariant when considering consistency across choice-sets), as detailed in Equation (5) below:
consistencyi¼αiþηtime pressureiþγdirectioniþωWiþεij ð5Þ
Results
having taken a self-selected vitamin, mineral or herbal product in the previous 12 months.
We summarise attribute attendance by question in Table 2, first across the two alternatives combined and then for each alternative separately. For example, in the first line of Table 2 (for question 1) it can be seen that 32 participants (100 %) attended to all attributes in at least one of the alternatives but not all participants attended to every attribute in every alternative. 28 partic-ipants (88 %) attended to all attributes in the conven-tional medicine alternative and 29 participants (91 %) attended to all attributes in the conventional medicine alternative. It can be seen that attendance is relatively high for the first four questions, but drops from 100 % (all attributes attended to when considering combined alternatives) in question 1 down to 50 % in question 8. A similar pattern can be seen when considering each
alternative separately; with the proportion declining as we move from question 1 to 8.
Across all participants, the mean number of attributes not attended to across all choice sets is 0.45 (sd 0.93, skewness 2.50, kutosis 9.61). For the conventional alter-native the mean is 0.74 (sd 1.18, skewness 1.87, kurtosis 6.39) and for the CM alternative 0.75 (sd 1.12, skewness 1.82, kurtosis 6.04). The pairedt-test for the mean differ-ence of the two alternatives is significant (p= 0.05).
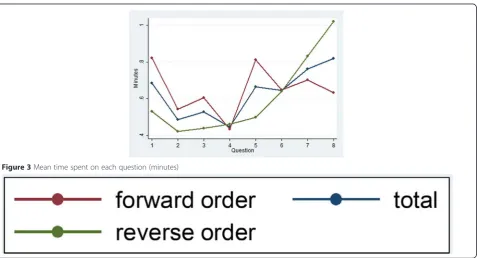
The effect of viewing the questions in forward (in-creasing complexity) compared to reverse order is shown in Figure 1. Mean ANA is zero for questions 1 and 3 and is lower in all questions framed by the ‘joint’ scenario as compared with the corresponding‘insomnia’ question (that is, mean ANA is less in Q1 cf Q2, Q3 cf Q4, Q5 cf Q6 and Q7 cf Q8 in the forward order and the contrary is true for the reverse order). There is slightly less ANA at question 8 by those participants who completed the survey in reverse order, however for questions 3 to 6 there is higher mean ANA for reverse order participants. In general, there is higher ANA for the questions with more attributes, irrespective of the order in which the survey was seen. Mean ANA by alter-native is shown in Figure 2. Both figures show a rela-tively large ANA increase/drop between questions 4 and 5 (or, for reverse order, between questions 5 and 4) which is where the product labels appear/disappear for the first time, greatly increasing/decreasing the amount of information to be considered. The trends in ANA across questions for both alternatives are similar. The mean time taken to answer each choice set is shown in Figure 3 and shows that, on average, more time was spent on answering question 1 if the survey was shown in forward order, and more time on question 8 if the survey was seen in reverse order. The total curve (forward and reverse order curves combined) is broadly u-shaped, with the time taken dropping steeply if the survey is seen in forward order (from question 1 to 2) or in reverse order (from question 8 to 7).
We then look to see if there are particular attributes which are more prone to ANA than others and this is presented in Table 3. Notably, price was missed by just over 16 % of participants on average for the 5 questions in which it was available, a phenomenon that has been found by others [25] and a concern for willingness-to-pay estimates from DCEs. Other attributes that appeared more likely to be missed included where the product was available (by up to 19 % of participants) and the caution and warnings on the labels (by up to 22 and 31 % of participants, respectively). The traffic light was missed by 15 and 22 % of participants in question 7 and 8 respectively.
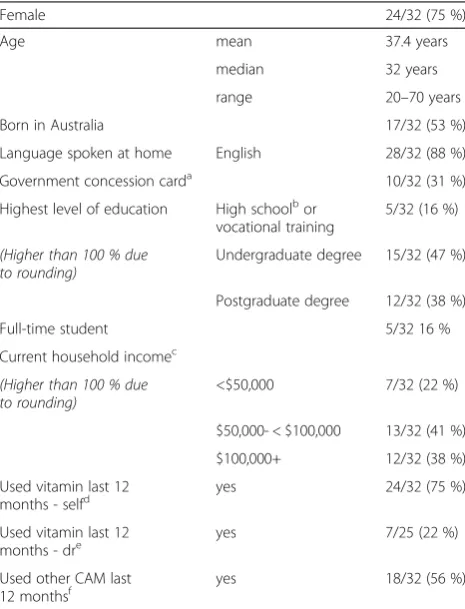
Results from the main regressions are presented in Table 4. Our main interest is the relationship between Table 1Summary of participant demographics (N= 32)
Female 24/32 (75 %)
Age mean 37.4 years
median 32 years
range 20–70 years
Born in Australia 17/32 (53 %)
Language spoken at home English 28/32 (88 %)
Government concession carda 10/32 (31 %)
Highest level of education High schoolbor vocational training
5/32 (16 %)
(Higher than 100 % due to rounding)
Undergraduate degree 15/32 (47 %)
Postgraduate degree 12/32 (38 %)
Full-time student 5/32 16 %
Current household incomec
(Higher than 100 % due to rounding)
<$50,000 7/32 (22 %)
$50,000- < $100,000 13/32 (41 %)
$100,000+ 12/32 (38 %)
Used vitamin last 12
months - selfd yes 24/32 (75 %)
Used vitamin last 12 months - dre
yes 7/25 (22 %)
Used other CAM last
12 monthsf yes 18/32 (56 %)
a
Indicates the individual is eligible for low-income government assistance b
Year 11 or 12 in the Australian system (final years)–no one reported a lower level
c
Australian dollars, 2011 (before tax) d
vitamin (self-selected) = taken a vitamin, mineral or herbal supplement not prescribed by a medical doctor in the past 12 months
e
vitamin (prescribed) = taken a vitamin, mineral or herbal supplement prescribed by a medical doctor in the past 12 months
f
ANA and complexity, which shows a positive and sig-nificant main effect for models 1–4, with a negative and significant quadratic term (that is, ANA is increasing with complexity but at a diminishing rate over the num-ber of attributes we tested here). The fixed and random effects models (models 1 and 2, respectively) provided similar estimates and tests for the appropriateness of using the random effects model did not reject the null that results are consistent (see the footnote to Table 4 for details). We also re-run the model after centring the mean of complexity at zero and although the beta coeffi-cients on complexity differ, the sign and significance are unchanged.
ANA was less likely for the joint scenario and more likely for participants who had a late appointment (both significant at the 10 % level in model 2), although the effect of the late appointment was not robust to different cut-off times. The order in which the survey was com-pleted was not found to be associated with ANA. Some variation was shown in the relationship between socio-demographic variables and alternative-specific ANA: lower levels of education were associated with higher ANA in the conventional medicine alternative and those who had taken a vitamin prescribed by a medical doctor in the previous 12 months were more likely to miss attributes in the CM alternative.
Table 2Number of participants who attended to every attribute for both conventional & CM alternatives combined, and each
alternative alone (N= 32)
Question Number attributes Health condition Alts combineda # participants (%)
Conv alternative # participants (%)
CM alternative # participants (%)
1 3 joint 32 (100) 28 (88) 29 (91)
2 3 insomnia 28 (88) 24 (75) 20 (63)
3 4 joint 32 (100) 26 (81) 24 (75)
4 4 insomnia 25 (78) 24 (75) 18 (56)
5 5 joint 20 (63) 13 (41) 14 (44)
6 6 insomnia 18 (56) 13 (41) 12 (38)
7 8 joint 17 (53) 13 (41) 12 (38)
8 8 insomnia 16 (50) 15 (47) 13 (41)
Abbreviations:Altsalternatives,convconventional,CMcomplementary medicine,#number a
For a participant to have attended to an attribute, they had to have one or more fixations on that attribute, irrespective of whether they looked at the levels of the attribute in both choices
Note: The‘neither of these’option did not have any attributes specified and is excluded from this analysis
The mean for the measure of consistency across the sample was 0.016 (sd 0.020, skewness 1.76, kutosis 5.84), with 10 participants having a mean of zero (that is, they were entirely consistent in terms of how many attributes were missed across all choice sets). In terms of the consistency regression (model 5), younger age was associ-ated with greater consistency, although as shown by the positive and significant coefficient on the corresponding quadratic term, this effect decreases as age increases.
Discussion and conclusions
This paper adds to the growing literature regarding attri-bute non-attendance in DCEs and to our knowledge is the first to explicitly focus on the relationship between com-plexity and ANA for decicions regarding health service utilisation Our results show there is a strong positive and statistically significant relationship between ANA and complexity and that this relationship is robust to a num-ber of different model specifications. Importantly, we find
that complexity is the strongest predictor of ANA when other possible influences, such as time pressure, ordering effects, survey specific effects and socio-demographic vari-ables (including proxies for prior experience of the deci-sion problem) are considered. We also find that ANA, as well as the consistency with which attribute attendance is applied across choice sets, does show some evidence of heterogeneity across different socioeconomic variables, specifically for education and age. Like others, we do find considerable departure from the assumptions underpin-ning RUT which assumes consumers maximise their util-ity based on all available information [25, 30]. Similar to Balcombe [30], we found that full attendance to all attri-butes across all choice sets is unusual, however, ANA was
significantly less present for choice sets with fewer attributes.9
The interpretation of this finding should be taken within the context of this particular study. In general participants reported being engaged with the survey and although many stated that the choice sets with more in-formation took longer to process, the inin-formation itself was not difficult to understand. Most also reported that they thought all attributes were potentially relevant to their decision and there were no recommendations to remove particular attributes (only to change one of the levels of one of the attributes).
What has yet to be clearly determined in the literature is whether, and the extent to which, utility functions Table 3Eye-tracking results–percent participants who did not attend to each attribute, disaggregated by within alternative
non-attendancea
Question number
1 2 3 4 5 6 7 8
Attribute
Recommendation 0 3 % 0 0 3 % 6 % 0 0c
Recommendation - conv 3 % 6 % 3 % 0 9 % 9 % 6 % 10 %
Recommendation - CM 6 % 16 % 13 % 16 % 19 % 19 % 19 % 19 %
Side effects 0 3 % 0 0 13 % 3 % 6 % 6 %
Side effects - conv 9 % 13 % 6 % 6 % 16 % 13 % 13 % 16 %
Side effects - CM 3 % 9 % 6 % 16 % 28 % 16 % 19 % 16 %
Where available 0 6 % 0 9 % 19 % 9 % 3 % 16 %
Where available - conv 9 % 22 % 9 % 16 % 28 % 19 % 16 % 26 %
Where available - CM 3 % 16 % 6 % 9 % 31 % 19 % 13 % 23 %
Price NA NA 0 13 % 16 % 22 % 13 % 19 %
Price - conv NA NA 9 % 16 % 34 % 44 % 41 % 39 %
Price - CM NA NA 9 % 13 % 34 % 34 % 28 % 26 %
Dosageb NA NA NA NA 0 0 6 % 6 %
Dosageb- conv NA NA NA NA 9 % 13 % 6 % 6 %
Dosageb- CM NA NA NA NA 3 % 3 % 9 % 10 %
Caution NA NA NA NA 13 % 22 % 3 % 10 %
Caution - conv NA NA NA NA 31 % NA 16 % NA
Caution - CM NA NA NA NA 13 % 22 % 9 % 10 %
Warning NA NA NA NA NA 31 % 19 % 10 %
Warning - conv NA NA NA NA NA 31 % 19 % 10 %
Warning - CM NA NA NA NA NA NA NA NA
Traffic light NA NA NA NA NA NA 16 % 23 %
Traffic light - conv NA NA NA NA NA NA NA 23 %
Traffic light - CM NA NA NA NA NA NA 16 % NA
Regulation–CM (only) NA NA NA NA NA NA 16 % 16 %
NAnot applicable–the attribute did not appear in the particular question Convconventional medicine,CMcomplementary medicine
a
The corresponding questions, whether seen in forward or reverse order, are combined here and presented as if the forward order has been seen by the participant (ie. question 1 data in the forward order and question 8 data in the reverse order has been aggregated)
b
Dosage was considered to be a fixed attribute (the levels did not change)–it was included for realism c
should be adjusted for ANA. The present study was con-ducted alongside the pilot for a DCE and varied the number of attributes across choice sets to identify the effect of complexity on ANA. As a consequence, we observed limited variation across attribute levels for some attributes and could not account for the effect of all attributes when estimating utility functions. Lagarde [25] found that whilst willingness-to-pay estimates were sensitive to ANA, the behavioural prediction of DCE models was not affected by ANA. One explanation for this may be that consumers are so accustomed to using heuristics or decision rules in complex or uncertain situ-ations that they are well practised in seeking out infor-mation that will be useful to them in their final decision (in essence, conferring zero utility for any attributes superfluous to their needs). Thus, reading attribute and alternative labels may be sufficient for some consumers to decide if the subsequent information available is worthwhile attending to or not.
We did, however, find evidence that ANA differed across alternatives, although the mean effect was shown
to be small. While we cannot rule out here that this effect may also represent left-right logographical ordering, differ-ences in socio-demographic determinants of alternative-specific ANA such as prior use of a prescribed vitamin are perhaps more consistent with a CM-CAM effect than a left-right effect. In any event, the effect of alternative-specific ANA on utility functions, as compared to ‘total’ ANA for a given attribute is worthy of further consider-ation (regardless of whether it represents a CM-CAM or left-right effect). Alternative-specific ANA may also offer additional insights into the decision processing strategy used by participants during DCEs.
Other results were also interesting. As seen in Figure 1, ANA was consistently lower for the questions framed by the ‘joint’scenario (questions 1, 3, 5 & 7 in the forward order) compared with the corresponding ‘insomnia’ questions. This may indicate a framing effect, whereby participants were more likely to not attend to attributes in the insomnia questions, perhaps due to strongly formed opinions as to how each ailment ‘should’ be treated (prior experience) or strong preferences for Table 4Summary of main results from eye-tracking regression of attribute non-attendance (ANA)
(1) Number ANA, fe (2) Number ANA, re (3) Number ANA (conv), re (4) Number ANA (CM), re (5) Consistencya
b se p b se p b se p b se p b se p
complexity 0.578b 0.210 0.006 0.578c 0.230 0.012 0.749b 0.247 0.002 0.863b 0.309 0.005
complexity2 −0.036d 0.019 0.057 −0.036d 0.020 0.081 −0.050c 0.024 0.037 −0.061c 0.027 0.027
joint −0.182d 0.097 0.062 −0.182d 0.097 0.060 −0.046 0.132 0.728 −0.013 0.094 0.887
late appointment 0.481d 0.275 0.080 0.438 0.308 0.155 0.680d 0.412 0.098 0.019 0.011 0.112
forward order 0.005 0.140 0.973 0.154 0.210 0.462 0.029 0.228 0.897 −0.006 0.007 0.412
female 0.104 0.144 0.471 0.017 0.187 0.927 0.234 0.188 0.214 0.003 0.007 0.655
age 0.001 0.037 0.982 −0.022 0.046 0.630 −0.015 0.053 0.775 −0.004c 0.002 0.038
age2 0.000 0.000 0.577 0.001 0.000 0.134 0.000 0.001 0.482 0.000c 0.000 0.017
<uni education 0.218 0.200 0.275 0.431d 0.223 0.053 0.010 0.255 0.970 −0.002 0.010 0.817
student −0.019 0.156 0.905 0.024 0.187 0.896 −0.125 0.237 0.598 −0.009 0.009 0.346
vit (self-selected) −0.250 0.176 0.154 −0.183 0.239 0.444 −0.328 0.277 0.236 −0.011 0.008 0.190
vit (prescribed) 0.116 0.171 0.496 −0.189 0.192 0.325 0.456c 0.218 0.036 0.014 0.008 0.104
other CAM 0.027 0.145 0.853 0.088 0.154 0.568 −0.022 0.188 0.906 0.007 0.006 0.312
Constant −1.348c 0.532 0.012 −1.737c 0.765 0.023 −1.975d 1.055 0.061 −1.970d 1.083 0.069 0.087c 0.041 0.046
Observationse 255 255 255 255 32
R2 .210 .276 .356 .245 .612
Abbreviations:ANAattribute non-attendance OR attributes not attended (to),complexity2complexity squared,age2age squared,uniuniversity,convconventional medicine,CMcomplementary medicine,vit (self-selected)taken a vitamin, mineral or herbal supplement not prescribed by a medical doctor in the past 12 months; vit (prescribed)taken a vitamin, mineral or herbal supplement prescribed by a medical doctor in the past 12 months;other CAMused other complementary and al-ternative medicine products or therapies (here it includes Western herbal medicine; Chinese medicine; CAM practitioners, or indigenous or traditional
folk therapies) a
As measured by the mean(sij-S)2
where s is the proportion of attributes attended to in choice setjby individualiand Si= mean (s) for individuali[whereby a higher value indicates less consistency and more deviation in terms of attribute non-attendance]
b ,c
,d
indicates significance at the 1, 5 and 10 % levels respectively e
Observations are based on data from 32 participants, however, eye-tracking data is absent for question 8 for one participant (124)
natural or conventional medicines in specific contexts. Aside from the framing effect, the general trend for more ANA in questions with more attributes supports the notion that increased complexity is linked with more ANA irrespective of the order in which questions were seen. The time taken to answer each question (Fig. 3) broadly displays a ‘U’ shape for the combined forward and reverse order surveys (total sample line), perhaps suggesting a learning effect which means the time taken decreases to a point before fatigue starts to increase. However, the forward curve consistently shows longer times taken for questions 1, 3, 5 & 7 (joint scenario questions) compared with the corresponding insomnia questions (which interestingly corresponds to lower ANA for the joint questions compared with the insom-nia questions in Fig. 1). This is not seen for the reverse order curve which shows consistently decreasing times taken for questions 8 to 2, increasing slightly again for the final question 1. It is not apparent why a framing effect might be present only in the forward order survey and this is worthy of further consideration.
The finding that‘consistency’with regard to the num-ber of attributes attended to across choice sets decreased with age may be potentially explained by a decrease in cognitive function over time, although this cannot be tested here. Results are not consistent with the assump-tion made by Hole [41] that the decision of which attri-bute/s to consider is stable across choice sets and are instead more supportive of the notion that this varies over choice sets, as suggested by others [26].
This study also has some important implications for the design of DCEs measuring health and health-care preferences more generally. This study, which also acted as a pilot for a larger DCE, highlights the design com-plexity of some of the scenarios encountered by health researchers and raises further questions about how the qualitative properties of the survey, such as the descrip-tion of attributes and levels, presentadescrip-tion of choice sets and clarity of instructions may impact on ANA. When combined with findings regarding the effect of ANA on utility estimates, our findings regarding the effect of complexity on ANA should permit identification of the point at whichadding complexity (and realism) to DCE choice scenarios becomes self-defeating.
One of the obvious limitations of this analysis is the small and unrepresentative sample size. Despite avoiding an entire undergraduate student population, the re-cruited sample remained better educated and from higher socioeconomic circumstances than the general population. The majority (75 %) of participants reported self-selection of a vitamin, mineral or herbal product in the previous 12 months which is higher than reports in the literature for Australian populations [42]. For this presumably less ‘boundedly’ rational sample, we might
expect additional information to evoke fewer changes in information processing than for the general population [43]. Therefore, our results are likely to underestimate ANA in the general population. Additionally, we only tested complexity over a range of 3–8 attributes, which is the upper limit of attributes reported to be routinely included in DCEs in the health setting [2]. It must be remembered that some attributes are only seen in two questions (for example, the regulatory statements and traffic light logos are only seen in questions 7 & 8). Thus, caution should be exercised in drawing conclu-sions regarding the effect of additional attributes in other DCE studies. Further, we did not set out to test the effect of the location (page orientation) of attributes as it relates to ANA, whereby there may be a systematic difference due to orientation alone (eg. the bottom of the page may be more prone to ANA).
The rapid advancements in eye-tracking technology over recent years have meant that this technology is likely to be used more extensively to investigate questions of information processing across a range of disciplines, including in health economics. Alongside this, methodo-logical questions also need to be answered regarding the use of other available metrics (fixations, saccades, pupil dilation), the definitions applied (for example, ANA) and how these may be linked to neurological process to pro-vide greater insight into decision-making processes. Recent progress on this front suggests that the full poten-tial of combining eye-tracking data with more familiar qualitative and quantitative data is yet to be realised.
Endnotes 1
This study was also used to pilot test the attributes and levels of the DCE for use in a subsequent study using a larger sample size.
2
The eye-tracker collects raw data every 16.7 milliseconds and assigns to each data point a location. A fixation filter is then applied to determine if each data point is a‘fixation’or ‘saccade’ (for two points to be considered as part of the same fixation, the distance between two data points must be below a minimal threshold). We used the default‘ Clear-View’settings for the I-VT (Velocity Threshold Identifica-tion) fixation filter [Tobii Studio 2.X, Release 2.2, User Manual (2010). http://www.tobii.com/].
3
Dummy variables indicating (i) whether the choice set relates to the joint pain scenario or to the insomnia sce-nario and (ii) whether the survey was seen in increasing order of complexity (forward) or decreasing order of complexity (reverse) were included in the model.
4
for each participant varied, we reasoned that appoint-ments later in the day were more likely to be associated with greater time pressure as changes in traffic condi-tions and outside work activities are more likely to be given higher consideration around this time.
5
This cut-off was chosen as it is a time when most people have finished work for the day. Only three indi-viduals were classified as having a late appointment using this definition. The robustness of the cut-off is tested during the analysis and reported in the results section.
6
Due to the sample being drawn from a university, this variable is also likely to indicate professional (non-aca-demic) staff status.
7
Undergraduate students were excluded from participating.
8
The eye-tracking software provides a percentage of the time over the duration of the survey for which eye-tracking data was collected. If participants did not remain still enough, for example, and data was not able to be captured for some of the time, the percentage was less than 100 %. As a general rule, we excluded partici-pants for this analysis if their percentage tracked was 50 % or less, however, this is an overall figure which includes time spent on both the DCE choice sets and introduction/demographics sections, and it was relaxed in the case of six participants where it was deemed there was sufficient data capture during the DCE section for them to be included.
9
It is also important to note that Balcombe used a dif-ferent definition of ANA whereby meeting or exceeding the threshold of two fixations per attribute defined attendance, whereas we used the stricter definition of zero fixations to define non-attendance.
Additional file
Additional file 1:Supplementary material.(DOCX 592 kb)
Abbreviations
ANA:attribute non-attendance; AOI: area of interest; CAM: complementary and alternative medicine; CM: complementary medicine DCE–discrete choice experiment; RUT: random utility theory; TGA: therapeutic good administration.
Competing interests
The authors declare that they have no competing interests.
Author contributions
JS and DM conceived of the study, participated in the design and data collection and drafted the manuscript. JS performed the analysis and wrote the first draft of the manuscript. All authors read and approved the final manuscript.
Acknowledgements
JS was supported by an Australian Postgraduate Award to undertake this research, as well as a Monash University Dean’s Postgraduate Research Excellence Award. DM did not receive any specific funding. Additional funds
were provided through a Monash University Business & Economics Faculty Grant. Mostly, the authors would like to thank survey participants for their time and effort in completing and returning the survey. Special thanks also to the PhD examiners whose comments and suggestions have been incorporated into this manuscript.
Received: 9 June 2015 Accepted: 26 January 2016
References
1. de Bekker-Grob EW, Ryan M, Gerard K. Discrete choice experiments in health economics: a review of the literature. Health Econ. 2012;21(2):145–72.
2. Johnson FR et al. Constructing experimental designs for discrete-choice experiments: report of the ISPOR conjoint analysis experimental design good research practices task force. Value Health. 2013;16(1):3–13. 3. Lancsar E, Louviere J. Conducting discrete choice experiments to inform
Healthcare decision making. Pharmacoeconomics. 2008;26(8):661–77. 4. Clark MD, Determann D, Petrou S, Moro D, de Bekker-Grob EW. Discrete
choice experiments in health economics: a review of the literature. Pharmacoeconomics. 2014;32(9):883–902.
5. McFadden D. Conditional Logit Analysis of Qualitative Choice Behaviour. Berkley: University of California at Berkley; 1973.
6. Hanemann WM. Welfare evaluations in contingent valuation experiments with discrete responses. Am J Agric Econ. 1984;66(3):332–41.
7. Lancsar E, Louviere J. Deleting‘irrational’responses from discrete choice experiments: a case of investigating or imposing preferences? Health Econ. 2006;15(8):797–811.
8. Ryan M, Bate A. Testing the assumptions of rationality, continuity and symmetry when applying discrete choice experiments in health care. Appl Econ Lett. 2001;8(1):59–63.
9. Simon HA. A behavioural model of rational choice. Q J Econ. 1955;69(1):99–118.
10. Simon HA. Theories of bounded rationality. In: McGuire CB, Radner R, editors. Decision and Organisation. Amsterdam: North-Holland Publishing Company; 1972. p. 161–76.
11. Depalma A, Myers GM, Papageorgiou YY. Rational choice under an imperfect ability to choose. Am Econ Rev. 1994;84(3):419–40.
12. Simon HA. Invariants of human-behavior. Annu Rev Psychol. 1990;41:1–19. 13. Gigerenzer G, Todd PM. Simple Heuristics That Make us Smart. New York:
Oxford University Press; 1999.
14. Tversky A, Kahneman D. Judgment under uncertainty: heuristics and biases. Science. 1974;185(4157):1124–31.
15. Kooreman P, Prast H. What does behavioral economics mean for policy? challenges to savings and health policies in the Netherlands. De Economist. 2010;158(2):101–22.
16. Hensher DA. How do respondents process stated choice experiments? Attribute consideration under varying information load. J Appl Econ. 2006;21(6):861–78.
17. Hensher D, Rose J, Greene W. Inferring attribute non-attendance from stated choice data: implications for willingness to pay estimates and a warning for stated choice experiment design. Transportation. 2012;39(2):235–45.
18. Rose JM et al. Attribute exclusion strategies in airline choice: accounting for exogenous information on decision maker processing strategies in models of discrete choice. Transportmetrica. 2012;8(5):344–60.
19. Hess S, Rose JM, Polak JW. Non-trading, lexicographic and inconsistent behaviour in stated choice data. Transport Res Part D: Transport Environ. 2010;15:405–17.
20. Ryan M, Watson V, Entwistle V. Rationalising the‘irrational’: a think aloud study of discrete choice experiment responses. Health Econ. 2009;18(3):321–36.
21. Coast J et al. Using qualitative methods for attribute development for discrete choice experiments: issues and recommendations. Health Econ. 2012;21(6):730–41.
22. Campbell D, Hensher DA, Scarpa R. Non-attendance to attributes in environmental choice analysis: a latent class specification. J Environ Plan Manag. 2011;54(8):1061–76.
24. Scarpa R, Thiene M, Hensher DA. Monitoring choice task attribute attendance in nonmarket valuation of multiple park management services: does It matter? Land Econ. 2010;86(4):817–39.
25. Lagarde M. Investigating attribute non-attendance and its consequences in choice experiments with latent class models. Health Econ.
2013;22(5):554–67.
26. Hess S, Hensher DA. Using conditioning on observed choices to retrieve individual-specific attribute processing strategies. Transport Res Part B-Methodol. 2010;44(6):781–90.
27. Rayner K. Eye movements in reading and information processing. Psychol Bull. 1978;85(3):618.
28. Rasch C, Louviere JJ, Teichert T. Using facial EMG and eye tracking to study integral affect in discrete choice experiments. Journal of Choice Modelling. 2015;14:32–47.
29. Arieli A, Ben-Ami Y, Rubinstein A. Tracking decision makers under uncertaint. Am Econ J Microeconomics. 2011;3(4):68–76.
30. Balcombe, K., I. Fraser, and E. McSorley, Visual attention and attribute attendance in multi-attribute choice experiments. J Appl Econom 2014: p. n/a-n/a.
31. Spinks J, Mortimer D. The effect of traffic lights and regulatory statements on the choice between complementary and conventional medicines: results from a discrete choice experiment. Soc Sci Med. 2015;124:257–65. 32. Harvey KJ. A review of proposals to reform the regulation of
complementary medicines. Aust Health Rev. 2009;33(2):279–87. 33. Harvey KJ et al. Commercialism, choice and cor sumer protection:
regulation of complementary medicines in Australia - In reply. Med J Aust. 2008;189(1):52–3.
34. Tippet G. Trick or treat? In: The Age. Melbourne: Fairfax Media; 2011. 35. Grunert K, Wills J. A review of European research on consumer response to
nutrition information on food labels. Journal of Public Health. 2007;15(5):385–99.
36. Sonnenberg L et al. A traffic light food labeling intervention increases consumer awareness of health and healthy choices at the point-of-purchase. Prev Med. 2013;57:253–7.
37. Manderson L, Canaway R, Unantenne N, Oldenburg B, Lin V, Hollingsworth B, et al. Care seeking, use of complementary therapies and self
management among people with type 2 diabetes and cardiovascular disease. Aust J Herb Med. 2012;24:10–8.
38. Manderson L, Oldenburg B, Lin V, Hollingsworth B, De Courten M, Canaway R, et al. Care-seeking, complementary therapy and herbal medicine use among people with type 2 diabetes and cardiovascular disease: CAMELOT Phase II, surveying for diversity. Aust J Herb Med. 2012;24:46–55. 39. Spinks J, Hollingsworth B, Manderson L, Lin V, Canaway R. Costs and drivers
of complementary and alternative medicine (CAM) use in people with type 2 diabetes or cardiovascular disease. Europ J IntegratMed. 2013;5:44–53. 40. StataCorp. Stata Statistical Software: Release 13. College Station: StataCorp
LP; 2013.
41. Hole AR, Kolstad JR, Gyrd-Hansen D. Inferred vs. Stated attribute non-attendance in choice experiments: A study of doctors’prescription behaviour. J Econ Behav Organ. 2013;96:21–31.
42. Spinks J, Hollingsworth B. Policy implications of complementary and alternative medicine (CAM) use in Australia: data from the national health survey. J Alternat ComplementMed. 2012;18(4):371–8.
43. Choi S, Kariv S, Müller W, Silverman D.Who is (More) Rational?NBER Working Paper No. 16791, 2011. Available at: http://www.nber.org/papers/ w16791.pdf Accesssed 20/07/2014.
• We accept pre-submission inquiries
• Our selector tool helps you to find the most relevant journal • We provide round the clock customer support
• Convenient online submission • Thorough peer review
• Inclusion in PubMed and all major indexing services • Maximum visibility for your research
Submit your manuscript at www.biomedcentral.com/submit