R E S E A R C H A R T I C L E
Open Access
The relation between air pollution and
respiratory deaths in Tehran, Iran- using
generalized additive models
Azizallah Dehghan
1, Narges Khanjani
2,3,9*, Abbas Bahrampour
4, Gholamreza Goudarzi
5,6and Masoud Yunesian
7,8Abstract
Background:Some epidemiological evidence has shown a relation between ambient air pollution and adverse
health outcomes. The aim of this study was to investigate the effect of air pollution on mortality from respiratory diseases in Tehran, Iran.
Methods:In this ecological study, air pollution data was inquired from the Tehran Province Environmental Protection Agency and the Tehran Air Quality Control Company. Meteorological data was collected from the Tehran Meteorology Organization and mortality data from the Tehran Cemetery Mortality Registration. Generalized Additive Models (GAM) was used for data analysis with different lags, up to 15 days. A 10-unit increase in all pollutants except CO (1-unit) was used to compute the Relative Risk of deaths.
Results:During 2005 until 2014, 37,967 respiratory deaths occurred in Tehran in which 21,913 (57.7%) were male. The
strongest relationship between NO2and PM10and respiratory death was seen on the same day (lag 0), and was
respectively (RR = 1.04, 95% CI: 1.02–1.07) and (RR = 1.03, 95% CI: 1.02–1.04). O3 and PM2.5 had the strongest
relationship with respiratory deaths on lag 2 and 1 respectively, and the RR was equal to 1.03, 95% CI: 1.01–1.
05 and 1.06, 95% CI: 1.02–1.10 respectively. NO2, O3, PM10and PM2.5also showed significant relations with respiratory
deaths in the older age groups.
Conclusions:The findings of this study showed that O3, NO2, PM10and PM2.5air pollutants were related to respiratory
deaths in Tehran. Reducing ambient air pollution can save lives in Tehran.
Keywords:Air pollution, Death, Respiratory disease
Background
Outdoor or indoor air pollution is caused by chemical, physical, and biological agents that change the normal composition of atmosphere. Household heating services, motor vehicles, industrial equipment, and forest fires are the most common sources of air pollution [1]. Nowadays air pollution is a complicated environmental health problem especially in developing countries [2]. Epi-demiological evidence has shown relations between outdoor air pollution and various undesirable health consequences [2–5]. There are different ambient air
pollutants which affect human health in different ways. The most important pollutants are particulate matter (PM), sulfur dioxide (SO2), nitrogen oxides (NOx), ozone (O3), and carbon monoxide (CO) [6].
Studies from Europe and America have showed that even short-term changes in air pollution can increase daily mortality [4,5]. Although the relative risk of mor-tality caused by air pollution is low, the proportion of deaths related to air pollution is high because of the high number of at-risk and sensitive populations [7].
It is estimated that outdoor air pollution in urban and rural areas caused 3 million early deaths around the world in 2012 and 88% of these deaths occur in low and middle-income countries, mostly in south East Asia and the western Pacific. According to the WHO estimations,
* Correspondence:[email protected]
2
Environmental Health Engineering Research Center, Kerman University of Medical Sciences, Kerman, Iran
3Monash Centre for Occupational & Environmental Health, School of Public Health and Preventive Medicine, Monash University, Melbourne, Australia Full list of author information is available at the end of the article
14% of early respiratory deaths and 14% of lung cancers are probably caused by air pollution [8].
Several studies have been done around the world about air pollutants and human deaths. However, most of them were done in developed countries and few studies were conducted in the Eastern Mediterranean region [9].
Air pollution is one of the most important environ-mental health problems in Tehran, the capital of Iran which has a population of over 12 million people. Con-trolling air pollution has been complicated in this city and investigation about the different aspects of air pollu-tion and its health effects is still necessary [10, 11]. In this paper, the impact of air pollutants on respiratory disease mortality in Tehran has been evaluated.
Methods
Study design and setting
This ecological and population based study was con-ducted to determine the relation between air pollution and respiratory deaths in Tehran, Iran in 2005–2014. Tehran is the largest city and capital of Iran with a population of over 12 million people.
Air pollution, meteorological and death data
Concentrations of ambient air pollutants were collected from the Tehran Air Quality Control Company and the Tehran Province Environment Protection Agency. There are 36 air pollution monitoring stations in Tehran, of which 21 operate under the Tehran Air Quality Control Company and the others are managed by the Tehran Province Environment Protection Agency. Tehran has 22 municipality districts and there are one or more air pollution monitoring stations in each district. Only 7 stations had data for 10 years under study. Other sta-tions were between 1 to 5 years old. For this reason, we used the average daily pollutants in these seven stations as an indicator of air pollution in the whole city. These stations record ambient air pollutant concentrations per hour. We used average daily values in the analysis. We es-timated missing data by the Expectation- Maximization algorithm (EM).
Meteorological data including temperature and relative humidity which are possible confounding parameters were collected from the Tehran Meteorological Organization. We used the average of daily temperature and relative humidity in this analysis. We had no missing me-teorological data.
Data about number of mortalities caused by respira-tory diseases in days were collected from the Tehran cemetery (Behesht-e-Zahra) and according to the inter-national classification of diseases (ICD10) with J00-J99 codes (all respiratory deaths). We used aggregated death data for the whole city.
Statistical analysis
Descriptive statistics including mean, standard deviation, the 25th, 50th (median), 75th and 98th percentiles, mini-mum and maximini-mum were computed by SPSS 16.
Then the multi-pollutant Generalized Additive Model (GAM) was used for estimating the Rate Ratio (RR) of air pollutants’effect on respiratory mortality. This model is an expanded form of the Generalized Linear Model (GLM) and has high flexibility. This model has been used in many studies because it can adjust for non-linear confounding parameters such as seasonal changes, trends and the weather variables [12,13].
YtPoisson μt
Logμt¼αþXβið Þ þXi
X
Sj Xj þseason
þday of week
where Ytdenotes the daily number of deaths due to re-spiratory disease, βi is the coefficients for air pollutants (Xi) and denotes the log Relative Rate of death related with each 1 unit increase in CO and each 10 unit in-crease in all other pollutants; and Sj (Xj) are the smooth-ing functions of meteorological variables (temperature and relative humidity) [14]. The degree of freedom (df ) for the smoothers is determined with Generalized Cross Validation (GCV) by using the mgcv package in R software.
In this study multi-pollutant models were used and pollutants with less than 0.2 correlation with the main predicting pollutant were entered into the model. All of the pollutants did not come into the model together, due to the high correlation between some pollutants.
In this part of the study, meteorology variables (hu-midity, temperature), season and day of the week were added to the model as potential confounders and their effects were adjusted by using smooth functions to de-termine the exact effects of pollutants on number of deaths. The time unit used in the analysis was day.
Using the formulas below, we computed the Relative Risk (RR) and 95% Confidence Interval (CI) for RR.
RR¼ expð Þβ
95%CI¼ expðβ1:96 SEÞ
Microsoft Office Excel 2007 and SPSS 16 software were used to prepare the data, and the‘mgcv’package in R i386 3.2.2 software was used for GAM analysis.
Results
occurred in spring, 8528 (22.46%) in summer, 9323 (24.55%) in autumn and 11,051 (29.1%) in winter.
The frequency of male, female and total respiratory deaths in 2005–2014 are shown in Table1.
In this study 13.1% of air pollution data was missing. The missing data was 10.51% in O3, 16.37% in CO, 8.73% in NO2, 10.51% in SO2, 7.09% in PM10 and 35.10% in PM2.5. They were estimated using the EM algorithm method.
The descriptive statistics of air pollution data, meteoro-logical data and respiratory deaths are shown in Table2.
The result of this study showed that the daily average concentrations for PM2.5was 20.68μg/m3 and for PM10 was 69.75 μg/m3 and these two concentrations were higher than the WHO 2014 guideline annual thresh-olds (20 and 10 μg/m3, respectively). However, the 98th percentile of CO, O3 and SO2 was less than the WHO threshold.
In 3173 from 3652 days, the PM10 concentration was higher than the WHO guideline daily threshold (50μg/ m3). Also in 315 days from 1826 days, the PM2.5 concen-trations were higher than WHO guideline daily thresh-old (25μg/m3).
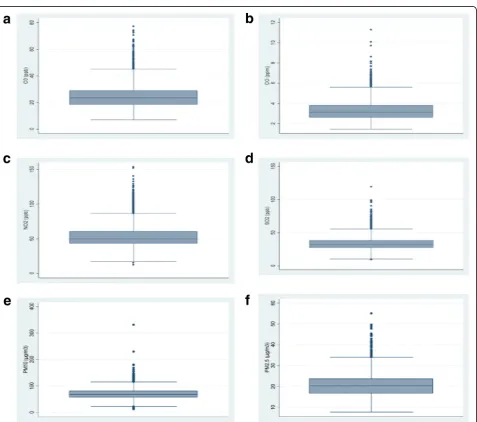
The annual average of NO2 in 2004 to 2009 was higher, but in 2010 to 2013 was lower than WHO guide-lines. The 75 percentile in all years was higher than WHO guidelines (50 ppb). Figure 1 shows the boxplots for all pollutants.
Table 3 shows the results of the adjusted Generalized Additive Model (multi-pollutant), about the effect of air pollutants on overall respiratory deaths. The table shows that ambient O3, and NO2, PM10 and PM2.5 may affect respiratory death. The strongest relationships for each of these pollutants were in lag 2 for O3(RR = 1.03, 95% CI; 1.01–1.05), lag 0 for NO2(RR = 1.04, 95% CI; 1.02–1.07), lag 0 for PM10(RR = 1.03, 95% CI; 1.02–1.04) and lag 1 for PM2.5(RR = 1.06, 95% CI; 1.02–1.10).
Tables 4 and 5 shows the effect of air pollutants on male and female respiratory deaths. Table 4 shows that O3, NO2, PM10and PM2.5 had a direct association with respiratory deaths in males and females. In men, the strongest relation was seen in lag 0 for O3 (RR = 1.03, 95% CI; 1.00–1.06), in lag 0 for PM10(RR = 1.03, 95% CI; 1.02–1.05), in lag 1 for NO2 (RR = 1.04, 95% CI; 1.00–1.06), and in lag 1 for PM2.5 (RR = 1.04, 95% CI;
1.02–1.07). In women, only NO2, PM10 and PM2.5 were related with respiratory death. NO2 and PM10 had the highest relation with respiratory deaths at lag 0 and PM2.5 at lag 1 in women. The Relative Risk of respiratory deaths for NO2, PM10 and PM2.5 was (RR = 1.06, 95% CI; 1.02–1.10), (RR = 1.03, 95% CI; 1.02–1.04) and (RR = 1.05, 95% CI; 1.01–1.09) respectively.
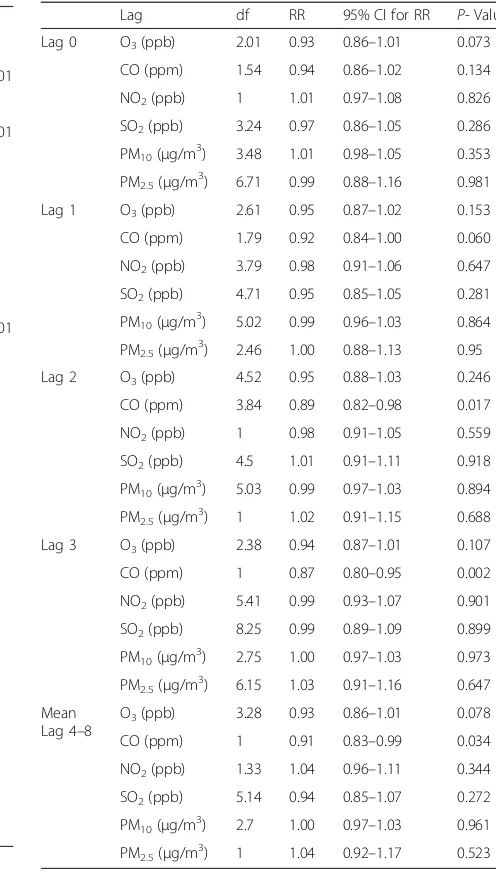
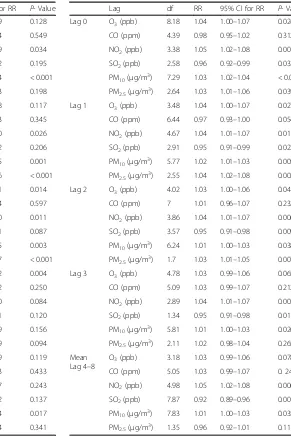
Tables6, 7and8 show the exposure-response relation between air pollutants and respiratory deaths in age groups under 18, 18–60 and over 60 years. None of the air pollutants were related with respiratory deaths in people under 18 years old. But in the 18 to 60 and over 60 years old age group, NO2, O3, PM10 and PM2.5 showed significant relations. RRs can be seen in Tables 6, 7 and 8.
In men, women and in all age groups CO and SO2 showed no direct relation with respiratory disease. SO2 was not related to increase respiratory mortality, maybe because it did not exceed WHO thresholds except on 6 days in 10 years.
In this study, in some situations, SO2showed an inverse relationship with respiratory death. More investigation about the probable harvesting effect of SO2was done ac-cording to the methods suggested by previous studies [15]. The average count of deaths in the previous 14 days (two weeks) was divided by the average counts of deaths 3 days after exposure to SO2and the ratio was 1.02 for all deaths, 1.03 for males and females. The RR for SO2after adjusting for day of the week, season, meteorological vari-ables and auto-correlation was 1.02 (95% CI 1.01–1.03) and this auto-correlation was significant (p< 0.001) and shows the presence of harvesting. Also, the RR for death in percentiles above the 95th percentile compared to the 5th percentile was 1.11 and shows that death is higher in higher concentrations of SO2which is rational.
Discussion
Air pollution, as one of the most important environmen-tal health problems is a major threat to human health and leads to many adverse health effects, the most im-portant of which is on the respiratory system. Studies have been carried out on its acute and chronic effects on the respiratory system [16]. The aim of this study was to investigate the relationship between respiratory mortality and air pollution.
Table 1Frequency of male, female and total respiratory deaths in 2005–2014
2005 2006 2007 2008 2009 2010 2011 2012 2013 2014 Total
Male 1772 1731 1774 1873 1850 2257 2323 2511 2936 2886 21,913
Female 1272 1290 1302 1210 1415 1700 1763 1803 2126 2166 16,047
Sex Ratio 1.39 1.34 1.36 1.54 1.30 1.32 1.31 1.39 1.38 1.33 1.365
Age- standardized ratea 117.49 114.09 117.05 112.78 119.91 120.62 118.99 113.73 119.6 119.2 – a
Table 2Descriptive statistics of daily air pollution, meteorological data and mortality
Mean SD Min 25th Percentile Median 75th percentile 98th percentile Max
O3(ppb) 24.66 9.125 6.89 18.31 23.30 28.98 48.70 77.09
CO (ppm) 3.29 0.97 1.47 2.61 3.13 3.81 5.81 11.29
NO2(ppb) 53.47 16.52 12.06 43.03 49.82 60.33 97.04 153.57
SO2(ppb) 33.46 10.47 9.02 26.87 32.05 38.26 62.08 119.10
PM10(μg/m3) 69.75 20.61 12.02 57.39 68.04 80.65 117.2 331.20
PM2.5(μg/m3) 20.68 5.87 7.43 16.72 20.23 23.67 35.85 55.06
Temperature (°C) 16.49 9.52 −8.70 8.30 16.80 25.20 31.60 34.40
Relative humidity (%) 43.72 18.37 9.75 29.63 39.50 55.75 88.62 89
Male deaths(N) 6.00 2.44 0 4 6 8 12 16
Female deaths(N) 4.39 1.90 0 3 4 6 9 16
Total deaths(N) 10.40 3.97 2 7 10 13 19 31
From 2005 to 2014, the number of respiratory mortal-ity in both men and women has gradually increased in Tehran. As the corresponding increase in Age-Standardized Rates was negligible, we can conclude that this increase was nearly entirely due to changes in popu-lation, such as increase in the urban population of Tehran due to immigration. However, this population increase is less likely to have affected our results. In time series regression studies, the denominator (the under-lying population size) is not part of the dataset, and is not a concern because in these models, we are usually interested in modeling variation in outcome from day to day or week to week, and population size is unlikely to change meaningfully over these timescales, and can be
safely omitted from the analysis. Also in this study, we assessed the short-term effect of exposure; and popula-tion change cannot have a significant effect on short-term results [17].
In this study, maximum daily concentration of ozone (O3) was 77.09 ppb and lower than WHO guidelines (Table 2). O3 also was related to overall respiratory deaths, male respiratory deaths and respiratory deaths in people 18 to 60 years and in people over 60 years old. RR for overall respiratory deaths was 1.03 (95% CI: 1.01–1.05) per 10 ppb increase in O3in lag 1. This rela-tion between O3 and respiratory deaths has also been seen in other studies. Monthly concentration of O3was related to respiratory death in people over 60 years old Table 3Results of adjusted Generalized Additive Model, about
the effect of air pollutants on total respiratory deaths (for 1 unit increase in CO and 10 units increase in all other pollutants)
Lag df RR 95% CI for RR P-Value
Lag 0 O3(ppb) 7.94 1.02 0.99–1.05 0.053
CO (ppm) 5.04 1.02 0.99–1.05 0.139
NO2(ppb) 3.04 1.04 1.02–1.07 < 0.001
SO2(ppb) 2.61 0.96 0.93–0.98 0.006
PM10(μg/m3) 7.3 1.03 1.02–1.04 < 0.001
PM2.5(μg/m3) 3.26 1.04 1.00–1.08 0.008
Lag 1 O3(ppb) 4.04 1.03 1.00–1.05 0.042
CO (ppm) 6.35 0.96 0.99–1.05 0.130
NO2(ppb) 6.51 1.04 1.01–1.06 0.003
SO2(ppb) 3.65 0.95 0.92–0.98 0.004
PM10(μg/m3) 6.66 1.02 1.01–1.03 < 0.001
PM2.5(μg/m3) 2.69 1.06 1.02–1.10 < 0.001
Lag 2 O3(ppb) 5.34 1.03 1.01–1.06 0.015
CO (ppm) 5.79 1.03 0.99–1.06 0.199
NO2(ppb) 4.17 1.04 1.01–1.06 0.001
SO2(ppb) 4.21 0.95 0.92–0.98 0.004
PM10(μg/m3) 6.79 1.02 1.01–1.03 < 0.001
PM2.5(μg/m3) 2.41 1.04 1.00–1.08 0.001
Lag 3 O3(ppb) 4.86 1.03 1.01–1.06 0.015
CO (ppm) 5.08 1.02 0.99–1.05 0.228
NO2(ppb) 3.04 1.04 1.01–1.06 0.001
SO2(ppb) 8.14 0.95 0.92–0.98 0.004
PM10(μg/m3) 6.44 1.02 1.01–1.03 0.001
PM2.5(μg/m3) 2.56 1.03 0.98–1.07 0.064
Mean Lag 4–8
O3(ppb) 3.42 1.02 0.99–1.05 0.103
CO (ppm) 6.51 1.02 0.98–1.04 0.176
NO2(ppb) 5.79 1.03 1.01–1.06 0.004
SO2(ppb) 4.83 0.95 0.93–0.99 0.014
PM10(μg/m3) 6.94 1.01 1.00–1.02 0.002
PM2.5(μg/m3) 3.08 1.01 0.97–1.05 0.193
Table 4Results of adjusted Generalized Additive Model and the effect of pollutants on respiratory deaths in men (for 1 unit increase in CO and 10 units increase in all other pollutants)
Lag df RR 95% CI for RR P-Value
Lag 0 O3(ppb) 7.19 1.03 1.00–1.07 0.037
CO (ppm) 4.88 0.98 0.94–1.01 0.235
NO2(ppb) 2.33 1.03 1.00–1.06 0.045
SO2(ppb) 1 0.96 0.92–1.01 0.093
PM10(μg/m3) 7.50 1.03 1.02–1.05 < 0.001
PM2.5(μg/m3) 3.92 1.02 0.97–1.08 0.156
Lag 1 O3(ppb) 3.20 1.03 0.99–1.06 0.100
CO (ppm) 6.45 0.97 0.94–1.01 0.107
NO2(ppb) 4.47 1.04 1.00–1.06 0.019
SO2(ppb) 3.15 0.95 0.91–0.99 0.032
PM10(μg/m3) 6.69 1.02 1.01–1.04 < 0.001
PM2.5(μg/m3) 4.95 1.04 1.02–1.07 0.003
Lag 2 O3(ppb) 3.31 1.00 0.97–1.04 0.394
CO (ppm) 4.85 0.96 0.93–1.00 0.073
NO2(ppb) 4.15 1.03 1.00–1.07 0.028
SO2(ppb) 1.30 0.95 0.91–0.99 0.030
PM10(μg/m3) 6.49 1.02 1.01–1.03 0.002
PM2.5(μg/m3) 2.09 1.04 1.02–1.05 0.014
Lag 3 O3(ppb) 3.92 1.03 0.99–1.06 0.053
CO (ppm) 5.60 1.07 0.99–1.08 0.488
NO2(ppb) 2.79 1.02 0.99–1.06 0.125
SO2(ppb) 8.21 0.94 0.91–0.99 0.016
PM10(μg/m3) 6.43 1.02 1.01–1.03 0.004
PM2.5(μg/m3) 2.41 1.05 0.99–1.10 0.051
Mean Lag 4–8
O3(ppb) 3.33 1.03 0.99–1.06 0.066
CO (ppm) 5.52 1.03 0.99–1.07 0.311
NO2(ppb) 2.54 1.02 0.99–1.06 0.116
SO2(ppb) 2.82 0.97 0.92–1.01 0.117
PM10(μg/m3) 6.47 1.00 0.99–1.01 0.089
in Shiraz (South West Iran) and was RR = 1.04, 95% CI: 1.00–1.09 per one ppb increase in O3[9], and in Kerman (south east of Iran), there was a significant relation be-tween the monthly concentration of O3and respiratory deaths in men and was RR = 1.03, 95% CI: 1.01–1.04 per one ppm increase in O3 [16]. Shahi et al. showed that respiratory admissions to hospitals were related to O3 in lag 0 to 7 days in Tehran, the highest RR was seen in lag 1.01 (95% CI: 1.01–1.02) [18]. In this study, the mean concentration of O3 was 24.66 ± 9.12 and more than Shiraz (17.49 ± 16.28 ppb) [9] and Kerman (0.02 ± 0.01 ppm) [16]. In the period of this study, on only 6 days the concentration of SO2 passed WHO thresholds.
In this study, NO2 had a significant relationship with respiratory mortality in both sexes and in groups aged 18 and over. Other studies have also seen a relation between nitrogen dioxide and respiratory mortality [19–21]. The strongest RR for NO2 in this study for overall death was 1.04 (95% CI; 1.02–1.04) in lag 1. In César et al.’s study in Brazil, the RR for respiratory deaths per 10 μg/m3 increase in NOx was 1.04 (95% CI: 1.01–1.06) [19]. In Zhang et al. in Beijing, China the RR for respiratory death was 1.01 (95% CI: 1.00– 1.01) per 10 μg/m3 increase of NO2 in lag 0–2 days [21]. In a meta-analysis in China, the pooled esti-mate of RR for respiratory deaths was 1.01 (95% CI: Table 5Results of adjusted Generalized Additive Model and the
effect of pollutants on respiratory deaths in women (for 1 unit increase in CO and 10 units increase in all other pollutants)
Lag df RR 95% CI for RR P-Value
Lag 0 O3(ppb) 7.89 1.01 0.97–1.05 0.616
CO (ppm) 4.62 0.98 0.94–1.03 0.438
NO2(ppb) 3.80 1.06 1.03–1.10 < 0.001
SO2(ppb) 5.27 0.94 0.89–0.99 0.019
PM10(μg/m3) 4.53 1.03 1.01–1.04 < 0.001
PM2.5(μg/m3) 1.83 1.04 0.98–1.10 0.355
Lag 1 O3(ppb) 4.49 1.02 0.98–1.06 0.270
CO (ppm) 5.39 1.03 0.99–1.08 0.476
NO2(ppb) 6.29 1.05 1.04–1.09 0.005
SO2(ppb) 4.33 0.95 0.91–1.00 0.056
PM10(μg/m3) 5.72 1.01 0.99–1.03 0.063
PM2.5(μg/m3) 7.23 1.05 1.01–1.09 < 0.001
Lag 2 O3(ppb) 7.19 1.03 0.99–1.07 0.178
CO (ppm) 5.76 1.04 0.99–1.09 0.694
NO2(ppb) 3.63 1.04 1.01–1.08 0.010
SO2(ppb) 5.27 0.94 0.89–0.99 0.029
PM10(μg/m3) 6.61 1.01 0.99–1.03 0.113
PM2.5(μg/m3) 2.53 1.03 1.01–1.05 0.003
Lag 3 O3(ppb) 6.45 1.03 0.98–1.06 0.174
CO (ppm) 4.91 1.04 0.99–1.09 0.421
NO2(ppb) 2.22 1.05 1.02–1.09 0.003
SO2(ppb) 1.36 0.96 0.92–1.01 0.132
PM10(μg/m3) 5.96 1.01 0.99–1.03 0.071
PM2.5(μg/m3) 2.41 1.03 0.98–1.07 0.067
Mean Lag 4–8
O3(ppb) 3.31 1.01 0.96–1.04 0.801
CO (ppm) 5.29 0.98 0.96–1.01 0.124
NO2(ppb) 4.88 1.05 1.01–1.08 0.011
SO2(ppb) 4.61 0.95 0.90–1.00 0.052
PM10(μg/m3) 6.93 1.00 0.98–1.02 0.589
PM2.5(μg/m3) 2.68 0.95 0.90–1.01 0.131
Table 6Results of adjusted Generalized Additive Model, about the effect of air pollutants on respiratory deaths in peoples under 18 years old (for 1 unit increase in CO and 10 units increase in all other pollutants)
Lag df RR 95% CI for RR P- Value
Lag 0 O3(ppb) 2.01 0.93 0.86–1.01 0.073
CO (ppm) 1.54 0.94 0.86–1.02 0.134
NO2(ppb) 1 1.01 0.97–1.08 0.826
SO2(ppb) 3.24 0.97 0.86–1.05 0.286
PM10(μg/m3) 3.48 1.01 0.98–1.05 0.353
PM2.5(μg/m3) 6.71 0.99 0.88–1.16 0.981
Lag 1 O3(ppb) 2.61 0.95 0.87–1.02 0.153
CO (ppm) 1.79 0.92 0.84–1.00 0.060
NO2(ppb) 3.79 0.98 0.91–1.06 0.647
SO2(ppb) 4.71 0.95 0.85–1.05 0.281
PM10(μg/m3) 5.02 0.99 0.96–1.03 0.864
PM2.5(μg/m3) 2.46 1.00 0.88–1.13 0.95
Lag 2 O3(ppb) 4.52 0.95 0.88–1.03 0.246
CO (ppm) 3.84 0.89 0.82–0.98 0.017
NO2(ppb) 1 0.98 0.91–1.05 0.559
SO2(ppb) 4.5 1.01 0.91–1.11 0.918
PM10(μg/m3) 5.03 0.99 0.97–1.03 0.894
PM2.5(μg/m3) 1 1.02 0.91–1.15 0.688
Lag 3 O3(ppb) 2.38 0.94 0.87–1.01 0.107
CO (ppm) 1 0.87 0.80–0.95 0.002
NO2(ppb) 5.41 0.99 0.93–1.07 0.901
SO2(ppb) 8.25 0.99 0.89–1.09 0.899
PM10(μg/m3) 2.75 1.00 0.97–1.03 0.973
PM2.5(μg/m3) 6.15 1.03 0.91–1.16 0.647
Mean Lag 4–8
O3(ppb) 3.28 0.93 0.86–1.01 0.078
CO (ppm) 1 0.91 0.83–0.99 0.034
NO2(ppb) 1.33 1.04 0.96–1.11 0.344
SO2(ppb) 5.14 0.94 0.85–1.07 0.272
PM10(μg/m3) 2.7 1.00 0.97–1.03 0.961
1.01–1.02) per 10 μg/m3 increase in NO2 [22], which is close to our results.
In Tehran, the major source of NO2production is the transportation system. Therefore, it is necessary to in-crease the use of public transport and dein-crease the use of fossil fuels to reduce this ambient air pollutant.
In this study, particulate matters (PM10 and PM2.5) showed a direct relation with respiratory deaths which were RR = 1.03, 95% CI: 1.02–1.04 and RR = 1.05, 95% CI: 1.01–1.09 respectively. Similar to this study, in stud-ies done by Yang et al., in Beijing, China, there was a 1.7% (95% CI: 0.01–3.32) increase of daily respiratory deaths associated with an interquartile range (IQR)
increase in PM10 concentrations [23] and in a study by Wang et al., in Seoul, Korea the RR for respiratory death was 1.0001 (95% CI: 1.0001–1.0002) per 1 μg/m3 in-crease in PM10 in lag 0 and 1 [14]. Another study by Lopez et al., in the Canary Islands showed that the Rate Ratio for respiratory mortality was RR = 1.04 (95% CI: 1.01–1.08) by 10 μg/m3increase in PM10 and the max-imum effect of exposure to PM10 on respiratory death was on the same day [4]. Studies from England [24], and Kerman, Iran [16] also showed a significant relation be-tween monthly concentrations of PM10 and respiratory deaths. In a study from Isfahan, Iran there was a signifi-cant relation between PM10 and the number of children Table 7Results of adjusted Generalized Additive Model and the
effect of pollutants on respiratory deaths in peoples 18–60 years old (for 1 unit increase in CO and 10 units increase in all other pollutants)
Lag df RR 95% CI for RR P- Value
Lag 0 O3(ppb) 7.57 1.07 0.99–1.09 0.128
CO (ppm) 6.33 0.99 0.93–1.04 0.549
NO2(ppb) 1 1.05 1.00–1.09 0.034
SO2(ppb) 3.19 0.96 0.90–1.02 0.195
PM10(μg/m3) 7.47 1.02 1.00–1.04 < 0.001
PM2.5(μg/m3) 3.25 1.05 0.96–1.13 0.198
Lag 1 O3(ppb) 5.57 1.04 0.99–1.08 0.117
CO (ppm) 5.14 0.97 0.93–1.03 0.345
NO2(ppb) 7.07 1.05 1.01–1.10 0.026
SO2(ppb) 1 0.96 0.90–1.02 0.206
PM10(μg/m3) 7.08 1.03 1.01–1.05 0.001
PM2.5(μg/m3) 2.87 1.06 1.02–1.06 < 0.001
Lag 2 O3(ppb) 5.28 1.06 1.01–1.11 0.014
CO (ppm) 4.98 0.98 0.96–1.04 0.597
NO2(ppb) 4.14 1.06 1.01–1.10 0.011
SO2(ppb) 1.61 0.95 0.88–1.01 0.087
PM10(μg/m3) 6.84 1.03 1.01–1.05 0.003
PM2.5(μg/m3) 3.16 1.04 1.01–1.07 < 0.001
Lag 3 O3(ppb) 6.96 1.07 1.02–1.12 0.004
CO (ppm) 6.99 0.97 0.92–1.02 0.250
NO2(ppb) 2.2 1.04 0.99–1.10 0.084
SO2(ppb) 8.61 0.95 0.89–1.01 0.120
PM10(μg/m3) 7.47 1.02 0.95–1.09 0.156
PM2.5(μg/m3) 3.21 1.02 0.95–1.09 0.094
Mean Lag 4–8
O3(ppb) 8.61 1.04 0.99–1.09 0.119
CO (ppm) 4.49 0.97 0.93–1.03 0.433
NO2(ppb) 2.7 1.03 0.98–1.07 0.243
SO2(ppb) 1 0.95 0.89–1.02 0.137
PM10(μg/m3) 7.73 1.02 1.00–1.04 0.017
PM2.5(μg/m3) 4.26 1.00 0.97–1.04 0.341
Table 8Results of adjusted Generalized Additive Model and the effect of pollutants on respiratory deaths in peoples over 60 years old (for 1 unit increase in CO and 10 units increase in all other pollutants)
Lag df RR 95% CI for RR P- Value
Lag 0 O3(ppb) 8.18 1.04 1.00–1.07 0.024
CO (ppm) 4.39 0.98 0.95–1.02 0.312
NO2(ppb) 3.38 1.05 1.02–1.08 0.001
SO2(ppb) 2.58 0.96 0.92–0.99 0.033
PM10(μg/m3) 7.29 1.03 1.02–1.04 < 0.001
PM2.5(μg/m3) 2.64 1.03 1.01–1.06 0.039
Lag 1 O3(ppb) 3.48 1.04 1.00–1.07 0.027
CO (ppm) 6.44 0.97 0.93–1.00 0.054
NO2(ppb) 4.67 1.04 1.01–1.07 0.01
SO2(ppb) 2.91 0.95 0.91–0.99 0.023
PM10(μg/m3) 5.77 1.02 1.01–1.03 0.005
PM2.5(μg/m3) 2.55 1.04 1.02–1.08 0.002
Lag 2 O3(ppb) 4.02 1.03 1.00–1.06 0.041
CO (ppm) 7 1.01 0.96–1.07 0.232
NO2(ppb) 3.86 1.04 1.01–1.07 0.006
SO2(ppb) 3.57 0.95 0.91–0.98 0.009
PM10(μg/m3) 6.24 1.01 1.00–1.03 0.038
PM2.5(μg/m3) 1.7 1.03 1.01–1.05 0.007
Lag 3 O3(ppb) 4.78 1.03 0.99–1.06 0.065
CO (ppm) 5.09 1.03 0.99–1.07 0.212
NO2(ppb) 2.89 1.04 1.01–1.07 0.003
SO2(ppb) 1.34 0.95 0.91–0.98 0.01
PM10(μg/m3) 5.81 1.01 1.00–1.03 0.026
PM2.5(μg/m3) 2.11 1.02 0.98–1.04 0.265
Mean Lag 4–8
O3(ppb) 3.18 1.03 0.99–1.06 0.078
CO (ppm) 5.05 1.03 0.99–1.07 0. 241
NO2(ppb) 4.98 1.05 1.02–1.08 0.006
SO2(ppb) 7.87 0.92 0.89–0.96 0.001
PM10(μg/m3) 7.83 1.01 1.00–1.03 0.035
admitted to hospitals due to respiratory problems [25]. In Wang et al.’s, study in Seoul, Korea (71.23 μg/m3) [14], Yang et al., in Beijing, China (96.3 μg/m3) [23], Khanjani et al, in Kerman, Iran (125.69 μg/m3) [16] and Mansourian et al, in Isfahan, Iran (118.04 μg/m3) [25] the mean of concentration of PM10were higher than this study (69.75 μg/m3), but in Lopez et al, in the Canary Islands (37.7 μg/m3) [4] and a meta-analysis by Hansel et al, in England (20.7μg/m3) [24] the mean concentra-tion of PM10was lower than this study. Particulate mat-ter are one of the most important pollutants that affect human health. Particulate matter compounds and sizes vary in different places and this can explain different study results.
In this study, Carbon monoxide showed no signifi-cant relation, and SO2 showed inverse relations with respiratory death, that was likely caused by the har-vesting effect.
In some studies CO and SO2 have shown relations with respiratory deaths. For example, monthly CO con-centrations were related with respiratory deaths in Shiraz [9] and CO was also related with respiratory hos-pital admission in Tehran [18].
SO2 in the Canary Islands [4], Kerman, Iran [16], Taiwan [26], and Tehran [20], was reported to be related with respiratory death. Other studies from Kerman re-ported a relation between hospital respiratory admission and SO2[27].
The effects of different ambient air pollutants, has been reported differently in different parts of the world. This variability may be related to different study designs, various statistical models and including or not including different confounders.
In this study and other similar studies [4,9,16,25,26], some air pollutants had more adverse effects on the health outcomes in men than in women. In this study only ozone showed a different result based on gender and was more effective on respiratory deaths in men. The reason might be that men spend more time in outdoor environments. One study conducted in Tehran showed that the concen-trations of ambient (outdoor) PM10, PM2.5and PM1were higher than indoors [28].
In this study, older people were more vulnerable to ex-posure to pollutants than younger people. None of the air pollutants were related to respiratory death in people under 18 years old. But in the over 18 year age groups; NO2, O3, PM10and PM2.5showed relations with respira-tory death.
Mobile and stationary sources are both responsible for air pollution in Tehran. Motor vehicles are the main source for especially CO, NO2 and PM10 in Tehran. Tehran also has a lot of factories and is an industrial hub. According to Mazaheri et al., mobile sources of air pollution are more important than stationary sources in
making and emitting NO2and CO in Tehran [29]. Wang et al [30] showed that the mass ratio of nitrate to sulfate is a good indicator of the relative importance of mobile to stationary sources of nitrogen and sulfur in the at-mosphere and it is reasonable to use nitrate as an indica-tor of transportation emission and sulfate as an indicaindica-tor of stationary emission. The nitrate/sulfate ratio in Tehran, in 2014 ranged from 1.17 to 1.21 for PM10, 1.16 to 1.40 for PM2.5, and 1.23 to 1.45 for PM1. The results indicated that mobile sources were more important source of PM in Tehran [28]. The dismissal of old cars, using less fossil fuels for transportation and heating; and the transfer of factories out of the city are recommended in order to decrease air pollution in Tehran.
Another source of air pollution are the Middle Eastern dust storms which have also affected western and central Iran (including Tehran). Regional and international efforts to reduce particle matter in the Middle East are necessary. Other studies about the effects of air pollutants indi-cate that air pollution has also caused deaths and hos-pital admissions due to heart disease and road accidents in Iran [31–36]. This evidence further shows the import-ance of controlling air pollution in this country.
Some limitations of this study were that the impact of other variables such as the concentrations of other pollut-ants like NO, lead and total hydrocarbons(THC), or wind direction was not investigated. We did not have data about influenza epidemics in Tehran and we did not adjust for this variable. Finally, given the ecological nature of this study, results cannot be easily inferred to an individual level.
Conclusions
The results indicate that ambient Particle matter, Ozone and Nitrogen dioxide can be responsible for a significant part of respiratory mortalities in Tehran. Additional ef-forts to control and reduce air pollutant is necessary.
Acknowledgements
We appreciate the Tehran Air Quality Control Company (AQCC), Tehran Department of Environmental Protection, Tehran Meteorological Organization and the Tehran Cemetery (Behesht-e-Zahra) for providing the data.
Funding
This study was supported by Grant No. 95–267, from Kerman University of Medical Sciences, Kerman, Iran.
Availability of data and materials
We cannot share data at this stage, because the owner of the air pollution data is the Tehran Environmental Protection Agency and the death registry of Tehran. We need to consult with them before disclosing data.
Authors’contributions
Ethics approval and consent to participate
This project was approved by the Standing Committee of Ethics in Research of Kerman University of Medical Sciences (Ethics code: IR.KMU.REC.1394.267).
Consent for publication
Not applicable.
Competing interests
The authors declare that they have no competing interests.
Publisher’s Note
Springer Nature remains neutral with regard to jurisdictional claims in published maps and institutional affiliations.
Author details 1
Neurology Research Center, Kerman University of Medical Sciences, Kerman, Iran.2Environmental Health Engineering Research Center, Kerman University of Medical Sciences, Kerman, Iran.3Monash Centre for Occupational & Environmental Health, School of Public Health and Preventive Medicine, Monash University, Melbourne, Australia.4Physiology Research Center, Kerman University of Medical Sciences, Kerman, Iran.5Air Pollution and Respiratory Diseases Research Center, Ahvaz Jundishapur University of Medical Sciences, Ahvaz, Iran.6Environmental Technologies Research Center (ETRC), Ahvaz Jundishapur University of Medical Sciences, Ahvaz, Iran. 7Department of Environmental Health Engineering, School of Public Health, Tehran University of Medical Sciences, Tehran, Iran.8Center for Air Pollution Research and Department of Research Methodology and Data Analysis, Institute for Environmental Research (IER), Tehran University of Medical Sciences, Tehran, Iran.9Department of Epidemiology and Biostatistics, School of Public Health, Kerman University of Medical Sciences, Kerman, Iran.
Received: 15 February 2017 Accepted: 9 March 2018
References
1. Liu G-J, Fu E-J, Wang Y-J, Zhang K-F, Han B-P, ARROWSMITH C. A framework
of environmental modelling and information sharing for urban air pollution control and management. J China Univ Min Technol. 2007;17(2):172–8. 2. Yamamoto SS, Phalkey R, Malik AA. A systematic review of air pollution as a
risk factor for cardiovascular disease in South Asia: limited evidence from India and Pakistan. Int J Hyg Environ Health. 2014;217(2):133–44.
3. Atkinson RW, Analitis A, Samoli E, Fuller GW, Green DC, Mudway IS, et al. Short-term exposure to traffic-related air pollution and daily mortality in London, UK. J Expo Sci Environ Epidemiol. 2016;26(2):125.
4. Lopez-Villarrubia E, Ballester F, Iniguez C, Peral N. Air pollution and mortality in the Canary Islands: a time-series analysis. Environ Health. 2010;9(1):8. 5. Peng RD, Dominici F, Pastor-Barriuso R, Zeger SL, Samet JM. Seasonal analyses of
air pollution and mortality in 100 US cities. Am J Epidemiol. 2005;161(6):585–94. 6. Hansel NN, McCormack MC, Kim V. The effects of air pollution and temperature
on COPD. COPD: J Chron Obstruct Pulmon Dis. 2016;13(3):372–9.
7. Qorbani M, Yunesian M. Study designs in air pollution epidemiology. Iranian. Journal of Epidemiology. 2010;5(4):44–52.
8. World Health Organization. Ambient (outdoor) air quality and health.
2016[Updated September 2016, Cited 16, Dec 2016]; Available from:
http://www.who.int/mediacentre/factsheets/fs313/en/
9. Dadbakhsh M, Khanjani N, Bahrampour A. Death from respiratory diseases
and air pollutants in shiraz, Iran (2006-2012). Journal of Environment Pollution and Human Health. 2015;3(1):4–11.
10. Hosseinpoor AR, Forouzanfar MH, Yunesian M, Asghari F, Naieni KH, Farhood D. Air pollution and hospitalization due to angina pectoris in Tehran, Iran: a time-series study. Environ Res. 2005;99(1):126–31.
11. Khalilzadeh S, Khalilzadeh Z, Emami H, Masjedi MR. The relation between air pollution and cardiorespiratory admissions in Tehran. Tanaffos. 2009;8(1):35–40. 12. Dominici F, McDermott A, Zeger SL, Samet JM. On the use of generalized
additive models in time-series studies of air pollution and health. Am J Epidemiol. 2002;156(3):193–203.
13. Guisan A, Edwards TC, Hastie T. Generalized linear and generalized additive models in studies of species distributions: setting the scene. Ecol Model. 2002;157(2):89–100.
14. Wang Y, Pham H. Analyzing the effects of air pollution and mortality by
generalized additive models with robust principal components. International Journal of System Assurance Engineering and Management. 2011;2(3):253–9. 15. Spix C, Heinrich J, Dockery D, Schwartz J, Völksch G, Schwinkowski K, et al.
Air pollution and daily mortality in Erfurt, East Germany, 1980-1989. Environ Health Perspect. 1993;101(6):518.
16. Khanjani N, Ranadeh Kalankesh L, Mansouri F. Air pollution and respiratory deaths in Kerman, Iran (from 2006 till 2010). Iranian. Journal of Epidemiology. 2012;8(3):58–65.
17. Bhaskaran K, Gasparrini A, Hajat S, Smeeth L, Armstrong B. Time series regression studies in environmental epidemiology. Int J Epidemiol. 2013; 42(4):1187–95.
18. Shahi AM, Omraninava A, Goli M, Soheilarezoomand HR, Mirzaei N. The effects of air pollution on cardiovascular and respiratory causes of emergency admission. EMERGENCY-an academic. Emerg Med J. 2014;2(3):107–14.
19. Cesar ACG, Carvalho Jr JA, Nascimento LFC. Association between NOx
exposure and deaths caused by respiratory diseases in a medium-sized Brazilian city. Braz J Med Biol Res. 2015;48(12):1130–5.
20. Masjedi M, Jamaati H, Dokohaki P, Ahmad-zade Z, Ghavam M, Agin K. The
association of air pollution with acute heart attacks and respiratory. The quarterly journal of School of Medicine, Shahid Beheshti University of Medical Sciences (research on Medicine). 2001;25:25–33.
21. Zhang F, Li L, Krafft T, Lv J, Wang W, Pei D. Study on the association between ambient air pollution and daily cardiovascular and respiratory mortality in an urban district of Beijing. Int J Environ Res Public Health. 2011;8(6):2109–23.
22. Sun J, Barnes AJ, He D, Wang M, Wang J. Systematic review and meta-analysis of the association between ambient nitrogen dioxide and respiratory disease in China. Int J Environ Res Public Health. 2017;14(6):646.
23. Yang Y, Cao Y, Li W, Li R, Wang M, Wu Z, et al. Multi-site time series analysis of acute effects of multiple air pollutants on respiratory mortality: a population-based study in Beijing, China. Sci Total Environ. 2015;508:178–87.
24. Hansell A, Ghosh RE, Blangiardo M, Perkins C, Vienneau D, Goffe K, et al. Historic air pollution exposure and long-term mortality risks in England and Wales: prospective longitudinal cohort study. Thorax. 2016;71(4):330–8.
25. Mansourian M, Javanmard SH, Poursafa P, Kelishadi R. Air pollution and
hospitalization for respiratory diseases among children in Esfahan, Iran. Ghana medical journal. 2010;44(4):138–43.
26. Liang W-M, Wei H-Y, Kuo H-W. Association between daily mortality from respiratory and cardiovascular diseases and air pollution in Taiwan. Environ Res. 2009;109(1):51–8.
27. Rezaei S, Khanjani N, Mohammadi SS, Darabi FZ. The effect of air pollution on respiratory disease visits to the emergency department in Kerman, Iran. Journal of Health & Development. 2016;4(4):306–3014.
28. Hassanvand MS, Naddafi K, Faridi S, Arhami M, Nabizadeh R, Sowlat MH, et al. Indoor/outdoor relationships of PM 10, PM 2.5, and PM 1 mass concentrations and their water-soluble ions in a retirement home and a school dormitory. Atmos Environ. 2014;82:375–82.
29. Mazaheri Tehrani A, Karamali F, Chimehi E. Evaluation of 5 air criteria pollutants Tehran, Iran. International archives of. Health Sciences. 2015;2(3):95–100. 30. Wang Y, Zhuang G, Tang A, Yuan H, Sun Y, Chen S, et al. The ion chemistry
and the source of PM 2.5 aerosol in Beijing. Atmos Environ. 2005;39(21): 3771–84.
31. Dadbakhsh M, Khanjani N, Bahrampour A. Death from cardiovascular diseases and air pollution in shiraz, Iran (march 2006-march 2012). Journal of epidemiology and Preventive Medicine. 2016;2(2):114.
32. Dastoorpoor M, Idani E, Khanjani N, Goudarzi G, Bahrampour A. Relationship between air pollution, weather, traffic, and traffic-related mortality. Trauma Monthly. 2016;21(4):e37585.
33. Hashemi SY, Khanjani N. Air pollution and cardiovascular hospital admissions in Kerman, Iran. Journal of Heart and Cardiology. 2016;2(2):1–6.
34. Hashemi SY, Khanjani N, Soltaninejad Y, Momenzadeh R. Air Pollution and Cardiovascular mortality in Kerman from 2006 to 2011. American Journal of Cardiovascular Disease Research. 2014;2(2):27–30.
35. Vahedian M, Khanjani N, Mirzaee M, Koolivand A. Associations of short-term exposure to air pollution with respiratory hospital admissions in arak, Iran. J Environ Health Sci Eng. 2017;15(1):17.