R E S E A R C H A R T I C L E
Open Access
Assessing the reliability of self-reported
weight for the management of heart
failure: application of fraud detection
methods to a randomised trial of
telemonitoring
Adam Steventon
3*, Sarwat I. Chaudhry
2, Zhenqiu Lin
1, Jennifer A. Mattera
1and Harlan M. Krumholz
1Abstract
Background:Since clinical management of heart failure relies on weights that are self-reported by the patient, errors in reporting will negatively impact the ability of health care professionals to offer timely and effective preventive care. Errors might often result from rounding, or more generally from individual preferences for numbers ending in certain digits, such as 0 or 5. We apply fraud detection methods to assess preferences for numbers ending in these digits in order to inform medical decision making.
Methods:The Telemonitoring to Improve Heart Failure Outcomes trial tested an approach to telemonitoring that used existing technology; intervention patients (n =826) were asked to measure their weight daily using a digital scale and to relay measurements using their telephone keypads. First, we estimated the number of weights subject to end-digit preference by dividing the weights by five and comparing the resultant distribution with the uniform distribution. Then, we assessed the characteristics of patients reporting an excess number of weights ending in 0 or 5, adjusting for chance reporting of these values.
Results:Of the 114,867 weight readings reported during the trial, 18.6% were affected by end-digit preference, and the likelihood of these errors occurring increased with the number of days that had elapsed since trial enrolment (odds ratio per day: 1.002,p <0.001). At least 105 patients demonstrated end-digit preference (14.9% of those who submitted data); although statistical significance was limited, a pattern emerged that, compared with other patients, they tended to be younger, male, high school graduates and on more medications. Patients with end-digit
preference reported greater variability in weight, and they generated an average 2.9 alerts to the telemonitoring system over the six-month trial period (95% CI, 2.3 to 3.5), compared with 2.3 for other patients (95% CI, 2.2 to 2.5).
Conclusions:As well as overshadowing clinically meaningful changes in weight, end-digit preference can lead to false alerts to telemonitoring systems, which may be associated with unnecessary treatment and alert fatigue. In this trial, end-digit preference was common and became increasingly so over time. By applying fraud detection methods to electronic medical data, it is possible to produce clinically significant information that can inform the design of initiatives to improve the accuracy of reporting.
Trial registration:ClinicalTrials.gov registration number NCT00303212 March 2006.
Keywords:Telemedicine, End-digit preference, Self-report, Alert fatigue
* Correspondence:[email protected]
3Data Analytics, The Health Foundation, 90 Long Acre, London WC2E 9RA,
UK
Full list of author information is available at the end of the article
Background
Heart failure affects five million people in the United States, [1] and is marked by episodes of acute decom-pensation with worsening signs and symptoms such as difficulty breathing, leg or feet swelling, and fatigue. Averting these episodes may have a stabilising effect on the progression of the disease, improving quality of life as well as averting costly hospital admissions. Many strategies rely on telemonitoring, whereby patients measure items such as body weight on a regular basis at home and relay that information to physicians working at a distance. Provided the information collected via telemonitoring is accurate, it may have utility to physi-cians when assessing the need for preventive measures to reduce the risk of acute decompensation.
Telemonitoring services for people with heart failure often emphasise weight monitoring, since a sudden change in weight can indicate fluid build-up, [2] and changes in body weight have been shown to be predictive of hospital admissions for heart failure [3, 4]. Weighing scales have been developed that relay readings automatic-ally to clinical teams (for example, over Bluetooth and home internet connections), without the need for tran-scription by the patient, but those devices can be costly [5] and are not always preferred by patients [6]. Therefore, simpler approaches have been advocated that allow pa-tients to use existing technology such as standalone weighing scales and telephone keypads [7]. But since those approaches require patients to enter data manually, reporting errors can occur, for example due to problems with memory or low engagement with the monitoring process. These inaccuracies can lead to false alerts as well as missed opportunities to deliver preventive care, adding to the complexity of managing the disease. It is important that clinical teams know how frequently patient-reported data are subject to common forms of error, and the char-acteristics of patients associated with worse reporting. However, despite the ubiquity of weight monitoring, [2] to our knowledge no studies have examined the accuracy of the patient-reported weights that emerge from telemoni-toring systems.
One of the methodological problems in this area is that, in everyday practice, it is not possible to compare weights that are measured by patients at home with a
‘gold standard’, for example weights that are measured contemporaneously by health care practitioners. In this paper, we adapt methods from the fraud detection litera-ture, [8, 9] which are based on theoretical models regarding the distribution of numbers that arise as part of natural processes. Fraud detection methods are appealing because they can be applied to existing data, without additional data collection. Since the accuracy of telemonitoring data will vary between health care sys-tems depending on the details of implementation and
local context, our method has been designed to enable local teams to monitor the accuracy of their telemonitor-ing data. As we describe below, similar methods have been applied in a diverse range of fields, such as forensic accounting and to uncover scientific fraud.
Our case study is a large randomised controlled trial of telemonitoring (the Telemonitoring to Improve Heart Failure Outcomes trial, or Tele-HF), [10] during which 826 patients with a recent hospital admission for heart failure were asked to submit daily weight measurements using their telephone keypads. We focus in particular on numbers that end with certain digits (specifically, 0 or 5), since a tendency towards these digits has been reported across a wide range of areas [11–13]. End-digit preference is common and can reduce the predictive sig-nal from patient-reported weight data –especially since, for patients with heart failure, clinically-significant changes in weight can be as small as two pounds (0.9 Kg) [14–18]. For example, if a patient regularly rounds their weight to the nearest five pounds, then a small change from 142 to 143 pounds from one day to the next would result in a false positive, since in that in-stance weight would be reported as jumping from 140 to 145 pounds. False negatives can also occur: for example, a large increase in weight from 143 to 147 pounds would register as no change under end-digit preference, even though it is an important factor to consider when pre-scribing diuretics or other preventive measures. Thus, there are several ways in which end-digit preference can limit the ability of health care professionals to offer timely and effective preventive care.
Methods
The Tele-HF trial
The Tele-HF trial recruited 1,653 patients with a recent hospital admission for heart failure from 33 cardiology practices across the United States. Patients were rando-mised to receive telemonitoring (n =826) or usual care (n =827) for six months [10].
Extent of end-digit preference
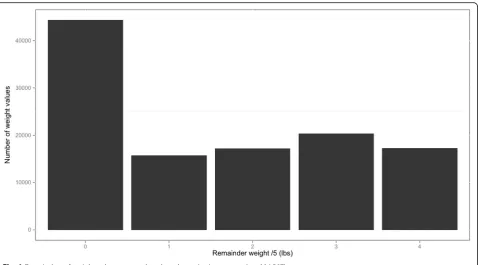
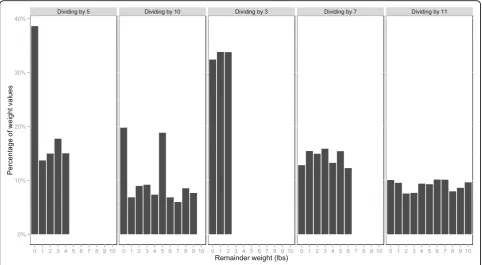
Many fraud detection methods have been developed to investigate the plausibility of a data set, within varied fields such as forensic accounting, [8] election fraud, [19] and scientific fraud [9]. These methods are often applications of Benford’s law, which states that, for cer-tain types of data, the leading digits follow a particular distribution, with more numbers beginning with 1 than any other digit [20]. Since weight readings do not follow this pattern, [21] we developed an approach based on the distribution of the final digits, [8, 19] rather than the leading digits. Specifically, we divided the reported weights by five and calculated the remainders – these could be equal to 0, 1, 2, 3 or 4. We reasoned that, if all patients reported their weight accurately, without end-digit preference, then all five remainders are equally likely to occur [22].
We began with a simple analysis, which assessed the number of weight readings affected by end-digit prefer-ence, rather than the number of patients affected. We conducted a chi-squared test to assess whether the dis-tribution of the remainders was statistically different from a uniform distribution. We estimated the number of weight readings affected by end-digit preference as the difference between: i) the number of weight readings that ended in 0 or a 5; and ii) the number of such read-ings that would be expected to arise by chance (i.e., 20% of the total number of weight readings).
We conducted logistic regression to test whether the probability of reporting weight as a multiple of five changed over time during the trial period – this might happen, for example, if patients adhered increasingly poorly to the telemonitoring schedule as time passed. In this regression, we included one observation for each of the weight readings that were reported during the trial period, with our dependent variable being a binary vari-able relating to whether or not the observed weight was a multiple of 5. The explanatory variable was the num-ber of days since study enrolment.
We checked the specificity of our results by repeating these procedures when dividing by prime numbers other than five. Then, having implemented these relatively straightforward methods, we further developed our approach to estimate the number of patients who were affected by end-digit preference (as opposed to the num-ber of readings), and the characteristics of those patients.
Estimating the number of patients with end digit preference and their characteristics
We hypothesised that there were two groups of patients: those with a preference for numbers ending in 0 or 5 and those without such a tendency. These groups were referred to as the End-Digit Preference (EDP) and No
End-Digit Preference (NEDP) groups, respectively. In the absence of a gold standard, EDP patients could not be identified directly from the data set, so we developed a two-stage method to estimating their number and characteristics. In the first stage, we identified a set of patients that was likely to be a superset of the EDP group: in other words, it con-tained the vast majority of EDP patients but also some NEDP patients. We refer to this superset as
‘A0’, for the reasons described below. Then, in the second stage of the analysis, we estimated the num-ber of EDP patients by subtracting from the numnum-ber of patients in A0 an estimate of the number of NEDP patients contained within A0. A similar ap-proach was applied to estimate the characteristics of EDP patients. Below, we describe the method in more detail.
We began by identifying telemonitoring patients who reported weights ending in 0 or 5 more frequently than would be expected by chance (hence the name ‘A0’: these patients tended to report weights that had a re-mainder of 0 after being divided by five). Not all of these patients had end-digit preference, since sometimes the true weight is a multiple of five, and where a patient’s weight is also relatively stable, a large proportion of their measurements could be multiples of five even without end-digit preference. Thus, A0 will contain some NEDP patients. Nevertheless, we show that our approach to de-fining A0 identifies the vast majority of EDP patients. To determine whether or not a given patient should be assigned to A0, we restricted our attention to the weight readings submitted by that patient, and calculated the percentage of the remainders that were equal to 0. That percentage was compared to 20% using the binomial proportion test. Any patient whose (one-sided) p-value was below 0.05 was assigned to A0. This decision rule is arbitrary–we could have used a different statistical test or a higher or lowerp-value threshold, but we chose the binomial proportion test and a threshold of 0.05 since they demonstrated some desirable qualities in initial sim-ulations (see Appendix A and B).
number of patients in A1-A4; we then subtracted that number from the total number of patients in A0 to estimate the number of EDP patients. By a similar argu-ment, we estimated the characteristics of NEDP patients in A0 by taking the average across all patients in sub-groups A1-A4. Then, the characteristics of EDP patients were estimated using a method based on weighted aver-ages (see Appendix A and B for more information). Con-fidence intervals were obtained for the characteristics of both groups using bootstrapping, which is a nonpara-metric statistical approach that relies on forming a large number of replica data sets. The replica data sets con-tained the same number of observations as the original data set, and were constructed by selecting observations with replacement from the original data. The quantity of interest was re-estimated on each replica data set using the methods described above, and then a confidence interval constructed based on the degree of variation observed across the replica data sets [23].
Our approach should ideally demonstrate two proper-ties. First, EDP patients should have a high probability of assignment to subgroup A0. Second, subgroups A1-A4 should consist exclusively of NEDP patients. A simula-tion study (described in Appendix A and B) confirmed the plausibility of both assumptions; however, we note here that our assumptions are both conservative. If some EDP patients were not assigned to subgroup A0, then we would have underestimated (rather than overesti-mated) the number of patients with EDP. Likewise, if subgroups A1-A4 contained some patients with EDP, then we would have underestimated the magnitude of the differences in baseline characteristics between the EDP and NEDP patients.
Analysis of telemonitoring alerts
In addition to comparing the baseline characteristics of EDP and NEDP patients, we compared the number of alerts to telemonitoring system for these two groups (these alerts were referred to as‘variances’in the original trial). We anticipated that EDP patients would trigger more alerts than NEDP patients, due to the extra volatil-ity in measurement induced by inaccurate reporting. One limitation of our method is that the analysis of alerts cannot be adjusted for differences in the baseline characteristics of the two groups, but we present our results to raise hypotheses for future studies and to illus-trate the potential implications of EDP.
Alerts were identified retrospectively by applying the algorithm adopted for the trial, [10] which required a change of at least three pounds in either direction from the first recorded weight. We assumed that alerts would not be generated for consecutive days, unless the pa-tient’s weight changed and was still at least three pounds from baseline. We also retrospectively applied another
algorithm, under which alerts were raised if weight changed by more than two pounds in either direction from one day to the next.
Results
Out of the 826 patients who were assigned to toring, 119 patients either did not activate the telemoni-toring equipment or could not be linked to the telemonitoring data for this study. Thus, we studied 707 patients, who submitted a total of 114,867 weight read-ings across the 180-day trial period (corresponding to 162 readings per patient on average).
Although we would expect around 22,973 of weight values to be a multiple of five (one-fifth of the total), there were in fact 44,346 such values (38.6%; see Fig. 1). Thus, there were 21,373 more multiples of five than would be expected–implying that 18.6% of all readings were affected by end-digit preference. The chi-squared test confirmed the pattern of remainders was unlikely to be the result of chance (test statistic = 25,350,p <0.001). Logistic regression found that patients were more likely to report their weight as a multiple of five as more time elapsed in the study (odds ratio per additional day since trial enrolment: 1.002, 95% confidence interval 1.001 to 1.002, p <0.001). As anticipated, our results were spe-cific to dividing by five rather than other prime numbers (Appendix A and B).
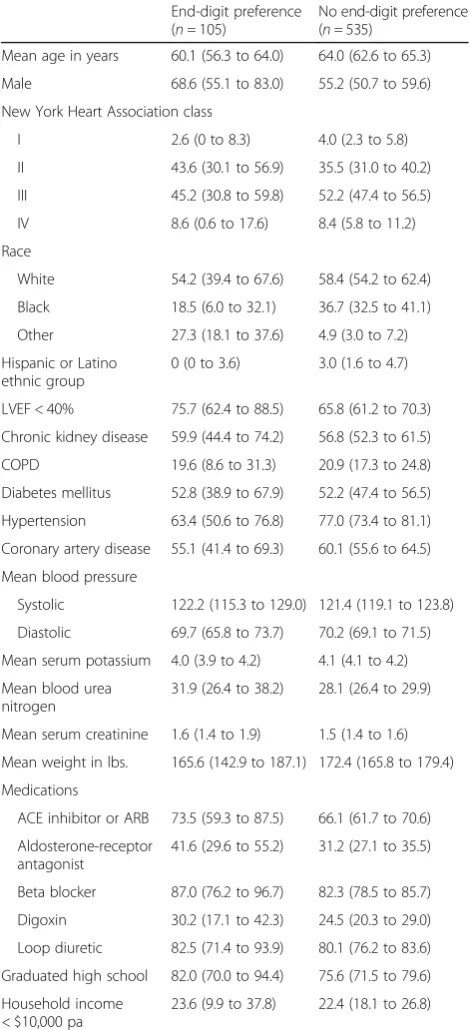
We identified 212 patients in subgroup A0, compared with 96, 107, 130 and 95 patients in A1, A2, A3 and A4, respectively. Since the mean number of patients across subgroups A1-A4 was 107, we estimated that there were at least 105 EDP patients (i.e., at least 14.9% of patients were subject to EDP). Systematic differences were found in the characteristics of patients in A0 versus the other subgroups (see Appendix A and B). By applying weighted averages, we estimated that, compared with NEDP patients, EDP patients were younger (mean age 60.1 vs. 64.0), more likely to be male (68.6%vs.55.2% of patients), less likely to have hypertension (63.4% vs. 77.0%), more likely to have graduated high school (82.0%vs.75.6%), and more likely to be in the ‘other’racial category (i.e., non-white and non-black, 27.3% vs.4.9%) - see Table 1. EDP patients also had lower baseline weight (165.6 vs. 172.4 pounds) than NEDP patients and received more of each of the five categories of medication. However, the 95% confi-dence intervals for EDP patients overlapped with those for NEDP patients for every variable apart from race.
four other subgroups, with a mean within-person variance of 4.73 (versus 3.57, 4.44, 4.20, and 4.42).
Discussion
Health care practitioners rely on self-reported weights to make treatment decisions for patients with heart failure, and inaccurate data will add to the complexity of managing the disease. However, within the Telemonitoring to Improve Heart Failure Outcomes trial, almost one-fifth (18.6%) of weight values were inaccurate due to end-digit preference, and these inaccuracies became more frequent as the trial progressed (p <0.001). A pattern emerged that patients with end-digit preference were younger, more likely to be male, more likely to have gradu-ated high school, and less likely to be in white or black racial groups than other patients. A larger study is needed to confirm these differences between the characteristics of EDP and NEDP patients, since in this study the 95% confidence intervals overlapped for every variable apart from race.
These findings are concerning because clinically-significant changes in weight can be as small as two pounds for patients with heart failure, meaning that rounding can result in both false positives and false neg-atives. Indeed, we observed that patients with end-digit preference generated an average of 2.9 alerts to the tele-monitoring system over the six-month trial period (95%
CI, 2.3 to 3.5), compared with 2.3 for other patients (95% CI, 2.2 to 2.5), even though the baseline character-istics of the end-digit preference group did not indicate higher clinical risk. It is possible that the extra volatility induced by measurement error led to more false posi-tives amongst the group with end-digit preference, in turn potentially leading to unnecessary treatment and
‘alert fatigue’ on the part of health care practitioners [24]. We also observed that end-digit preference became more common over time, which might indicate that patients engaged less with the monitoring process as time wore on. To improve the situation, telemonitoring services that use self-reported data will need to be com-plemented with efforts to improve the accuracy of report-ing, and the methods presented in this paper could be applied to local data sets to determine how to target these interventions on certain population groups.
not able to recall weight measurements accurately, or that patients were reluctant to weigh themselves frequently (perhaps because they perceived that the process unnecessarily reminded them of their health conditions or because they did not believe the
intervention to be effective) [25]. Such subjects may have approximated their weight to satisfy the input method for the study, particularly as there was not an option to ‘skip’a question during the telephone calls.
There is little prior information from the telemoni-toring literature regarding which patient characteristics are associated with accurate reporting, though one previous study from a non-telemonitoring setting re-ported gender differences in whether weight readings were rounded up or down [22]. There may be clues from other areas: for example, studies examining the relationship between patient demographics and the ac-curacy of self-reported data on service utilisation have produced mixed results, but older age typically emerges as a factor associated with inaccurate report-ing [26, 27]. It is possible that hypertensive patients were more familiar with the need to record health sta-tus accurately because they already monitored their blood pressure, explaining their lower levels of end-digit preference in this study. Differences by racial group might in part reflect differences in end-digit preference by language [11].
Strengths and limitations
Our method did not rely on comparisons between patient-reported weight and readings obtained by health care teams, since those comparisons are not usually possible within routine clinical practice. In-stead, we identified patients submitting an unusually high number of round numbers, and corrected for chance occurrences to estimate the characteristics of the group of individuals with end-digit preference. However, while our study reflected the usual situation within routine practice, we could not assess the ac-curacy of individual weight readings, whether patients weighed themselves as instructed, whether weight readings were rounded accurately, or whether there was a systematic tendency to over or under report weights.
Table 1Baseline characteristics of patients with and without end-digit preference. Data show percentages or mean values (95% confidence intervals)
End-digit preference (n =105)
No end-digit preference (n =535)
Mean age in years 60.1 (56.3 to 64.0) 64.0 (62.6 to 65.3)
Male 68.6 (55.1 to 83.0) 55.2 (50.7 to 59.6)
New York Heart Association class
I 2.6 (0 to 8.3) 4.0 (2.3 to 5.8)
II 43.6 (30.1 to 56.9) 35.5 (31.0 to 40.2)
III 45.2 (30.8 to 59.8) 52.2 (47.4 to 56.5)
IV 8.6 (0.6 to 17.6) 8.4 (5.8 to 11.2)
Race
White 54.2 (39.4 to 67.6) 58.4 (54.2 to 62.4)
Black 18.5 (6.0 to 32.1) 36.7 (32.5 to 41.1)
Other 27.3 (18.1 to 37.6) 4.9 (3.0 to 7.2)
Hispanic or Latino ethnic group
0 (0 to 3.6) 3.0 (1.6 to 4.7)
LVEF < 40% 75.7 (62.4 to 88.5) 65.8 (61.2 to 70.3)
Chronic kidney disease 59.9 (44.4 to 74.2) 56.8 (52.3 to 61.5)
COPD 19.6 (8.6 to 31.3) 20.9 (17.3 to 24.8)
Diabetes mellitus 52.8 (38.9 to 67.9) 52.2 (47.4 to 56.5)
Hypertension 63.4 (50.6 to 76.8) 77.0 (73.4 to 81.1)
Coronary artery disease 55.1 (41.4 to 69.3) 60.1 (55.6 to 64.5)
Mean blood pressure
Systolic 122.2 (115.3 to 129.0) 121.4 (119.1 to 123.8)
Diastolic 69.7 (65.8 to 73.7) 70.2 (69.1 to 71.5)
Mean serum potassium 4.0 (3.9 to 4.2) 4.1 (4.1 to 4.2)
Mean blood urea nitrogen
31.9 (26.4 to 38.2) 28.1 (26.4 to 29.9)
Mean serum creatinine 1.6 (1.4 to 1.9) 1.5 (1.4 to 1.6)
Mean weight in lbs. 165.6 (142.9 to 187.1) 172.4 (165.8 to 179.4)
Medications
ACE inhibitor or ARB 73.5 (59.3 to 87.5) 66.1 (61.7 to 70.6)
Aldosterone-receptor antagonist
41.6 (29.6 to 55.2) 31.2 (27.1 to 35.5)
Beta blocker 87.0 (76.2 to 96.7) 82.3 (78.5 to 85.7)
Digoxin 30.2 (17.1 to 42.3) 24.5 (20.3 to 29.0)
Loop diuretic 82.5 (71.4 to 93.9) 80.1 (76.2 to 83.6)
Graduated high school 82.0 (70.0 to 94.4) 75.6 (71.5 to 79.6)
Household income < $10,000 pa
23.6 (9.9 to 37.8) 22.4 (18.1 to 26.8)
Table 2Alerts triggered by patients with and without end-digit preference during the six-month trial period (95% confidence intervals)
End-digit preference (n =105)
No end-digit preference (n =535)
Mean number of alerts (Tele-HF)a
2.9 (2.3 to 3.5) 2.3 (2.2 to 2.5)
Mean number of alerts
(2 pound)b 3.2 (2.6 to 3.7) 2.6 (2.4 to 2.7) a
A difference of more than three pounds in either direction from the first-recorded weight
b
Since our sample was recruited from 33 cardiology practices across the United States, we expect it to be broadly representative of the population with heart failure receiving telemonitoring in routine settings. How-ever, the patients examined were receiving an active intervention, which may have influenced the reported values, [28] and perhaps improved reporting relative to routine practice.
This study used a balance of conventional and more innovative techniques. We adopted a relatively straightforward method to estimate the total number of weight readings that were subject to end-digit pref-erence, which was based on dividing the reported weights by five and comparing the resultant distribu-tion with the uniform distribudistribu-tion. Our method for determining the number of patients with end-digit preference and their characteristics was necessarily more sophisticated, and it relied on two assumptions: first, that all patients with end-digit preference were contained within a specific subgroup of patients (‘A0’); and second, that none of those patients were present in four other subgroups (‘A1-A4’). Our simulations confirmed that these assumptions were plausible, but in any case our method is conservative. Thus, we have produced a lower bound for the number of patients with end-digit preference, which might have exceeded 105 (or 14.9% of the total). In particular, we may have missed ‘occasional rounders’ and people who had strong end-digit preference but submitted relatively few readings. These considerations mean that the dif-ferences in patient characteristics between EDP and NEDP groups might differ than those reported in Table 1, and likewise for the alerting rates in Table 2. As we note above, the confidence intervals reported for EDP patients in Tables 1 and 2 overlapped with those for NEDP patients, so a larger study is needed to produce more definitive information about which patient characteristics are associated with end-digit preference. Other methods could also be pursued, such as those that model end-digit preference as a la-tent variable. Finally, we note that this study examined end-digit preference, but other forms of self-report error may exist.
Problems with self-report error are well recognised across a range of other areas, [29] although previous studies have not examined data from telemonitoring systems, or used fraud-detection techniques [11–13]. Our method can be applied to quantify end-digit preference in telemonitoring services for other condi-tions, such as blood pressure monitoring for hyper-tension [7]. The method might also be used to test the accuracy of information recorded in the electronic medical record, such as blood pressure and heart rate.
Conclusion
Our study can be considered an example of ‘failure analysis’, [30] since it retrospectively examines data collected for an intervention that did not produce its intended outcomes, and considers an element that was presumed to be precondition for its success (namely, the ability to collect reliable data from patients on their body weight using existing technology). We found that end-digit preference was prevalent in the Tele-HF trial, affecting almost one-fifth of readings. However, it is unclear to what extent these inaccur-acies accounted for the failure of the telemonitoring intervention tested within the Tele-HF trial to reduce hospital readmissions and mortality [16]. Health care practitioners may have been able to compensate for er-rors in the data when making decisions. Additionally, there can be multiple points of failure for complex in-terventions. Telemonitoring requires several other ele-ments, including approaches to patient selection, predictive algorithms, and preventive care. Another randomised controlled trial reported no association be-tween telemonitoring and hospital admissions, even though weights were transferred automatically rather than using self-reports [31].
Since end-digit preference can lead to both false positives and false negatives and potentially contribute towards alert fatigue, our results have implications for the design of telemonitoring services. The problem may be concentrated among patients who are in cer-tain groups and thus one response is to develop tar-geted interventions to educate those patients about the need for accurate transcription of data (for ex-ample, through reminder messages within the tele-phone calls). These initiatives could be targeted using analyses similar to those presented here and, indeed, one of the advantages of our method is that could be applied to existing data sets held by individual clinics. Additional encouragement may be required as time wears on. Another approach to addressing reporting error is to use specialised telemonitoring peripherals, but the implications for patient engagement and cost would need to be assessed. Regardless of the approach, our findings lead us to emphasise the need to be mindful of bias when using self-reported data within clinical practice.
Appendix A: Simulation analysis
Introduction
In paper, we describe our approach to estimating the number of EDP and NEDP patients and the differences in their baseline characteristics.
other words, if subgroup A0 contained no people, and
likewise for subgroups A1-A4, then we calculated the number of EDP patients as:
n0−
X4
i¼1ni
=
4
The number of NEDP patients was estimated as the number of patients remaining in A0, once the EDPs had been removed, plus the number in subgroups A1-A4.
We estimated the baseline characteristics of NEDP patients as the average across patients in subgroups A1-A4. Then, we estimated the baseline characteris-tics of EDP patients by taking weighted averages. For example, if the average age of subgroup A0 was xo
years, and likewise for subgroups A1-A4, then we cal-culated the average age of EDP patients according to the following formula:
noxo−
X4
i¼1nixi
=
4n0−
X4
i¼1ni
=
4
This method relies on the two assumptions:
1. EDP patients have a high probability of being assigned to subgroup A0.
2. Subgroups A1-A4 consisted exclusively of NEDP patients.
Assumption (1) is important to avoid underestimating the number of patients with EDP, since otherwise some EDP patients might be lost to the analysis. Assumption (2) ensures that subgroups A1-A4 provide an estimate of the number and characteristics of NEDP patients in sub-group A0. Although we could not directly verify either of these assumptions from the data, we conducted pre-liminary simulations to investigate their plausibility, which are described below.
Summary of the findings from the simulations
The simulations described below show that assumption 1 is likely to hold provided patients submitted weight readings on a minimum number of days (broadly, 20 days out of the possible 180 days in the trial period). This was indeed the case, but patients with both EDP and very poor levels of compliance to telemonitoring will be underrepresented in our empirical findings. The simulations indicated that assumption 2 is likely to hold provided that there is a minimum level of variabil-ity in the underlying weights. The required level of variability was relatively low, broadly requiring that a patient had at least a 5% chance of seeing a change in weight of 1 pound or more on any given day. If, on the
other hand, the weight of some patients came from a distribution that is more stable than this, then our find-ings would be biased towards the null: in other words, the differences between the characteristics of EDP and NEDP patients would be understated.
Methods for the simulation study Data generating process
The simulations used a random walk process to generate weight data for a large number of hypothetical individuals with heart failure (n = 10,000). The data generating process assumed that the change in a person’s weight from one day to the next was normally distributed. The mean daily weight change was assumed to be 0 (i.e., no system-atic growth or reduction in weight over time), while vari-ous scenarios were considered for the standard deviation of the daily weight change (0.05, 0.1, 0.5 and 1 pounds). Our main set of simulations assumed that patients sub-mitted weight readings on 162 days during the six-month trial period, the average seen for telemonitoring patients in the trial, but we also conducted other scenarios (10, 20, 40, 60, 80 and 180 days).
Having generated the weight progressions, we ran-domly assigned a certain proportion of the patients to the end-digit preference group. Various scenarios were considered for the percentage of patients with this pref-erence (15%, 30%, and 60%). Patients with end-digit preference were assumed to apply these preferences on a certain proportion of days, and again various scenarios were considered for how often this occurred (30%, 50% and 70% of days). The probability of an EDP patient ex-pressing their preference to report weight as a multiple of five was assumed to be independent of their weight.
Classifying the simulated patients to EDP and NEDP groups We applied the procedure described in the main paper to the simulated weight progressions. Thus, for each of the scenarios described above, we examined how likely EDP and NEDP patients were to be assigned to the vari-ous subgroups. Specifically, we calculated quantities that enabled us to test the plausibility of the two assumptions described above:
The proportion of EDP patients who were correctly assigned to subgroup A0, and the proportion of EDP patients who were assigned to any of the subgroups A1-A4. As set out in assumption 1, ideally all EDP patients would be assigned to A0, as this would support the view that our empirical findings will reflect the entirety of this group.
subgroup A0 (assumption 2). If subgroups A1-A4 contained some EDP patients, this would bias our results towards the null.
We also report the results of a chi-squared test for the null hypothesis that NEDP patients have an equal probability of assignment to any of the sub-groups A0-A4. This is the basis for our symmetry argument.
Limiting scenario
Ultimately, subgroup assignment was based on taking the integer part of the reported weight and calculating the remainder after dividing this by 5 (i.e., modulo 5). Thus, as the standard deviation for the change in weight increases, the weight progressions modulo 5 be-come increasingly similar to a random process whereby successive weight values are sampled independently from the uniform distribution on the values {0, 1, 2, 3, and 4}. We also modelled this limiting scenario, as well as the scenario whereby all weights remain constant over time (i.e., the standard deviation of the daily weight change was 0). Starting values for weight were uniformly distributed on {0, 1, 2, 3, and 4} in all scenarios.
Results of the simulation study
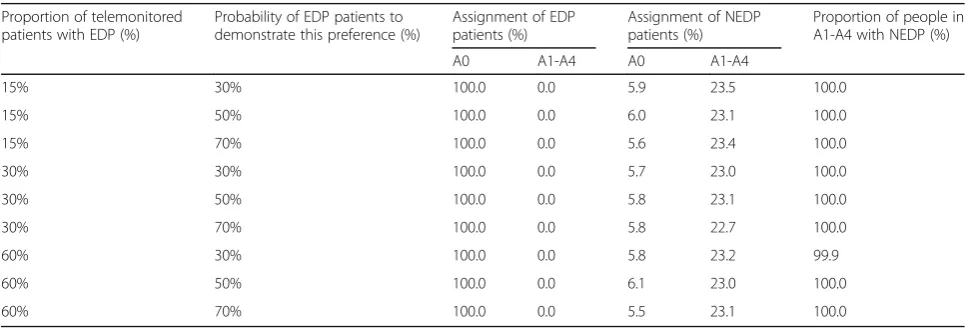
Table 3 in Appendix shows the results of the simulation for the limiting scenario whereby weight values are sampled independently from the uniform distribution on {0, 1, 2, 3, and 4}. In this scenario, EDP patients had a high probability of being assigned to subgroup A0 (virtually 100%) and subgroups A1-A4 consisted virtu-ally exclusively of patients without end-digit preference (again, virtually 100%). Although it has no conse-quences for the bias of our ultimate estimates, a signifi-cant proportion of NEDP patients were not assigned to
a subgroup (70%). There was no evidence that NEDP patients had an unequal probability of being assigned to each of the five subgroups (p-value from chi-squared test greater than 0.10 in all cases).
Table 4 in Appendix shows results when there is some autocorrelation between successive weight read-ings (i.e., weights were taken from a normal distribu-tion). EDP patients still had a very high probability of being assigned to subgroup A0 (virtually 100%). How-ever, in these scenarios, up to 15% of patients in sub-groups A1-A4 were EDP patients (since EDP patients could be assigned to multiple subgroups when the standard deviation for the daily weight change was low). The worse case scenario was when weights were constant over time (i.e., the standard deviation was 0) and the picture steadily improved when the weights be-came more variable.
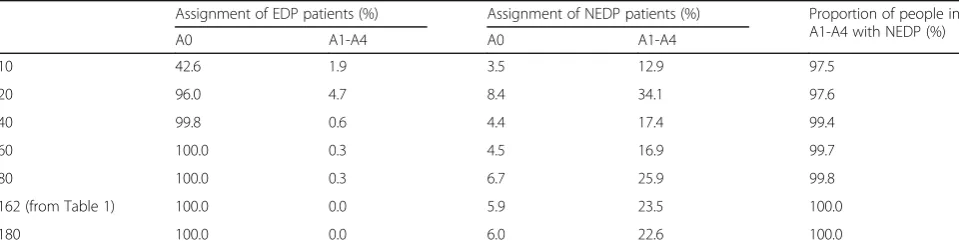
Table 5 in Appendix reports the impact of varying the assumption about how often telemonitored pa-tients submit weight readings, on the assumption that weight changes show considerable variability over time (i.e., under the limiting scenario shown in Table 3 in Appendix). In these simulations, 42.6% of EDP patients who submitted readings on only 10 days were assigned to subgroup A0, while 1.9% of EDP pa-tients were assigned to one of subgroups A1-A4. Thus, amongst patients with EDP who submitted weight readings on only 10 days, 55.5% were lost to our analysis. This is to be expected since, in those cases, there was insufficient history to establish pat-terns of reporting that were consistent with end-digit preference. However, amongst EDP patients who sub-mitted weight readings on 20 days, 96.0% were cor-rectly assigned to subgroup A0, and fewer than 4% were lost to the analysis. Amongst those who submit-ted weight readings on 40 days, 99.8% were correctly assigned to subgroup A0. Moreover, in all of the
Table 3Simulation analysis
Proportion of telemonitored patients with EDP (%)
Probability of EDP patients to demonstrate this preference (%)
Assignment of EDP patients (%)
Assignment of NEDP patients (%)
Proportion of people in A1-A4 with NEDP (%)
A0 A1-A4 A0 A1-A4
15% 30% 100.0 0.0 5.9 23.5 100.0
15% 50% 100.0 0.0 6.0 23.1 100.0
15% 70% 100.0 0.0 5.6 23.4 100.0
30% 30% 100.0 0.0 5.7 23.0 100.0
30% 50% 100.0 0.0 5.8 23.1 100.0
30% 70% 100.0 0.0 5.8 22.7 100.0
60% 30% 100.0 0.0 5.8 23.2 99.9
60% 50% 100.0 0.0 6.1 23.0 100.0
60% 70% 100.0 0.0 5.5 23.1 100.0
scenarios described in Table 5 in Appendix, sub-groups A1-A4 consisted almost exclusively of NEDP patients, as desired.
Discussion
The simulations broadly support the two assumptions made in the empirical work.
Assumption 1: EDP patients have a high probability of being assigned to subgroup A0. This assumption was found to be plausible in the scenarios set out in Tables 3 and 4 in Appendix, but Table 5 in Appendix indicates that patients with EDP and a low number of weight readings might have been lost to our analysis. However, on average patients in the Tele-HF trial submitted weight readings on 162 days, whereas our simulations indicated that only 20 readings were required to pick up patients’ end-digit preference. Amongst those with very poor levels of compliance to telemonitoring, patients with EDP will be underrepresented in our empirical findings.
Assumption 2: Subgroups A1-A4 consisted exclusively of NEDP patients. In the simulations, this assumption was found to be plausible if patients with heart fail-ure show a minimum level of variability in their weight from one day to the next. The required level of variability was relatively low, corresponding to a standard deviation of 0.5 pounds, implying that weight changed by more than 1 pound on fewer than 5% of days. If there was not much variability in weight, then the simulations suggested that subgroups A1-A4 might contain some patients with EDP, which has the potential to bias the results of our empirical analysis towards the null. However, even if weights were completely constant over time, then NEDP pa-tients would still comprise 85% of people in sub-groups A1-A4.
Thus, the simulations broadly support the methods presented in the main paper, though as in any simu-lation study, we addressed a limited number of scenarios.
Table 4Simulation analysis–effect of alternative assumptions for weight progression
Standard deviation for daily weight change
Assignment of EDP patients (%) Assignment of NEDP patients (%) Proportion of people in A1-A4 with NEDP (%)
A0 A1-A4 A0 A1-A4
0 (Weights constant over time) 100.0 79.1 20.9 79.1 85.0
0.05 100.0 83.8 27.8 87.2 85.5
0.1 100.0 83.9 33.2 92.6 86.2
0.5 100.0 10.4 24.8 75.4 97.6
1.0 100.0 0.2 11.0 43.0 99.9
Limiting scenario (from Table 1) 100.0 0.0 5.9 23.5 100.0
Note: Assumes 15% of patients have EDP, 30% of the time. Patients submitted weight readings on 162 days. Based on 10,000 replications of the simulation experiment
Table 5Simulation analysis–effect of alternative assumptions for number of weight readings submitted
Assignment of EDP patients (%) Assignment of NEDP patients (%) Proportion of people in A1-A4 with NEDP (%)
A0 A1-A4 A0 A1-A4
10 42.6 1.9 3.5 12.9 97.5
20 96.0 4.7 8.4 34.1 97.6
40 99.8 0.6 4.4 17.4 99.4
60 100.0 0.3 4.5 16.9 99.7
80 100.0 0.3 6.7 25.9 99.8
162 (from Table 1) 100.0 0.0 5.9 23.5 100.0
180 100.0 0.0 6.0 22.6 100.0
Appendix B: Baseline characteristics for all subgroups, and sensitivity analyses
Table 6Baseline characteristics of patients in subgroups A0-A4. Data show percentages (numbers of patients) unless stated otherwise
A0 (n =212) A1 (n =96) A2 (n =107) A3 (n =130) A4 (n =95)
Mean age in years (SD) 62.1 (13.8) 66.1 (14.1) 65.1 (14.2) 63.1 (14.7) 62.1 (15.2)
Male 61.8 (131) 59.4 (57) 58.9 (63) 50.8 (66) 52.6 (50)
New York Heart Association class
I 3.3 (7) 3.1 (3) 3.7 (4) 5.4 (7) 3.2 (3)
II 39.6 (84) 34.4 (33) 43.9 (47) 30.8 (40) 33.7 (32)
III 48.6 (103) 54.2 (52) 45.8 (49) 52.3 (68) 56.8 (54)
IV 8.5 (18) 8.3 (8) 6.5 (7) 11.5 (15) 6.3 (6)
Race
White 56.1 (119) 56.3 (54) 63.6 (68) 56.9 (74) 56.8 (54)
Black 27.8 (59) 36.5 (35) 34.6 (37) 36.9 (48) 38.9 (37)
Other 16.0 (34) 7.3 (7) 1.9 (2) 6.2 (8) 4.2 (4)
Hispanic or Latino ethnic group 1.4 (3) 2.1 (2) 1.9 (2) 4.6 (6) 3.2 (3)
LVEF < 40%a 70.8 (148) 71.7 (66) 62.1 (64) 66.7 (84) 62.4 (58)
Chronic kidney diseaseb 58.2 (121) 58.3 (56) 62.3 (66) 50.8 (66) 57.4 (54)
COPD 20.3 (43) 28.1 (27) 21.5 (23) 16.2 (21) 18.9 (18)
Diabetes mellitus 52.4 (111) 54.2 (52) 54.2 (58) 53.8 (70) 46.3 (44)
Hypertension 70.3 (149) 78.1 (75) 76.6 (82) 77.7 (101) 75.8 (72)
Coronary artery disease 57.5 (122) 63.5 (61) 56.1 (60) 61.5 (80) 58.9 (56)
Mean blood pressure (SD)
Systolic 122.1 (23.8) 122.1 (25.4) 120.1 (22.5) 123.1 (24.6) 121.1 (24.5)
Diastolic 70.1 (13.8) 70.1 (14.3) 70.1 (12.2) 70.1 (13.6) 71.1 (12.7)
Mean serum potassium (SD)c 4.1 (0.6) 4.1 (0.5) 4.1 (0.6) 4.1 (0.6) 4.1 (0.5)
Mean blood urea nitrogen (SD)d 30.1 (20.3) 27.1 (16.3) 30.1 (16.7) 28.1 (18.8) 27.1 (15.4)
Mean serum creatinine (SD)e 2.1 (0.9) 1.1 (0.8) 2.1 (0.9) 1.1 (0.8) 1.1 (0.7)
Mean weight in lbs. (SD) 169.1 (79.6) 175.1 (72.5) 173.1 (76.1) 170.1 (73.2) 173.1 (67.3)
Medications
ACE inhibitor or ARB 69.8 (148) 64.6 (62) 66.4 (71) 70.0 (91) 62.1 (59)
Aldosterone-receptor antagonist 36.3 (77) 31.3 (30) 29.0 (31) 33.1 (43) 31.6 (30)
Beta blocker 84.4 (179) 84.4 (81) 80.4 (86) 82.3 (107) 82.1 (78)
Digoxin 27.4 (58) 28.1 (27) 20.6 (22) 22.3 (29) 28.4 (27)
Loop diuretic 81.1 (172) 79.2 (76) 79.4 (85) 83.1 (108) 77.9 (74)
Did not graduate high schoolf 21.3 (43) 23.7 (22) 23.5 (24) 26.1 (31) 24.2 (22)
Household income < $10,000 pag 23.1 (39) 22.4 (17) 17.3 (14) 26.9 (28) 21.3 (16) a
N =209, 92, 103, 126, 93 b
N =208, 96, 106, 130, 94 c
N =204, 95, 104, 128, 93 d
N =206, 94, 102, 126, 92 e
N =208, 96, 106, 130, 94 f
N =202, 93, 102, 119, 91 g
Abbreviations
EDP:End digit preference; NEDP: No end digit preference; Tele-HF: Telemonitoring to improve heart failure outcomes
Acknowledgements
We thank the anonymous peer reviewers, who gave helpful comments on a previous version of this manuscript.
Funding
The Tele-HF trial was supported by a grant (5 R01 HL080228) from the National Heart, Lung, and Blood Institute. AS was a Harkness Fellow in Health Care Policy and Practice, and received support from The Commonwealth Fund while preparing this article. The views presented here are those of the authors and should not be attributed to The Commonwealth Fund or its directors, officers, or staff.
Availability of data and materials
The data that support the findings of this study are available from CORE but restrictions apply to the availability of these data, which were used under license for the current study, and so are not publicly available. Data are however available from the authors upon reasonable request and with permission of CORE.
Author contributions
SIC, ZL, JAM and HMK were members of the original Tele-HF study team. AS led the design of this study, conducted the analyses and prepared the first draft of this manuscript. ZL prepared the constituent data files. All authors reviewed the manuscript. All the authors read and approved the final version of the manuscript.
Competing interests
HMK is the recipient of research grants from Medtronic and from Johnson & Johnson, through Yale University, to develop methods of clinical trial data sharing, and is chair of a cardiac scientific advisory board for UnitedHealth. HMK is supported by grant U01 HL105270-06 (Center for Cardiovascular Outcomes Research at Yale University) from the National Heart, Lung, and Blood Institute in Bethesda, Maryland.
Consent for publication
Not applicable.
Ethics approval and consent to participate
The Telemonitoring to Improve Heart Failure Outcomes trial was approved by the institutional review board at Yale University School of Medicine. All the patients participating in the trial provided written informed consent before randomisation.
Publisher’s Note
Springer Nature remains neutral with regard to jurisdictional claims in published maps and institutional affiliations.
Author details
1Center for Outcomes Research and Evaluation, Yale School of Medicine,
New Haven, USA.2Yale School of Medicine, New Haven, USA.3Data Analytics, The Health Foundation, 90 Long Acre, London WC2E 9RA, UK.
Received: 2 June 2016 Accepted: 16 March 2017
References
1. Dharmarajan K, Hsieh AF, Lin Z, et al. Diagnoses and timing of 30-day readmissions after hospitalization for heart failure, acute myocardial infarction, or pneumonia. JAMA. 2013;309:355–63. doi:10.1001/jama.2012. 216476.
2. Jessup M, Abraham WT, Casey DE, et al. 2009 Focused update: ACCF/AHA guidelines for the diagnosis and management of heart failure in adults. Circulation. 2009;119:1977-2016. doi:10.1161/CIRCULATIONAHA.109.192064. 3. Chaudhry SI, Wang Y, Concato J, et al. Patterns of weight change preceding
hospitalization for heart failure. Circulation. 2007;116:1549–54. doi:10.1161/CIRCULATIONAHA.107.690768.
4. Zhang J, Goode KM, Cuddihy PE, et al. Predicting hospitalization due to worsening heart failure using daily weight measurement: analysis of the trans-european network-home-care management system (TEN-HMS) study. Eur J Heart Fail. 2009;11:420–7. doi: 10.1093/eurjhf/hfp033.
5. Henderson C, Knapp M, Fernandez J-L, et al. Cost effectiveness of telehealth for patients with long term conditions (Whole Systems Demonstrator telehealth questionnaire study): nested economic evaluation in a pragmatic, cluster randomised controlled trial. BMJ. 2013;346:f1035. doi:10.1136/bmj.f1035.
6. Wherton J, Sugarhood P, Procter R, et al. Designing assisted living technologies‘in the wild’: preliminary experiences with cultural probe methodology. BMC Med Res Methodol. 2012;12:188.
doi:10.1186/1471-2288-12-188.
7. Taylor L, Birch-Jones J. Implementing a technology enabled care service. Br J Healthc Manag. 2016;22:23–33. doi:10.12968/bjhc.2016.22.1.23. 8. Dlugosz S, Müller-Funk U. The value of the last digit: Statistical fraud
detection with digit analysis. Adv Data Anal Classif. 2009;3:281–90. doi:10.1007/s11634-009-0048-5.
9. Al-Marzouki S, Evans S, Marshall T, et al. Are these data real? Statistical methods for the detection of data fabrication in clinical trials. BMJ. 2005;331:267–70. doi:10.1136/bmj.331.7511.267.
10. Chaudhry SI, Barton B, Mattera J, et al. Randomized trial of telemonitoring to improve heart failure outcomes (TELE-HF): study design. J Card Fail. 2007; 13:709–14. doi:10.1016/j.cardfail.2007.06.720.
11. Bopp M, Faeh D. End-digits preference for self-reported height depends on language. BMC Public Health. 2008;8:342. doi:10.1186/1471-2458-8-342.
12. Taylor AW, Dal Grande E, Gill TK, et al. How valid are self-reported height and weight? A comparison between CATI self-report and clinic measurements using a large cohort study. Aust N Z J Public Health. 2006;30:238–46. http://www.ncbi.nlm.nih.gov/pubmed/16800200. Accessed 16 Jul 2014.
13. Dahl AK, Reynolds CA. Accuracy of recalled body weight–a study with 20-years of follow-up. Obesity (Silver Spring). 2013;21:1293–8. doi:10.1002/oby.20299.
14. Heart Failure Society of America. Self care: following your treatment plan and dealing with your symptoms. Bethesda: Heart Failure Society of America; 2014. http://www.abouthf.org/module4/default.htm.
15. Takahashi PY, Pecina JL, Upatising B, et al. A randomized controlled trial of telemonitoring in older adults with multiple health issues to prevent hospitalizations and emergency department visits. JAMA Intern Med. 2012;172:773–9. doi:10.1001/archinternmed.2012.256.
16. Chaudhry SI, Mattera JA, Curtis JP, et al. Telemonitoring in patients with heart failure. N Engl J Med. 2010;363:2301–9. doi:10.1056/NEJMoa1010029. 17. Seibert PS, Whitmore TA, Patterson C, et al. Telemedicine facilitates CHF
home health care for those with systolic dysfunction. Int J Telemed Appl. 2008;2008:235031. doi:10.1155/2008/235031.
18. Bakhshi S, Li X, Semenov N, et al. Congestive heart failure home monitoring pilot study in urban denver. Conf Proc IEEE Eng Med Biol Soc.
2011;2011:3150–3. doi:10.1109/IEMBS.2011.6090859.
19. Beber B, Scacco A. What the numbers say: A digit-based test for election fraud. Polit Anal. 2012;20:211–34. doi:10.1093/pan/mps003.
20. Nigrini MJ. Persistent Patterns in Stock Returns, Stock Volumes, and Accounting Data in the U.S. Capital Markets. J Accounting, Audit Financ. 2015;30:541-57. doi:10.1177/0148558X15584051.
21. Beer TW. Terminal digit preference: beware of Benford’s law. J Clin Pathol. 2009;62:192. doi:10.1136/jcp.2008.061721.
22. Rowland ML. Self-reported weight and height. Am J Clin Nutr. 1990;52:1125–33. http://www.ncbi.nlm.nih.gov/pubmed/2239790. Accessed 16 Jul 2014.
23. Efron B, Tibshirani RJ. An Introduction to the Bootstrap. Boca Raton: Chapman and Hall/CRC; 1994.
24. Burton C, Pinnock H, McKinstry B. Changes in telemonitored physiological variables and symptoms prior to exacerbations of chronic obstructive pulmonary disease. J Telemed Telecare. 2015;21:29–36.
doi:10.1177/1357633x14562733.
25. Sanders C, Rogers A, Bowen R, et al. Exploring barriers to participation and adoption of telehealth and telecare within the whole system demonstrator trial: a qualitative study. BMC Health Serv Res. 2012;12:220.
doi:10.1186/1472-6963-12-220.
26. Bhandari A, Wagner T. Self-reported utilization of health care services: improving measurement and accuracy. Med Care Res Rev. 2006;63:217–35. doi:10.1177/1077558705285298.
27. Bellón JÁ, Lardelli P, Luna JD, et al. Validity of self reported utilisation of primary health care services in an urban population in Spain. J Epidemiol Community Health. 2000;54:544–51. doi:10.1136/jech.54.7.544.
28. Pronk NP, Crain AL, VanWormer JJ, et al. The use of telehealth technology in assessing the accuracy of self-reported weight and the impact of a daily immediate-feedback intervention among obese employees. Int J Telemed Appl. 2011;2011:909248. doi:10.1155/2011/909248.
29. Wallihan DB, Stump TE, Callahan CM. Accuracy of self-reported health services use and patterns of care among urban older adults. Med Care. 1999;37:662–70. http://www.ncbi.nlm.nih.gov/pubmed/10424637. 30. Boruch R and Ruby A. To flop is human: inventing better scientific
approaches to anticipating failure. In: Emerging trends in the social and behavioral sciences: an interdisciplinary, searchable, and linkable resource. Eds: RA. Scott, MC Buchmann, and SM Kosslyn. 2015; John Wiley & Sons, Inc. http://dx.doi.org/10.1002/9781118900772.etrds0362.
31. Koehler F, Winkler S, Schieber M, et al. Impact of remote telemedical management on mortality and hospitalizations in ambulatory patients with chronic heart failure: the telemedical interventional monitoring in heart failure study. Circulation. 2011;123:1873-80. doi:10.1161/CIRCULATIONAHA. 111.018473.
• We accept pre-submission inquiries
• Our selector tool helps you to find the most relevant journal
• We provide round the clock customer support
• Convenient online submission
• Thorough peer review
• Inclusion in PubMed and all major indexing services
• Maximum visibility for your research
Submit your manuscript at www.biomedcentral.com/submit