M E T H O D
Open Access
HLA typing from RNA-Seq sequence reads
Sebastian Boegel
1,2, Martin Löwer
1, Michael Schäfer
1,2, Thomas Bukur
1, Jos de Graaf
1, Valesca Boisguérin
1,
Özlem Türeci
3, Mustafa Diken
1, John C Castle
1*and Ugur Sahin
1,2*Abstract
We present a method, seq2HLA, for obtaining an individual’s human leukocyte antigen (HLA) class I and II type and expression using standard next generation sequencing RNA-Seq data. RNA-Seq reads are mapped against a reference database of HLA alleles, and HLA type, confidence score and locus-specific expression level are determined. We successfully applied seq2HLA to 50 individuals included in the HapMap project, yielding 100% specificity and 94% sensitivity at aP-value of 0.1 for two-digit HLA types. We determined HLA type and expression for previously un-typed Illumina Body Map tissues and a cohort of Korean patients with lung cancer. Because the algorithm uses standard RNA-Seq reads and requires no change to laboratory protocols, it can be used for both existing datasets and future studies, thus adding a new dimension for HLA typing and biomarker studies.
Background
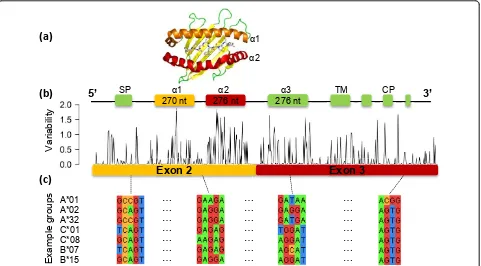
The major histocompatibility complex (MHC) molecules display peptide antigens that are derived from intracellular (class I) and extracellular (class II) proteins on the surface of vertebrate nucleated cells. The human MHC, called the human leukocyte antigen (HLA), is highly polymorphic and comprises three major gene loci for class I (A, B, C) (Figure 1) and three major gene loci for class II (DP, DQ, DR), which are expressed co-dominantly. Each cell expresses three maternal and three paternal HLA class I and three maternal and three paternal class II alpha and beta alleles. Determining the sequence of these molecules, HLA typing, is essential for clinical work (for example, organ transplantation), immune system research, and biomarker and drug development. Current HLA typing techniques use labor- and time-intensive methods, such as sequence-specific oligonucleotide probe (SSOP) hybridiza-tion [1], PCR amplificahybridiza-tion with sequence-specific primers [2], Sanger sequencing [3] and sero-typing [4].
Next generation sequencing (NGS) is a novel platform that enables rapid generation of billions of short nucleic acid sequence reads. Several studies described the use of NGS in high-throughput HLA genotyping using genomic DNA (for examples, see [5,6]). Recently, Lank et al. described a method using RNA for high-throughput
MHC class I genotyping [7,8], which was applied to assess genotype- and allele-specific expression of MHC class I in human and macaque leukocyte subsets [9]. This method involves the reverse transcription of RNA into cDNA, amplification using highly specific MHC I primers and subsequent bi-directional cDNA amplicon sequen-cing using Roche/454 GS FLX pyrosequensequen-cing, and is able to unambiguously resolve MHC alleles with high accuracy. However, all of these techniques use specialized NGS protocols including primer design to amplify only MHC class I alleles and amplicon sequencing with long reads (≥150 nucleotides) using Roche/454 GS FLX or Illumina GAIIx.
By contrast, gene expression profiling in patient samples using‘whole transcriptome’sequencing (RNA-Seq profil-ing) typically uses much shorter reads. The adoption of the RNA-Seq platform has been rapid: clinical and research laboratories worldwide have deposited over 14,600‘RNA-Seq’sample profiles into public repositories such as the National Center for Biotechnology Informa-tion Sequence Read Archive, including 4,304 human RNA-Seq samples as of 8 October 2012. As opposed to previous methods for determining gene expression, the RNA-Seq platform not only generates expression profiles but the data also contain nucleotide sequence information. Given the large number of RNA-Seq profiles in the public domain and our efforts to develop individualized T cell-mediated cancer vaccines, which require the knowledge of a patient HLA type and HLA expression to prioritize tar-get epitopes [10-12], we sought to develop an algorithm to
* Correspondence: [email protected]; [email protected] 1TRON - Translational Oncology at the University Medical Center of the Johannes Gutenberg University, Langenbeckstrasse 1, Building 708, 55131 Mainz, Germany
Full list of author information is available at the end of the article
utilize the sequence content of RNA-Seq reads to deter-mine both HLA type and expression.
To this end, we developed an in-silico method,
‘seq2HLA’, written in python and R, which takes standard RNA-Seq sequence reads in fastq format [13] as input, uses a bowtie index [14] comprising known HLA alleles, and outputs the most likely HLA class I and class II types, aP-value for each call, and the expression of each class. As a proof of concept, we applied the method to the recently released 37-nucleotide paired-end RNA-Seq data of 50 Utah residents with ancestry from northern and western Europe (CEU) [15] who are part of the HapMap project and have been previously typed using the PCR-SSOP method [16]. Our method, seq2HLA, achieves 100% specificity and 93.5% sensitivity at aP-value of 0.1. Sensi-tivity versus specificity curves show that the method works best using paired-end reads with length at least 37 nucleo-tides, that allowing one mismatch in the mapping is opti-mal, and that calls are more sensitive to read length than the number of reads.
Materials and methods Datasets
We used three publically available NGS RNA-Seq datasets. The first dataset comprises RNA-Seq reads from 60
lymphoblastoid cell lines derived from the CEU HapMap individuals of European descent, including 10 million 37-nucleotide paired-end reads per sample (Accession Num-ber [ERA002336]) [15]. The HLA genotypes of 270 HapMap individuals were previously determined by PCR-SSOP [16] and 51 overlap with the RNA-Seq samples. The Illumina Human Body Map 2.0 project (Accession Number [ERA022994]), the second dataset, comprises reads from 16 different tissues from 15 Caucasian- and one African-American donors, with over seven million 50-nucleotide paired-end reads per sample. The third dataset contains 77 lung RNA-Seq profiles from a lung cancer study in un-typed Korean patients and comprises 100 nucleotide paired-end reads per sample (Accession Number [ERP001058]) [17]. The datasets are provided for download in the European Nucleotide Archive at the European Bio-informatics Institute.
HLA reference sequences
We downloaded 1,635 HLA-A, 2,247 HLA-B and 1,248 C (October 2011) and 342 DQA, 1,976 HLA-DQB and 1,023 HLA-DRB (March 2012) nucleotide sequences from the international ImMunoGeneTics/HLA database at the European Bioinformatics Institute (ftp:// ftp.ebi.ac.uk/pub/databases/imgt/mhc/hla/). As exons 2 270 nt 276 nt 276 nt
5’
SP Į1 Į2 Į3 TM CP3’
A*01 A*02 A*32 C*01 C*08 B*07 B*15
… … … … … … …
Exon 2
Exon 3
… … … … … … …
… … … … … … …
Ex
am
pl
e groups
Variability
(a)
(b)
(c)
Į1
Į2
and 3 (class I) and exon 2 (class II) encode for the peptide-binding site and contain most of the polymorphisms (Figure 1), we extracted these sequences as reference sequences for alignments. In order to include reads map-ping to the exon boundaries of the sequence encoding for peptide binding and presentation, we added exon 1 (73 nucleotides long) and 75 nucleotides of exon 4 to the class I reference sequences and 75 nucleotides of exons 1 and 3 to the class II reference sequences.
Mapping of RNA-Seq reads
We mapped the RNA-Seq reads in fastq format [13] against the reference sequences using bowtie [14]. We optimized alignment parameters (below), including the number of allowed mismatches (-v) and the number of reported mappings (-m or -a).
Variation and grouping within HLA sequences
To quantify and evaluate the polymorphisms of HLA class I alleles, we computed the variability of sequences inter- and intra-allele groups (Figure S1 in Additional file 1). ‘HLA groups’were defined at the two-digit reso-lution (for example, A*01), consisting of all sequences starting with the same two digits. We computed the Hamming distance of each sequence (exons 2 and 3) with all other sequences, in terms of edit distance, and calculated the inter- and intra-group means.
Furthermore, we calculated the variability at each position across exons 2 and 3 using Shannon’s entropy and the nucleotide sequence alignments from all HLA class I alleles (Figure 1). We calculated the variability at each position in terms of information content using the binary logarithm formulation, taking into account the observed frequency of each base (A, T, C and G) across alleles. We plotted 2 - information content, such that 0 represents minimum variability (only one nucleotide observed) and 2 represents maximum variability (all four nucleotides equally likely).
Read length and HLA typing
To evaluate the trade-offs between read length ‘f’ and HLA typing, we computed the number of unique length oligonucleotides in each HLA sequence. For each locus, we created all possible f-mers of each HLA exon 2 and 3 sequence. These reads were aligned using bowtie to the respective reference sequences (class I or II) using the mapping parameter -m1 (report only unique map-pings). To account for the sequencing errors, the para-meter -v (allowed mismatches) was varied to allow for zero, one and two mismatches.
Data quality control
Of the previously typed CEU HapMap individuals, 51 overlapped with the 60 lymphoblastoid cell lines
sequenced by Montgomeryet al. [15]. After comparison of the HLA types determined by us and others with the established pedigrees for the CEU samples, we excluded sample 1382_1 from further analysis because of HLA inheritance inconsistencies. On examining the RNA-Seq seq2HLA calls, an individual (daughter NA12891) had an HLA type for which the HLA-A, -B and -C alleles matched the individual’s father (grandfather NA12891) but the remaining alleles did not match the individual’s mother (annotated as sample 1382_1, grandmother NA12892) (Figure S2 in Additional file 1). Further inves-tigation showed that seq2HLA-determined HLA types from the RNA-Seq reads were entirely different from the PCR-SSOP results, the only result in the 51 sample dataset with a complete discrepancy; the grandmother-annotated RNA-Seq reads showed expression of Y-chro-mosome genes, such as EIF1AY, a male-specific gene; and results of seq2HLA using RNA-Seq reads from the grandmother from a different experiment [18] matched the PCR-SSOP results and agreed with the pedigree. Thus, the available data strongly suggest that sample 1382_1 from Montgomery et al. is not the individual NA12892, and we removed this individual from our analysis, leaving 50 CEU HapMap individuals (in the fol-lowing named as Montgomery test samples). Further, given the uniqueness of an individual’s HLA type, this example demonstrates how seq2HLA can be used for sample annotation quality control, such as in ‘tumor versus normal’experiments where both samples should have the same HLA type.
Results and discussion
Creating the seq2HLA workflow
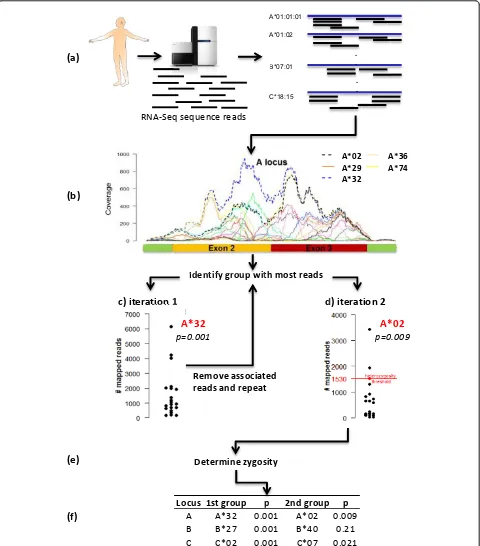
Seq2HLA works by identifying the HLA alleles asso-ciated with the greatest number of NGS RNA-Seq reads. The read-to-HLA mapping and counting is done in two stages (Figure 2). In the first stage, all reads from an RNA-Seq experiment in fastq format are mapped to the reference HLA sequences using bowtie_ENREF_4. For each locus, a ‘first round’winning group is chosen. Let
R1
L denote the set of allelic sequences with respective
read counts at locus L∈(A,B,C) in iteration 1. The top-scoring group for locus L is defined as the group that contains the allele with the highest number of mapped reads:
aR1
L= maxreads{al|al∈R 1
L} (1)
To determine the second group at each locus, the reads mapping to the first round winning group are removed, the remaining reads are mapped against the reference dataset and a‘second round’winning group is selected, again based on the number of mapped reads (Formula 1). At the end of each stage, a‘digital haplotype’is generated.
Assigning a confidence score
The algorithm assigns a confidence score to each HLA-type call reflecting the likelihood that the called group is correct versus noise. The calculation is based on the assumptions that the right combination of HLA groups will account for the largest number of reads and that the difference between the read count for the right allele combination and the read counts from all other combi-nations of alleles (the background) reflects the certainty of the HLA-type call.
Given a locus L∈(A,B,C), the distribution Ri L of
reads mapping to the groups of locus L in iterationi, and the reads mapping the top-scoring group aRi
L, let
p(aRi
L) denote the probability of observing a value that
is greater or equal to aRi
L from a normal distribution
described by the parameters mean(RiL) and sd(RiL):
paRi L
= 1−pnorm(aRi
L,mean
Ri L
,Ri
L) (2)
where pnormx,y,z calculates the cumulative distri-bution function of a normal distridistri-bution centered at y with standard deviation z and returns the probability of observing a value that is equal or larger than x given this distribution. The likelihood of aRi
L being a correct
HLA call - an outlier from the background - is a P-value poutlier(aRi
L) which is calculated according to:
poutlier
aRi L
=pbinom(0,x,p(aRi
L)) (3)
wherexis equal to the number of elements in Ri L and
pbinomq,size,p calculates the cumulative distribution
function of a binomial distribution with the parameters size (the number of trials) andP(probability of success).
For quantile q= 0, pbinom
q,x,p(aRi L)
returns the
probability of choosing at least one value that is larger than aRi
L in a Bernoulli experiment with xtrials. Thus,
poutlier is aP-value reflecting the certainty of the
HLA-type call.
Calculation of the confidence score is carried in both iterations of the algorithm in the same way, except for one difference. Whereas, in the first iteration, the num-ber of reads mapping the top-scoring group aR1
L is
removed from R1
L, this number aR2L is not removed
from R2
L, resulting in a stricter calculation of the
prob-abilities. The value aR2
L now impacts the mean and
stan-dard deviation of the distribution, which can result in
smaller poutlier
aR2
L
compared with the initial approach.
Homozygosity score
Within the second iteration, seq2HLA determines whether each locus is homozygous or heterozygous according to the allelic groups typed in the first iteration (Figure 2e). For each locus A, B and C, the median read count across the locus-associated HLA alleles after the first iteration is calculated, which acts as a decision threshold for zygosity. In seq2HLA, we implemented this by simply comparing the number of reads mapping to the second round winning group relative to the med-ian of the first iteration. If the number of reads mapping to the second round winning group was greater than this zygosity decision threshold, the locus was consid-ered heterozygous. If the number was smaller, the locus was called as homozygous. In case of a homozygous pre-diction, the associated P-value reflected the certainty of this locus being homozygous. The smaller the distance between the numbers of reads mapping to the top-scor-ing group and the median, the more likely this locus was not homozygous. This P-value was calculated according to Formula 3, with the modification that the median read count of the first iteration was added to the set of read counts R2
L to enable measuring the
dis-tance of the top-scoring group to this decision threshold.
$
$
%
. .
&
. .
Determine zygosity
(a)
RNA-Seq sequence reads
Locus 1st group p 2nd group p
A A*32 0.001 A*02 0.009 B B*27 0.001 B*40 0.21 C C*02 0.001 C*07 0.021
(e)
Identify group with most reads
(b)
c) iteration 1
Remove associated reads and repeat
d) iteration 2
eration 1
d) iteratio
mine zygosity Identify grou
(f)
oup p
ds
up wit up wit
A*32
p=0.001
A*02
p=0.009
%
A*02 A*29 A*32
A*36 A*74
optimal threshold was found to be medianL
2 for locus
L∈(DQA,DQB,DRB).
Expression
HLA expression was determined by the total number of unique sequence reads mapping to class I genes (A, B and C) or class II genes (DQA, DQB and DRB). Owing to the highly conserved nature of the HLA alleles, many reads mapped to multiple alleles and even multiple loci, and thus the assignment between an individual read and an individual allele or locus was frequently ambiguous. To provide an estimate of loci expression, the reads were proportionally assigned to the determined HLA loci based on the mappings between a read and the determined HLA groups (for example, if a read mapped to two different determined HLA loci, each group received a 0.5 count). They were then normalized according to reads per kilobase of exon model per mil-lion mapped reads (RPKM) [19] using the actual length of the sub-transcripts contained in the reference dataset: 694 nucleotides for class I and 400 nucleotides, 421 nucleotides and 421 nucleotides for class II (DQA, DQB and DRB respectively).
Code
Seq2HLA, available as stand-alone and Galaxy modules from http://tron-mainz.de/tron-facilities/computational-medicine/seq2HLA/, is written in python and R. Class I HLA typing using a sample of nine million sequences of 37-nucleotide paired-end reads takes 10 minutes using six central processing units on AMD Opteron 6174.
Evaluation on healthy individuals
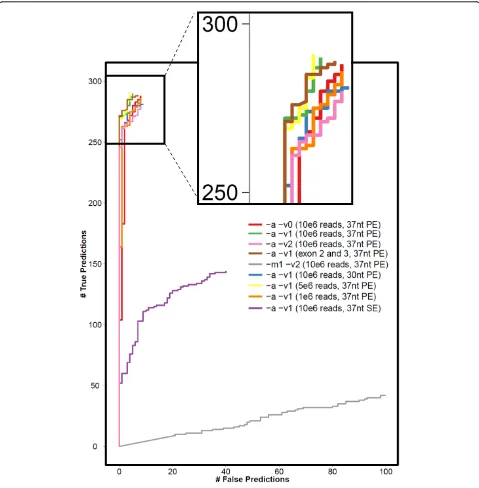
As a proof of concept, we applied the method to the recently released 37-nucleotide paired-end RNA-Seq data of 50 CEU HapMap individuals (Montgomery test samples) [15]. The 300 MHC class I alleles of these 50 individuals have been previously typed using the PCR-SSOP method [16]. Our method accurately called two-digit HLA types: seq2HLA achieves 100% specificity and 93.5% sensitivity at a P-value of 0.1 (Figure 3 and 3 Tables S2-5 in Additional file 2).
Out of the 300 alleles, there were five false calls (1.7%), but at P >0.1. Not surprisingly, the majority of false calls had high similarities to PCR-SSOP-deter-mined alleles. Individual NA12004 (sample ID 2963_6), for example, was predicted to express B*08 instead of the highly similar B*07, which differs by only 22 of 546 nucleotides (length of exon 2 and 3) (Figure S1c in Additional file 1). Another example was individual NA12006 (sample ID 2992_5), which was predicted to express C*07 instead of C*12, which differ by even fewer
nucleotides from each other (15 nucleotides, Figure 2d). Furthermore, one false call, individual NA11993 (sample ID 2005_6), had a missed homozygosity at the B locus, which was due to a high background (high number of ambiguous mapping), with the result that B*40 was assigned a read count higher than the decision thresh-old. Nevertheless, by assigning a P-value to each call that reflects this uncertainty, the user can effectively fil-ter uncertain calls.
Zygosity is challenging for HLA typing with RNA-Seq data: seq2HLA considers the relative number of reads associated with the first- and second-called alleles to determine zygosity. In the Montgomery test samples, 35 of the 150 Class I loci were homozygous: 33 were called correctly by seq2HLA, whereas two cases were falsely classified as heterozygous, with incorrect allele calls but with P-values >0.1. For four loci, seq2HLA could not confidently determine zygosity and, rather than make an incorrect HLA call, the loci were classified‘likely homo-zygous or single allele expressed.’ In all cases, the first allele was called correctly; in three cases the second allele was also correct but with too few reads to confi-dently call the locus heterozygosis and with a high P -value assigned, indicating that this locus might be het-erozygous with the proposed allele being the second allele.
The samples were also HLA-typed for the class II alleles HLA-DQA, HLA-DQB and HLA-DRB. In the HLA calls by de Bakker et al., 24 of the 300 alleles could not be resolved and thus cannot be evaluated here. Examining seq2HLA class II calls, 264 of 276 are correct (95.7%) and 10 (3.6%) are incorrect, and for two alleles seq2HLA could not make a confident call (Addi-tional file 2, Tables S6-7). 32 of 37 homozygous loci are correctly called. The P-values of the class II alleles are less significant overall, particularly in the second itera-tion, in part due to less sequence variability between alleles of each locus as the variability is primarily encoded only in exon 2 across both alpha and beta loci.
Comparing different mapping and technical parameters We used sensitivity versus specificity curves to evaluate the impact on performance of read length, number of reads, paired-end versus single-end and bowtie alignment parameters, such as the number of allowed mismatches, by applying seq2HLA to the Montgomery test samples.
Table S2 in Additional file 2 and Figure 3 depict the accuracy using different mapping parameters with respect to allowed mismatches (bowtie options -v0, -v1 and -v2) and reported alignments (bowtie options -m1 -a) for class I. Allowing only unique mappings (-m1) resulted in very poor accuracy with only 51% and 38%
Figure 3Sensitivity versus specificity for different mapping and technical parameters applied to the 50 Montgomery test samples. Bowtie mapping parameters include -a (report all mappings), -m1 (report only unique mappings), -v<0|1|2> (allow zero, one or two
correct predictions for zero or two mismatches. Further-more, it was not possible with these settings to distin-guish between homo- and heterozygosity as too many informative reads were lost during the mapping step. The sequencing error rate was 1% to 2%, and thus the optimal number of allowed mismatches for reads with length 37 nucleotides was one (bowtie options -a -v1). As can be seen in Table S2 in Additional file 2, allowing zero or two mismatches (bowtie options -a -v2) resulted in an increase in false predictions.
We further assessed technical parameters, including number of reads, read length and paired-end versus sin-gle-end. Figure 3 and Table S4 in Additional file 2 depict the sensitivity versus specificity curves for the dif-ferent parameters. Decreasing read length from 37 nucleotides to 30 nucleotides rapidly impacted perfor-mance, from 93.5% to 89.4% sensitivity at 100% specifi-city. Decreasing the number of reads had a smaller impact: one million reads per sample in these lympho-cyte-derived cell lines still generated HLA calls with 91.6% specificity. The most dramatic performance drop was observed when using single-end reads instead of paired-end, with specificity decreasing from 93.5% sensi-tivity and 100% specificity to 26.2% sensisensi-tivity and 90.5% specificity with the same number of reads. Using only exons 2 and 3 as reference dataset instead of using exons 1, 2, 3 and 75 nucleotides of exon 4 resulted in two more wrong predictions (seven instead of five). In summary, the method works best using paired-end reads with a length at least 37 nucleotides and allowing one mismatch in the mapping, and that calls are more sensitive to read length than the number of reads.
Further applications
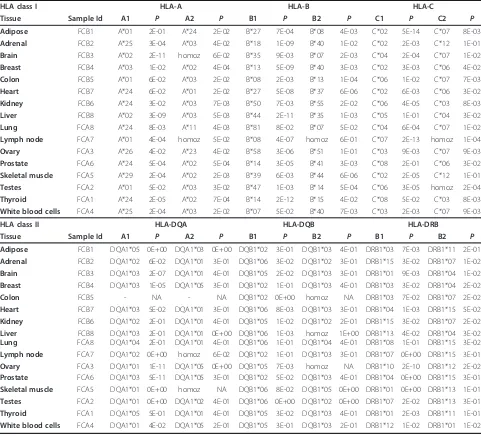
An advantage of seq2HLA is that it can be applied to existing RNA-Seq datasets. We applied seq2HLA to RNA-Seq datasets from the 16 individuals sequenced in the Illumina Human Body Map 2.0 project and nine additional individuals from the CEU HapMap RNA-Seq dataset. None of these individuals had previously been HLA-typed. We report the derived class I and class II HLA types of the nine CEU HapMap individuals in Table S8 in Additional file 2, and of the 16 Illumina Body Map samples in Table 1.
An RNA-Seq body map dataset consisting of 32 nucleo-tide single-end reads [20] was previously submitted to the National Center for Biotechnology’s Gee Expression Omnibus repository by Wanget al. [GEO:GSE12946]. As several of the same tissues are found in both datasets, we internally used them as biological replicates. We applied seq2HLA to nine common tissues samples and found that the HLA types from corresponding tissues, except brain, matched. Thus, eight RNA-Seq profiles from the Wang et al. dataset are likely derived from the same samples
used in the Illumina Human Body Map 2.0 project and, except brain, should not be used as biological replicates but rather technical replicates.
Seq2HLA does not rely on a priori knowledge of population-specific HLA distributions. To demonstrate the applicability of the method to different ethnic groups, we applied seq2HLA to 77 lung RNA-Seq pro-files from a lung cancer study in un-typed Korean patients [17]. The HLA calls for each sample are listed in Table S9 in Additional file 2. We compared the dis-tribution of the determined HLA class I alleles from 59 CEU HapMap individuals with European ethnicity (50 Montgomery test samples and the nine previously un-typed CEU HapMap samples), 15 Illumina Body Map samples (those with European ethnicity) and the Korean patients with lung cancer (Table 1 and Tables S3 and S9 in Additional file 2) to established allele frequencies. Encouragingly, we found that the alleles in the 74 CEU HapMap and Illumina Body Map Samples (seq2HLA samples [europ. descent]) are those HLA alleles more frequently found in European populations [21,22] and not frequently found in Korean individuals [21,23,24], such as A*01, A*03, B*08 or C*07 (Figure S3 in Addi-tional file 1). Further, the distribution of alleles found in the Korean patients (Table S9 in Additional file 2) matched the established distribution of alleles in the Korean population; we again found a high correlation between the HLA class I distribution of our predictions and studies assessing HLA class I distribution in the South Korean population (Figure S3 in Additional file 1), including more frequent A*33, B*54 and C*01.
slightly higher than C (Figure S4 in Additional file 1). Class II DRB was expressed at higher levels than DQA and DQB, which were expressed at similar levels. In tis-sues (Figure S5 in Additional file 1), class I A, B and C were expressed at comparable levels whereas class II DRB was expressed at higher levels than DQA and DQB.
Conclusions
The main task of the immune system is to protect the body against pathogenic influences from the outside, such as bacteria or viruses, and from the inside, such as tumor-genesis. HLAs play a central role in this task as they present peptides to the immune cells, which are derived either from normal self-proteins in a healthy
condition, from pathogens in case of an infection or from abnormal self-proteins.
To determine the HLA type of an individual, com-mon laboratory techniques use either genomic DNA in combination with PCR or proteins and HLA-targeting antibodies. Recent studies employing NGS describe specialized laboratory protocols for high-throughput HLA typing, targeting genomic DNA (for example, see [5,6]) and cDNA [7] from the class I HLA loci. Although these new NGS laboratory protocols and existing clinical testing are critical for clinical applica-tions, such as organ transplantation, an algorithm for use with standard RNA-Seq sequence reads would enable HLA typing of thousands of existing and future Table 1 HLA genotypes of Illumina Human Body Map individuals determined by seq2HLA .
HLA class I HLA-A HLA-B HLA-C
Tissue Sample Id A1 P A2 P B1 P B2 P C1 P C2 P Adipose FCB1 A*01 2E-01 A*24 2E-02 B*27 7E-04 B*08 4E-03 C*02 5E-14 C*07 8E-03
Adrenal FCB2 A*25 3E-04 A*03 4E-02 B*18 1E-09 B*40 1E-02 C*02 2E-03 C*12 1E-01
Brain FCB3 A*02 2E-11 homoz 6E-02 B*35 9E-03 B*07 2E-03 C*04 2E-04 C*07 1E-02
Breast FCB4 A*03 1E-02 A*02 4E-04 B*13 5E-09 B*40 3E-03 C*02 3E-03 C*06 4E-02
Colon FCB5 A*01 6E-02 A*03 2E-02 B*08 2E-03 B*13 1E-04 C*06 1E-02 C*07 7E-03
Heart FCB7 A*24 6E-02 A*01 2E-02 B*27 5E-08 B*37 6E-06 C*02 6E-03 C*06 3E-02
Kidney FCB6 A*24 3E-02 A*03 7E-03 B*50 7E-03 B*55 2E-02 C*06 4E-05 C*03 8E-03
Liver FCB8 A*02 3E-09 A*03 5E-03 B*44 2E-11 B*35 1E-03 C*05 1E-01 C*04 3E-02
Lung FCA8 A*24 8E-03 A*11 4E-03 B*81 8E-02 B*07 5E-02 C*04 6E-04 C*07 1E-02
Lymph node FCA7 A*01 4E-04 homoz 5E-02 B*08 4E-07 homoz 6E-01 C*07 2E-13 homoz 1E-04
Ovary FCA3 A*26 4E-02 A*23 4E-02 B*58 3E-06 B*51 1E-01 C*03 9E-03 C*07 9E-03
Prostate FCA6 A*24 5E-04 A*02 5E-04 B*14 3E-05 B*41 3E-03 C*08 2E-01 C*06 3E-02
Skeletal muscle FCA5 A*29 2E-04 A*02 2E-03 B*39 6E-03 B*44 6E-06 C*02 2E-05 C*12 1E-01
Testes FCA2 A*01 5E-02 A*03 3E-02 B*47 1E-03 B*14 5E-04 C*06 3E-05 homoz 2E-04
Thyroid FCA1 A*24 2E-05 A*02 7E-04 B*14 2E-12 B*15 4E-02 C*08 5E-02 C*03 8E-03
White blood cells FCA4 A*25 2E-04 A*03 2E-02 B*07 5E-02 B*40 7E-03 C*03 2E-03 C*07 9E-03
HLA class II HLA-DQA HLA-DQB HLA-DRB
Tissue Sample Id A1 P A2 P B1 P B2 P B1 P B2 P Adipose FCB1 DQA1*05 0E+00 DQA1*03 0E+00 DQB1*02 3E-01 DQB1*03 4E-01 DRB1*03 7E-03 DRB1*11 2E-01
Adrenal FCB2 DQA1*02 6E-02 DQA1*01 3E-01 DQB1*06 3E-02 DQB1*02 3E-01 DRB1*15 3E-02 DRB1*07 1E-02
Brain FCB3 DQA1*03 2E-07 DQA1*01 4E-01 DQB1*05 2E-02 DQB1*03 3E-01 DRB1*01 9E-03 DRB1*04 1E-02
Breast FCB4 DQA1*03 1E-05 DQA1*05 3E-01 DQB1*02 1E-01 DQB1*03 4E-01 DRB1*03 3E-02 DRB1*04 2E-02
Colon FCB5 - NA - NA DQB1*02 0E+00 homoz NA DRB1*03 7E-02 DRB1*07 2E-02
Heart FCB7 DQA1*03 5E-02 DQA1*01 3E-01 DQB1*06 8E-03 DQB1*03 3E-01 DRB1*04 1E-03 DRB1*15 5E-02
Kidney FCB6 DQA1*02 2E-01 DQA1*01 4E-01 DQB1*05 1E-02 DQB1*02 2E-01 DRB1*15 3E-02 DRB1*07 2E-02
Liver Lung
FCB8 FCA8
DQA1*03 DQA1*04
2E-01 2E-01
DQA1*01 DQA1*01
0E+00 4E-01
DQB1*06 DQB1*06
1E-03 1E-01
homoz DQB1*04
1E+00 4E-01
DRB1*13 DRB1*08
4E-02 1E-01
DRB1*04 DRB1*15
3E-02 3E-02
Lymph node FCA7 DQA1*02 0E+00 homoz 6E-02 DQB1*02 1E-01 DQB1*03 3E-01 DRB1*07 0E+00 DRB1*15 3E-01
Ovary FCA3 DQA1*01 1E-11 DQA1*05 0E+00 DQB1*05 7E-03 homoz NA DRB1*10 2E-10 DRB1*12 2E-02
Prostate FCA6 DQA1*03 5E-11 DQA1*05 3E-01 DQB1*02 5E-02 DQB1*03 4E-01 DRB1*04 0E+00 DRB1*15 3E-01
Skeletal muscle FCA5 DQA1*01 0E+00 homoz NA DQB1*06 8E-02 DQB1*05 0E+00 DRB1*01 0E+00 DRB1*13 1E-01
Testes FCA2 DQA1*01 0E+00 DQA1*02 4E-01 DQB1*06 0E+00 DQB1*02 0E+00 DRB1*07 2E-02 DRB1*13 3E-01
Thyroid FCA1 DQA1*05 5E-01 DQA1*01 4E-01 DQB1*05 3E-02 DQB1*03 4E-01 DRB1*01 2E-03 DRB1*11 1E-01
samples. Further, none of the existing algorithms determines HLA expression.
The NGS RNA-Seq protocol has been rapidly adopted worldwide to profile gene expression. Here, we show that the sequence reads derived from deep sequencing the transcriptome using standard NGS RNA-Seq can be further used to determine the HLA type and expression. We developed a novel method, seq2HLA, that takes the RNA-Seq read files in fastq format as input and deter-mines the HLA class I and II types and expression. By providing a confidence score to each HLA type, which reflects the likelihood that the called group is correct versus noise, the user can effectively filter results by P-value for their specific application. We overcame major challenges when mapping mRNA reads for HLA typing: the HLA genes are not only highly polymorphic but also have thousands of known alleles, many individuals are homozygous at a locus, and most RNA-Seq reads are less than 100 nucleotides long. The seq2HLA achieved 100% specificity and 93.5% sensitivity for two-digit class I
prediction on the control samples (Montgomery test sam-ples) and took 10 minutes per sample to run. Applied to RNA-Seq replicates from the same individual, seq2HLA is reproducible, generating identical HLA types. The Illu-mina Body Map and the Korean lung samples are further demonstrations of the algorithm, showing that the algo-rithm works in a diverse set of samples.
HLA typing has obvious application to immunological-related processes, from basic research to cohort disease studies to clinical studies. For example, having the HLA type allows the selection of cell lines for use in immunolo-gical assays (for example, if we need a non A*02 cell line). A different application is as an inherent sample identifier, enabling determination of incorrect sample annotation. Mislabeled and‘sans papiers’cell lines are not uncommon [33]. Using the HLA type, seq2HLA provides a sample annotation quality control, both for previously un-typed cell lines and for matching cell lines with previously deter-mined HLA types [34]. Further, cancer studies typically compare the transcriptomes of tumor and normal samples
0 500 1000 1500 2000
White Blood Cells Thyroid Testes Skeletal Muscle Prostate Ovary Lymph node Lung Liver Kidney Heart Colon Breast Brain Adrenal Adipose
RPKM
HLA Class I
HLA Class II
2 from the same individual. Using RNA-Seq data, seq2HLA
provides a fast and easy quality control to validate annota-tion (both tumor and normal should have the same HLA type).
In addition, we find that many non-immunological-aware researchers are currently accumulating large geno-mic and transcriptogeno-mic datasets using NGS, such as with disease population and clinical trial cohorts to find bio-markers (for example, risk factors and response bio-markers). We expect that including HLA types into the analysis will enable the identification of novel HLA disease and response associations. Furthermore, previous RNA-Seq studies do not accurately determine HLA expression as they, during read alignment, do not take into account the polymorphism of the HLA loci. By contrast, seq2HLA not only accurately calls the HLA type of an individual, but also outputs an RPKM HLA expression profile. This is critical for monitoring malignant and therapeutic pro-cesses that modify HLA expression.
We foresee extensive synergies and improvements (espe-cially with four-digit-resolution typing) resulting from feedback between seq2HLA and increased NGS read length, increased NGS read accuracy, larger datasets and increased reference HLA sequence databases, especially with more identified and recorded sequence information outside of exons 2 and 3 (class I) and exon 2 (class II).
In summary, we provide a tool that uses standard RNA-Seq reads, requires no change to laboratory proto-cols, and can be used both for existing and future data-sets to determine HLA type and expression.
Additional material
Additional file 1: Additional figures. Figure S1: Mean edit distances of all reference sequences (exon 2 and 3 = 546 nucleotides) within and between the groups of alleles to quantify and visualize HLA polymorphisms. Figure S2: Pedigree and HLA types of CEU individuals NA12892, NA12891 and NA12878. Figure S3: Comparison of the distribution of predicted HLA types of this study with population-specific HLA distributions. Figure S4: Average locus-specific expression of HLA class I and II in the 50 Montgomery test samples using seq2HLA. Figure S5: Locus-specific expression of HLA class I and II in the 16 Illumina Human Body Map samples.
Additional file 2: Additional tables. Table S1: Number of alleles containing at least one f-mer, which is unique for this nucleotide sequence when compared with all alleles within a locus. Table S2: Accuracy of seq2HLA in determining the HLA class I type of the 50 Montgomery test samples using different mapping parameters. Table S3: HLA class I types of the 50 Montgomery test samples. Table S4: Sensitivity versus specificity of different mapping and technical parameters. Table S5: Number of true predictions, false predictions and missed alleles per allelic group. Table S6: Accuracy of seq2HLA in determining the HLA class II type of the 50 Montgomery test samples using the optimal mapping parameter. Table S7: HLA class II types of the 50 Montgomery test samples. Table S8: HLA class I (A) and class II (B) types of nine previously un-typed CEU HapMap individuals. Table S9: Predicted HLA class I types of 77 normal lung derived from Korean individuals.
Abbreviations
CEU: Utah residents with ancestry from northern and western Europe; HLA: human leukocyte antigen; MHC: major histocompatibility complex; NGS: next generation sequencing; RPKM: reads per kilobase of exon model per million mapped reads; SSO: sequence-specific oligonucleotide
Authors’contributions
SB, ML, JCC and US participated in algorithm development, study design and helped draft the manuscript. SB wrote the manuscript, developed the code and performed the analysis. JCC co-wrote the manuscript and supervised and co-developed the algorithms. JG and VB sequenced samples used to develop the algorithm, MS performed HLA genotyping, TB processed NGS sequence reads and sex-specific gene expression analysis, ÖT provided guidance and scientific feedback, and MD had the initial idea. All authors read and approved the final manuscript for publication.
Competing interests
The authors declare that they have no competing interests.
Acknowledgements
Pre-release NGS RNA-Seq data was kindly provided by Gary Schroth (Illumina). Alexandra G Orlandini von Niessen helped draft figures. Jelle Scholtalbers and Patrick Sorn integrated seq2HLA into the Galaxy framework.
Author details
1TRON - Translational Oncology at the University Medical Center of the Johannes Gutenberg University, Langenbeckstrasse 1, Building 708, 55131 Mainz, Germany.2University Medical Center of the Johannes Gutenberg University Mainz, III, Medical Department, Langenbeckstrasse 1, 55131 Mainz, Germany.3Ganymed Pharmaceuticals AG, Freiligrathstrasse 12, 55131 Mainz, Germany.
Received: 1 August 2012 Revised: 17 December 2012
References
1. Cao K, Chopek M, Fernandez-Vina MA:High and intermediate resolution DNA typing systems for class I HLA-A, B, C genes by hybridization with sequence-specific oligonucleotide probes (SSOP).Rev Immunogenet1999,
1:177-208.
2. Olerup O, Zetterquist H:HLA-DR typing by PCR amplification with sequence-specific primers (PCR-SSP) in 2 hours: an alternative to serological DR typing in clinical practice including donor-recipient matching in cadaveric transplantation.Tissue Antigens1992,
39:225-235.
3. Santamaria P, Boyce-Jacino MT, Lindstrom AL, Barbosa JJ, Faras AJ, Rich SS:
HLA class II‘typing’: direct sequencing of DRB, DQB, and DQA genes.
Hum Immunol1992,33:69-81.
4. Terasaki PI, McClelland JD:Microdroplet assay of human serum cytotoxins.Nature1964,204:998-1000.
5. Erlich RL, Jia X, Anderson S, Banks E, Gao X, Carrington M, Gupta N, DePristo MA, Henn MR, Lennon NJ, de Bakker PI:Next-generation sequencing for HLA typing of class I loci.BMC Genomics2011,12:42. 6. Wang C, Krishnakumar S, Wilhelmy J, Babrzadeh F, Stepanyan L, Su LF,
Levinson D, Fernandez-Vina MA, Davis RW, Davis MM, Mindrinos M: High-throughput, high-fidelity HLA genotyping with deep sequencing.Proc
Natl Acad Sci USA2012,109:8676-8681.
7. Lank SM, Wiseman RW, Dudley DM, O’Connor DH:A novel single cDNA amplicon pyrosequencing method for high-throughput, cost-effective sequence-based HLA class I genotyping.Hum Immunol2010,
71:1011-1017.
8. Lank SM, Golbach BA, Creager HM, Wiseman RW, Keskin DB, Reinherz EL, Brusic V, O’Connor DH:Ultra-high resolution HLA genotyping and allele discovery by highly multiplexed cDNA amplicon pyrosequencing.BMC
Genomics2012,13:378.
9. Greene JM, Wiseman RW, Lank SM, Bimber BN, Karl JA, Burwitz BJ, Lhost JJ, Hawkins OE, Kunstman KJ, Broman KW, Wolinsky SM, Hildebrand WH, O’Connor DH:Differential MHC class I expression in distinct leukocyte subsets.BMC Immunol2011,12:39.
10. Castle JC, Kreiter S, Diekmann J, Löwer M, van de Roemer N, de GJ, Selmi A, Diken M, Boegel S, Paret C, Koslowski M, Kuhn AN, Britten CM, Huber C, Türeci O, Sahin U:Exploiting the mutanome for tumor vaccination.
Cancer Res2012,72:1081-1091.
11. Kreiter S, Diken M, Selmi A, Türeci O, Sahin U:Tumor vaccination using messenger RNA: prospects of a future therapy.Curr Opin Immunol2011,
23:399-406.
12. Löwer M, Renard BY, de Graaf J, Wagner M, Paret C, Kneip C, Türeci O, Diken M, Britten C, Kreiter S, Koslowski M, Castle JC, Sahin U: Confidence-based somatic mutation evaluation and prioritization.PLoS Comput Biol
2012,8:e1002714.
13. Cock PJ, Fields CJ, Goto N, Heuer ML, Rice PM:The Sanger FASTQ file format for sequences with quality scores, and the Solexa/Illumina FASTQ variants.Nucleic Acids Res2010,38:1767-1771.
14. Langmead B, Trapnell C, Pop M, Salzberg SL:Ultrafast and memory-efficient alignment of short DNA sequences to the human genome.
Genome Biol2009,10:R25.
15. Montgomery SB, Sammeth M, Gutierrez-Arcelus M, Lach RP, Ingle C, Nisbett J, Guigo R, Dermitzakis ET:Transcriptome genetics using second generation sequencing in a Caucasian population.Nature2010,
464:773-777.
16. de Bakker PI, McVean G, Sabeti PC, Miretti MM, Green T, Marchini J, Ke X, Monsuur AJ, Whittaker P, Delgado M, Morrison J, Richardson A, Walsh EC, Gao X, Galver L, Hart J, Hafler DA, Pericak-Vance M, Todd JA, Daly MJ, Trowsdale J, Wijmenga C, Vyse TJ, Beck S, Murray SS, Carrington M, Gregory S, Deloukas P, Rioux JD:A high-resolution HLA and SNP haplotype map for disease association studies in the extended human
MHC.Nat Genet2006,38:1166-1172.
17. Seo JS, Ju YS, Lee WC, Shin JY, Lee JK, Bleazard T, Lee J, Jung YJ, Kim JO, Shin JY, Yu SB, Kim J, Lee ER, Kang CH, Park IK, Rhee H, Lee SH, Kim JI, Kang JH, Kim YT:The transcriptional landscape and mutational profile of lung adenocarcinoma.Genome Res2012,22(11):2109-2119.
18. A user’s guide to the encyclopedia of DNA elements (ENCODE). PLoS Biol2011,9:e1001046.
19. Mortazavi A, Williams BA, McCue K, Schaeffer L, Wold B:Mapping and quantifying mammalian transcriptomes by RNA-Seq.Nat Methods2008,
5:621-628.
20. Wang ET, Sandberg R, Luo S, Khrebtukova I, Zhang L, Mayr C, Kingsmore SF, Schroth GP, Burge CB:Alternative isoform regulation in human tissue transcriptomes.Nature2008,456:470-476.
21. Gonzalez-Galarza FF, Christmas S, Middleton D, Jones AR:Allele frequency net: a database and online repository for immune gene frequencies in worldwide populations.Nucleic Acids Res2011,39:D913-D919. 22. Schmidt AH, Baier D, Solloch UV, Stahr A, Cereb N, Wassmuth R,
Ehninger G, Rutt C:Estimation of high-resolution HLA-A, -B, -C, -DRB1 allele and haplotype frequencies based on 8862 German stem cell donors and implications for strategic donor registry planning.Hum
Immunol2009,70:895-902.
23. Lee KW, Oh DH, Lee C, Yang SY:Allelic and haplotypic diversity of HLA-A, -B, -C, -DRB1, and -DQB1 genes in the Korean population.Tissue Antigens
2005,65:437-447.
24. Yoon JH, Shin S, Park MH, Song EY, Roh EY:HLA-A, -B, -DRB1 allele frequencies and haplotypic association from DNA typing data of 7096 Korean cord blood units.Tissue Antigens2010,75:170-173.
25. Wiendl H, Feger U, Mittelbronn M, Jack C, Schreiner B, Stadelmann C, Antel J, Brueck W, Meyermann R, Bar-Or A, Kieseier BC, Weller M:
Expression of the immune-tolerogenic major histocompatibility molecule HLA-G in multiple sclerosis: implications for CNS immunity.
Brain2005,128:2689-2704.
26. Pavlath GK:Regulation of class I MHC expression in skeletal muscle: deleterious effect of aberrant expression on myogenesis.J Neuroimmunol
2002,125:42-50.
27. Male DK, Pryce G, Hughes CC:Antigen presentation in brain: MHC induction on brain endothelium and astrocytes compared.Immunology
1987,60:453-459.
28. Daar AS, Fuggle SV, Fabre JW, Ting A, Morris PJ:The detailed distribution of HLA-A, B, C antigens in normal human organs.Transplantation1984,
38:287-292.
29. Fleming KA, McMichael A, Morton JA, Woods J, McGee JO:Distribution of HLA class 1 antigens in normal human tissue and in mammary cancer.J
Clin Pathol1981,34:779-784.
30. Holling TM, Schooten E, van Den Elsen PJ:Function and regulation of MHC class II molecules in T-lymphocytes: of mice and men.Hum
Immunol2004,65:282-290.
31. Cunningham AC, Zhang JG, Moy JV, Ali S, Kirby JA:A comparison of the antigen-presenting capabilities of class II MHC-expressing human lung epithelial and endothelial cells.Immunology1997,91:458-463. 32. Rohn WM, Lee YJ, Benveniste EN:Regulation of class II MHC expression.
Crit Rev Immunol1996,16:311-330.
33. Giacomini P, Giorda E, Pera C, Ferrara GB:An ID card for tumour cell lines: HLA typing can help.Lancet Oncol2001,2:658.
34. Adams S, Robbins FM, Chen D, Wagage D, Holbeck SL, Morse HC, Stroncek D, Marincola FM:HLA class I and II genotype of the NCI-60 cell lines.J Transl Med2005,3:11.
doi:
Cite this article as:Boegelet al.:HLA typing from RNA-Seq sequence reads.Genome Medicine20124:102.
Submit your next manuscript to BioMed Central and take full advantage of:
• Convenient online submission
• Thorough peer review
• No space constraints or color figure charges
• Immediate publication on acceptance
• Inclusion in PubMed, CAS, Scopus and Google Scholar
• Research which is freely available for redistribution
![Figure 4 Summed expression of MHC class I and class II in normal tissues in RPKM units [19]](https://thumb-us.123doks.com/thumbv2/123dok_us/251374.1518221/10.595.62.539.87.437/figure-summed-expression-class-class-normal-tissues-rpkm.webp)
