O ncogenomics data and their dimensions
Cancer genomics benefi ts from highthroughput techno lo gies that allow the comparison of the genomic sequen ces, epigenomic profi les, and transcriptomes of tumor cells with those of normal cells. Th ese technologies often characterize diff erent types of somatic alterations (or variations) in a tumor cell population that are absent from normal cells including copy number alterations (CNAs), mutations, gene expression changes and methy la tion changes [14]. Together, these somatic altera tions constitute multidimensional oncogenomics datasets that
descri be the variations that coexist in common elements (for example, the genes) of the genome (or transcriptome) of a particular cohort of tumor cells. Such data are currently being used to identify cancerdriver genes and pathways, to discover molecular targets for new thera pies, and to defi ne molecular profi les that charac terize clinically meaningful patient categories. An array of analytical methods are currently used to exploit the information contained within this multidimensional layout [512].
Along with computational and statistical methodolo gies, eff ective visual exploration by experts is crucial to successful extraction of knowledge from oncogenomics data. For example, this step might be key to unraveling rare genomic events, verifying data quality at maximum resolution or identifying key players in cancer develop ment. Th us, researchers need intuitive tools that allow the visual integration and simultaneous exploration of both diff erent types of alterations and clinical informa tion. Many data visualization tools have been developed in recent years to support genomic studies. In this review, we revisit the most common ways in which these data are visualized, and present s elected tools that allow researchers to visualize multidimensional oncogenomics datasets eff ectively (Table 1).
To aid our review of the tools, we describe four case studies that illustrate their use: the visual exploration of 1) alterations in cancerdriver genes per tumor through a representation based on OncoPrint (described below); 2) causeeff ect relationships between diff erent alteration types in tumor samples, through the use of Gitools and the Network viewer from the cBio Cancer Genomics Portal; 3) the stratifi cation of tumor samples based on clinical annotations, using CircleMap, the Integrative Genomics Viewer (IGV) and Gitools; and 4) dramatic structural alterations that encompass the rearrangement of large chromosomal regions, employing the Circos tool and data obtained from the Catalogue of Somatic Muta tions in Cancer (Cosmic).
Types of genomic data visualization
Numerous methods have been developed to automate the analysis of genomic data [1315]. Nonetheless, the visual exploration of alterations in cancer genomes, epi g enomes and transcriptomes in multidimensional datasets, and of
Abstract
Cancer genomics projects employ high-throughput technologies to identify the complete catalog of somatic alterations that characterize the genome, transcriptome and epigenome of cohorts of tumor samples. Examples include projects carried out by the International Cancer Genome Consortium (ICGC) and The Cancer Genome Atlas (TCGA). A crucial step in the extraction of knowledge from the data is the exploration by experts of the diff erent alterations, as well as the multiple relationships between them. To that end, the use of intuitive visualization tools that can integrate diff erent types of alterations with clinical data is essential to the fi eld of cancer genomics. Here, we review eff ective and common visualization techniques for exploring oncogenomics data and discuss a selection of tools that allow researchers to eff ectively visualize multidimensional oncogenomics datasets. The review covers visualization methods employed by tools such as Circos, Gitools, the Integrative Genomics Viewer, Cytoscape, Savant Genome Browser, StratomeX and platforms such as cBio Cancer Genomics Portal, IntOGen, the UCSC Cancer Genomics Browser, the Regulome Explorer and the Cancer Genome Workbench.
© 2010 BioMed Central Ltd
Visualizing multidimensional cancer genomics data
Michael P Schroeder
1, Abel Gonzalez-Perez
1and Nuria Lopez-Bigas*
1,2RE VIE W
*Correspondence: [email protected]
1Research Program on Biomedical Informatics - GRIB, Universitat Pompeu Fabra
(UPF), Parc de Recerca Biomèdica de Barcelona (PRBB), Dr. Aiguader 88, E-08003 Barcelona, Spain
Full list of author information is available at the end of the article
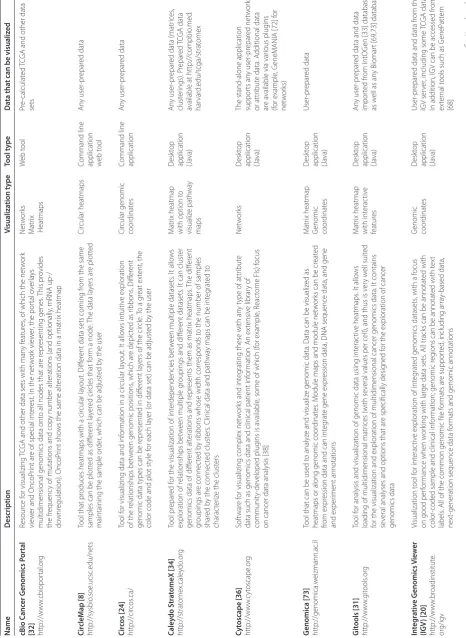
Table 1.
To
ols and r
esour
ces f
or visualizing multidimensional c
anc
er genomics da
ta Name Description Visualiza tion t ype Tool t ype Da ta tha
t can be visualiz
ed cBio C anc er G enomics P or tal [32] http://w w w .cbiopor tal .or g Resour ce f or visualizing TC
GA and other data sets with man
y f
eatur
es
, of which the net
w
or
k
vie
w
er and OncoP
rint ar
e of special int
er
est. I
n the net
w
or
k vie
w
er
, the por
tal o
ver
la
ys
multidimensional genomics data ont
o all nodes that ar
e r epr esenting genes . T his pr ovides the fr equenc
y of mutations and cop
y number alt
erations (and optionally
, mRNA up
-/
do
wnr
egulation). OncoP
rint sho
ws the same alt
eration data in a matr
ix heatmap Net w or ks M atr ix Heatmaps W eb t ool Pr e-calculat ed TC
GA and other data
sets Cir cleM ap [8] http://sysbio .soe .ucsc .edu/nets
Tool that pr
oduces heatmaps with a cir
cular la
yout. Diff
er
ent data sets coming fr
om the same
samples can be plott
ed as diff
er
ent la
yer
ed cir
cles that f
or
m a node
. T
he data la
yers ar
e plott
ed
maintaining the sample or
der
, which can be adjust
ed b
y the user
Cir
cular heatmaps
Command line application web t
ool An y user -pr epar ed data Cir cos [24] http://cir cos .ca/ Tool f
or visualizing data and inf
or
mation in a cir
cular la
yout. I
t allo
ws intuitiv
e exploration
of the r
elationships bet
w
een genomic positions
, which ar
e depic
ted as r
ibbons
. Diff
er
ent
genomic data t
ypes can be r
epr
esent
ed in diff
er
ent la
yers of the cir
cle
. T
o a g
reat ex
tent, the
color code and plot st
yle f
or each la
yer (
or data set) can be adjust
ed b
y the user
Cir
cular genomic
coor
dinat
es
Command line application
An y user -pr epar ed data Cale ydo S tr at omeX [34] http://strat omex.cale ydo .or g Tool pr epar ed f
or the visualization of int
er
dependencies bet
w
een multiple datasets
. I
t allo
ws
exploration of r
elationships bet
w
een multiple g
roupings and diff
er
ent datasets
. I
t can clust
er
genomics data of diff
er
ent alt
erations and r
epr
esents them as matr
ix heatmaps . T he diff er ent gr oupings ar e connec ted b y r
ibbons whose width cor
responds t
o the number of samples
shar
ed b
y the connec
ted clust
ers
. Clinical data and path
wa
y maps can be int
eg rat ed t o charac ter
ize the clust
ers
M
atr
ix heatmap
with option t
o visualiz e path wa y maps D eskt op
application (Java)
An
y user
-pr
epar
ed data (matr
ices , clust er ings). P repar ed TC GA data
available at http://compbio
.med . har var d.edu/t cga/strat omex Cyt oscape [36] http://w w w .c yt oscape .or g Sof twar e f
or visualizing complex net
w
or
ks and int
eg
rating these with an
y t
ype of attr
ibut
e
data such as genomics data and clinical patient inf
or
mation. An ex
tensiv e librar y of communit y-de veloped plug
ins is a
vailable
, some of which (f
or example
, R
eac
tome FIs) f
ocus
on cancer data analysis [38]
Net w or ks D eskt op
application (Java) The stand-alone application suppor
ts an y user -pr epar ed net w or k or attr ibut
e data. A
dditional data
ar
e a
vailable via var
ious plug
ins
(for example
, G
eneM
ANIA [72] f
or net w or ks) G
enomica [73] http://genomica.w
eizmann.ac
.il
Tool that can be used t
o analyz
e and visualiz
e genomic data. Data can be visualiz
ed as
heatmaps or along genomic coor
dinat
es
. M
odule maps and module net
w
or
ks can be cr
eat
ed
from expr
ession data and can int
eg
rat
e gene expr
ession data, DNA sequence data, and gene
and exper iment annotations M atr ix heatmap G enomic coor dinat es D eskt op
application (Java)
User
-pr
epar
ed data
G
itools [31] http://w
w w .g itools .or g Tool f
or analysis and visualization of genomic data using int
erac tiv e heatmaps . I t allo ws
loading of multidimensional matr
ices (with se
veral values per cell), and thus is v
er
y w
ell suit
ed
for the visualization and exploration of multidimensional cancer genomics data. I
t contains
se
veral analyses and options that ar
e specifically desig
ned f
or the exploration of cancer
genomics data M atr ix heatmap with int erac tiv e featur es D eskt op
application (Java)
An
y user
-pr
epar
ed data and data
impor
ted fr
om I
ntOG
en [33] database
, as w ell as an y Biomar t [69,73] database In teg ra tiv e G enomics Vie w er (IGV ) [20] http://w w w .br oadinstitut e. or g/igv Visualization t ool f or int erac tiv
e exploration of int
eg
rat
ed genomics datasets
, with a f
ocus
on good per
for
mance when w
or
king with lar
ge data sets
. All tracks can be annotat
ed with
color
-coded sample and clinical inf
or
mation; genomic r
eg
ions can be annotat
ed with t
ex
t
labels
. All of the common genomic file f
or
mats ar
e suppor
ted
, including ar
ra
y-based data,
nex
t-generation sequence data f
or
mats and genomic annotations
G enomic coor dinat es D eskt op
application (Java)
User
-pr
epar
ed data and data fr
om the
IGV ser
ver
, including some
TC
GA data.
In addition, IGV can be accessed fr
om
ex
ter
nal t
ools such as G
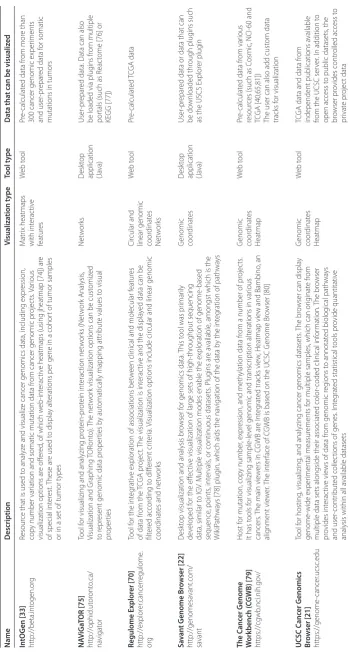
Table 1. C on tinued Name Description Visualiza tion t ype Tool t ype Da ta tha
t can be visualiz
ed In tOG en [33] http://beta.int ogen.or g Resour
ce that is used t
o analyz
e and visualiz
e cancer genomics data, including expr
ession,
cop
y number var
iation and somatic mutation data fr
om cancer genomic pr
ojec
ts
. V
ar
ious
visualization options ar
e off
er
ed
, of which w
eb
-int
erac
tiv
e heatmaps (using jheatmap [74]) ar
e
of special int
er
est.
These ar
e used t
o displa
y alt
erations per gene in a cohor
t of tumor samples
or in a set of tumor t
ypes M atr ix heatmaps with int erac tiv e featur es W eb t ool Pr e-calculat
ed data fr
om mor
e than
300 cancer genomic exper
iments
and user
-pr
epar
ed data f
or somatic
mutations in tumors
NA ViG aT OR [75] http://ophid .ut or ont o.ca/ na vigat or Tool f
or visualizing and analyzing pr
ot ein-pr ot ein int erac tion net w or ks (Net w or k Analysis ,
Visualization and Graphing
TOR ont o). The net w or
k visualization options can be cust
omiz
ed
to r
epr
esent genomic data pr
oper
ties b
y aut
omatically mapping attr
ibut
e values t
o visual pr oper ties Net w or ks D eskt op
application (Java)
User
-pr
epar
ed data. Data can also
be loaded via plug
ins fr
om multiple
por
tals (such as R
eac
tome [76] or
KEGG [77]) Regulome Explor er [70] http://explor er .cancer regulome . or g Tool f
or the int
eg
rativ
e exploration of associations bet
w
een clinical and molecular f
eatur
es
of data fr
om the
TC
GA pr
ojec
t.
The visualization is int
erac
tiv
e and the displa
yed data can be
filt er ed accor ding t o diff er ent cr iter ia.
Visualization options include cir
cular and linear genomic
coor
dinat
es and net
w
or
ks
Cir
cular and
linear genomic coor
dinat es Net w or ks W eb t ool Pr e-calculat ed TC GA data Sa van t G enome Br ow ser [22] http://genomesa vant.com/ sa vant D eskt
op visualization and analysis br
owser f
or genomics data.
This t
ool was pr
imar
ily
de
veloped f
or the eff
ec
tiv
e visualization of lar
ge sets of high-thr
oughput sequencing
data, similar t
o IGV
. M
ultiple visualization modes enable the exploration of genome
-based sequence , points , int er vals
, or continuous datasets
. P
lug
ins ar
e a
vailable
, amongst which is the
W
ik
iP
ath
wa
ys [78] plug
in, which aids the na
vigation of the data b
y the int
eg
ration of path
wa ys G enomic coor dinat es D eskt op
application (Java)
User
-pr
epar
ed data or data that can
be do
wnloaded thr
ough plug
ins such
as the USCS Explor
er plug in The C anc er G enome W ork bench ( CGWB) [79] https://cgwb .nci.nih.go v/ Host f
or mutation, cop
y number
, expr
ession, and meth
ylation data fr
om a number of pr
ojec
ts
.
It has t
ools f
or visualizing sample
-le
vel genomic and transcr
iption alt
erations in var
ious
cancers
. T
he main vie
w
ers in C
GWB ar
e I
nt
eg
rat
ed tracks vie
w
, Heatmap vie
w and Bambino
, an alig nment vie w er . T he int er
face of C
GWB is based on the UCSC G
enome Br owser [80] G enomic coor dinat es Heatmap W eb t ool Pr e-calculat
ed data fr
om var
ious
resour
ces (such as C
osmic
, NCI-60 and
TC
GA [40,65,81])
The user can also add cust
om data tracks f or visualization UCSC C anc er G enomics Br ow ser [21] https://genome -cancer .ucsc .edu Tool f or hosting , visualizing
, and analyzing cancer genomics datasets
. T
he br
owser can displa
y
genome
-wide exper
imental measur
ements f
or multiple samples
, which can or
ig
inat
e fr
om
multiple data sets alongside their associat
ed color
-coded clinical inf
or mation. The br owser pr ovides int erac tiv e vie
ws of data fr
om genomic r
eg ions t o annotat ed biolog ical path wa ys and user -contr ibut ed collec
tions of genes
. Int
eg
rat
ed statistical t
ools pr
ovide quantitativ
e
analysis within all a
vailable datasets G enomic coor dinat es Heatmap W eb t ool TC
GA data and data fr
om
independent publications a
vailable
from the UCSC ser
ver
. In addition t
o
open access t
o public datasets
, the
br
owser pr
ovides contr
olled access t
the relationships between these alter ations, presents specific challenges. This review focuses on the visuali zation principles, methods and tools em ployed to analyze these multidimensional oncogenomics datasets. (For general reviews on omics data visualization, see [1619].)
We distinguish between three main approaches com monly used to represent multidimensional onco genomics data: genomic coordinates, heatmaps and networks (Figure 1). These three approaches complement each other, and each is best suited to answer different specific questions.
Genomic coordinates
A common way to visualize oncogenomics data is to show alterations tied to their genomic loci. This approach is well suited to provide answers to questions about the genomic topography of alterations or to inspect particu lar genome loci. We distinguish between two main visualization approaches that use genomic coordinates: Genome Browsers and Circular Plots. Three of the most popular genome browsers employed to visualize cancer alterations are the Integrative Genomics Viewer (IGV) [20], the UCSC Cancer Genomics Browser [21], and the Savant Genome Browser [22]. All three support multiple data formats that are used to represent various types of alterations. They display the alterations in each tumor sample as genomic tracks, which can be loaded onto the browser and navigated by zooming and by scrolling to particular genomic regions.
The IGV and Savant genome browsers work as desktop applications and are particularly suited to the display of aligned sequencing data. IGV has a special focus on visualizing integrated datasets that include both array based and sequencingbased data as well as clinical infor mation about tumor samples and donors. The clinical information displayed in vertical lines in conjunction with the data tracks can be used to sort and group the tracks, thus simplifying the stratification of samples (Figures 2 and 3e). A further advantage of IGV is the split screen view, which allows multiple loci to be displayed next to each other. On the other hand, Savant offers an application programming interface (API) that allows thirdparty developers to extend and add visual, analytic, navigational, and data loading functions to the genome browser. Available plugins include edgeR [23], aimed at detecting differentially expressed genes or regions. Other plugins are described in the Savant Genome Browser manuscript [22]. Another strength of the Savant genome browser is the visualization of pairedend reads [19].
The webbased UCSC Cancer Genomics Browser offers an easytouse interface that can be used to browse cancer genomics datasets, such as those of The Cancer Genome Atlas (TCGA), which have been preanalyzed with various tools and include clinical information. The user can choose between different plotting types:
heat maps, box plots and proportions. The features are shown in either the classic representation bound to genomic locations or in a geneset visualization, analogous to the IGV splitscreen view, resulting in a browserlike heat map (Figure 2). Unlike IGV and Savant, the UCSC browser does not allow users to upload data.
Circos [24] is a flexible and popular tool that can be used in many different research fields to plot circular ideograms. In the case of multidimensional oncogeno mics data, the genomic coordinates of all chromosomes are represented in a circular layout (Figure 3f). This tool aptly illustrates relationships between distinct alterations, represented as data tracks outside the ideogram, that take place at different locations within the genome. These relationships between regions are normally depicted as ribbons. Intra and interchromosomal translocations are particularly well represented in Circos.
Genome browser tools in general have limited capacity to display relationships between genomic features that are independent of location, such as the coordinated expression of genes. The IGV and UCSC Cancer Genomics Browser attempt to tackle this problem using the split screen and heatmap approaches, respectively. Another issue with visualizationbased genomic refer ence is that it falls short in visualizing extensive genomic rearrange ments. The circular layout of Circos can compen sate for this deficit, or it can be resolved by the use of specific tools such as Gremlin [25]. Many other tools also per form specific tasks, exploiting the genomic coordinates representation scheme. For example, puta tive transloca tion events can be verified by the commandline tool Pairoscope [26], which generates relational diagrams of pairedend sequencing reads to aid in the discovery of translocation events. To view and analyze single nucleo tide polymorphism (SNP) and comparative genomic hybridi zation (CGH) array alteration data tools and methods such as VAMP [27] and waviCGH [28] are options based on web technologies, whereas Genome Alteration Print [29] is a desktop application. Further more, it has been proposed that there should be a move towards visualizing genomic rearrangements, such as gene fusions, graphically to emphasize the order of the rearranged segments rather than the genomic distance between the breakpoints [30].
Heatmaps
Figure 1. Cancer genomics projects generate multidimensional data for a cohort of patients. Diff erent technological platforms will screen for diff erent genomic and epigenomic changes in each patient, generating multidimensional data sets. The data are usually represented by clinical data along with one or more of the three main types of visualization tools: genomic coordinates, matrix heatmaps and networks.
Multidimensional cancer genomics data Expression
patterns
Somatic mutations
Epigenomic profiles
Structural aberrations
Copy number alterations
Clinical information
Matrix heatmaps Genomic coordinates
Networks
Chromosomal coordinates Clinical data
Interactions
Patient cohort
Clinical data Omics data
Genes
Clinical data Omics data Omics data
Genes
Samples
tumor, such as its expression level or mutational status. As matrices, heatmaps impose no restriction on the order of the data. Th is allows data from distant genome loci to be grouped and visualized together for comparison. For example, genes in the same pathway or genes that are associated with certain tumor types might be grouped together. In other words, rows or columns can be clustered according to molecular or clinical features. It is precisely this fl exibility to explore visually patterns within the alterations that are correlated to external charac ter istics, such as the function of genes or the features of the tumor samples, that make heatmaps so popular as a way of representing multidimensional oncogenomics data.
Many tools and programs generate heatmaps from numerical or categorical matrices. We focus here on tools
that have features that are particularly well suited to the visual exploration of multidimensional oncogenomics data.
Gitoo ls [31] is an openso urce java application for the analysis and visualization of matrices using interactive heatmaps. Th e heatmaps in Gitools can contain multiple dimensions, that is, multiple values in each cell, which makes it especially well suited to the exploration of multi dimensional cancer genomics data. Its interactive capa bilities allow the user to fi lter, sort, move, and hide rows and columns in the heatmap and to launch several common exploratory analyses (such as correlation, clus ter ing, enrichment and diff erential expression analyses). Multivalue data matrices, which can contain all types of alterations detected across a cohort of cancer samples, can be explored visually in Gitools, either focusing on a single Figure 2. Screenshots of tools that are frequently used in cancer genomics research distributed according to their visualization
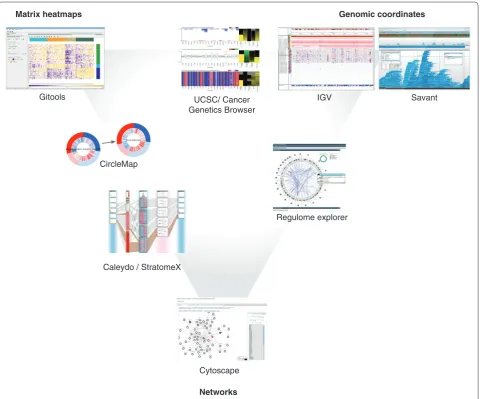
principles. Each of the three visualization methods - matrix heatmaps, genomic coordinates and networks - are associated with a point of the triangle. Tools that are placed close to one of these points mainly use the visualization method associated with that point; those placed in between use a mixed-model visualization method.
Matrix heatmaps Genomic coordinates
Networks
Gitools
CircleMap
Caleydo / StratomeX
Regulome explorer
Cytoscape
IGV Savant
dimension (that is, one type of alteration) or fixing one dimension to explore its influence on others. Gitools also allows the integration of these data with clinical information.
The cBio Cancer Genomics Portal [32] is a web resource for visualization of oncogenomics datasets that uses heatmap representation, among other options. The OncoPrint heatmaps display alterations in arrays of genes across tumor samples. Individual genes are represented as rows, and individual cases or patients as columns. Different colors and shapes are used to show different alteration types, so that multiple alterations in a patient’s gene can be distinguished easily.
IntOGen is a resource that can be used to analyze and visualize oncogenomics data [33]. It presents different values, estimating the accumulation of somatic muta tions, CNA or transcriptional alterations in genes and path ways across tumor samples. Precomputed data for more than 300 cancer genome experiments are currently available. Webinteractive heatmaps are used to explore gene and pathway alterations across samples and tumor types.
Caleydo StratomeX [34] is a visualization tool built upon the Caleydo framework [35], with a focus on ex ploring interdependencies between different stratifica tions of cancer samples within a given study. Genomics data on different alterations can be clustered and visualized as matrix heatmaps. The clusters of different alterations are connected by ribbons whose widths corres pond to the number of samples shared by the connected clusters. Clusters can also be visualized as pathway diagrams, allowing the researcher to observe the impact of alterations on pathway function (Figure 2).
Heatmaps can also be represented not as rectangles but as circles, as with CircleMap [8] (Figure 2). With this commandline tool, dimensions can be aligned in a circular plot accompanying a gene, which is represented as a circle that can be attached to other genes in a network layout (Figure 3d).
A general limitation of the heatmap visualization is that structural relationships between genes are difficult to grasp. For instance, it is very hard to discern whether the coincidence of CNA in several genes reflects a possible synergy or is simply a result of their location within a recurrently amplified or deleted chromosomic fragment. Gitools tries to solve this problem by offering the possibility of adding genomic annotations to the rows that can encode functional or structural information. Caleydo StratomeX solves this problem by incorporating pathway diagrams displaying functional relationships between the genes, and CircleMap plots can also be used as nodes to construct a network diagram for this purpose.
Networks
Networks represent functional relationships between different entities, such as genes. This type of information
is difficult to represent in heatmaps and noncircular visualizations of genomic coordinates. Genetic features can be coded in node attributes such as color, size, or shape. Different alterations can be displayed as additional halos around the node. The network arrangement allows the researcher to explore visually clusters of nodes representing highly interconnected altered genes that can constitute driver pathways or subnetworks.
Cytoscape [36], a collaborative opensource project, is a widely used and intuitive network visualization and analysis tool in genomics research. No special bioinfor matics knowledge is needed to use Cytoscape. The properties of the nodes and the edges and the network layout are customizable, and the comprehensive array of plugins constitutes an added value for researchers. This tool has proven useful for integrating expression data into a gene network [37], as well as for mapping genes with cancer somatic alterations directly to a functional interactions (FI) network [38] that identifies subnetworks of altered genes in order to find cancer drivers. A web version, Cytoscapeweb [39], is compatible with common internet browsers and facilitates interaction with the networks displayed. The cBio Cancer Genomics Portal [32] implements an adaption of this tool optimized for visually exploring multidimensional oncogenomics data from TCGA [40]. Node colors and halos encode the alteration status of cancer genes.
Representation of the genomic alterations present in individual tumor samples in network viewers presents a challenge. As a consequence, many details about the individual tumor samples are normally left out of net work figures. In the case of the cBio Cancer Genomics Portal network viewer, this problem is alleviated by the inclusion of plots that show the proportions of samples with different genomic alterations. Similar effects can be achieved with plugins for Cytoscape that transform nodes into pie charts (such as GoogleChartFunctions [41] and nodeCharts [42]).
Case studies
The case studies presented here elaborate on four different oncogenomic research questions that can be answered visually with the available tools and resources. The description of the case studies focuses on their biological interpretation. Supporting docu men tation on how to generate images corresponding to those in Figure 3 is included in the ‘Additional file 1 and 2’. Learning to use most of these tools requires a certain investment of time, and tutorials provided by the developers are highly recommended as a starting point.
Visual exploration of cancer drivers
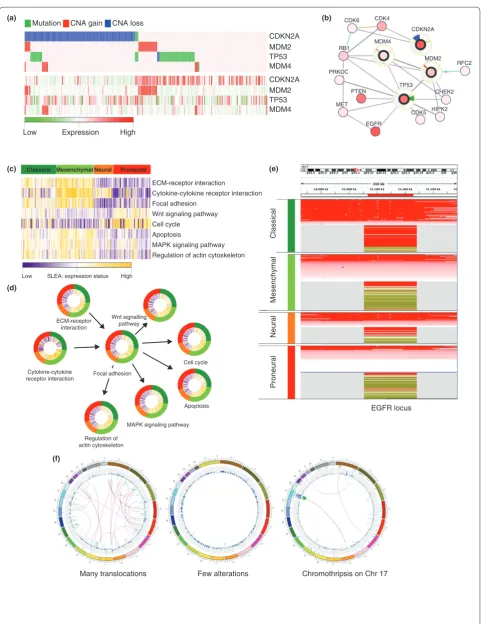
Figure 3. See next page for legend.
CDKN2A MDM2 TP53 MDM4 CDKN2A MDM2 TP53 MDM4
(a) (b)
(c) (e)
(d)
(f)
EGFR locus ECM-receptor interaction
Focal adhesion Wnt signaling pathway Cell cycle
Apoptosis
MAPK signaling pathway Regulation of actin cytoskeleton
Neural
Classical
Mesenchymal
Proneural
Many translocations Few alterations Chromothripsis on Chr 17
ECM-receptor interaction
Cytokine-cytokine receptor interaction
Cell cycle
Apoptosis
MAPK signaling pathway
Regulation of actin cytoskeleton
Wnt signalling pathway
Cytokine-cytokine receptor interaction
Mutation CNA gain CNA loss
Classical Mesenchymal Neural Proneural
High
Low Expression
High
Low SLEA: expression status
Focal adhesion
RFC2
CDK6 CDK4
MDM4 RB1
PRKDC
MET PTEN
EGFR
CDK5 HIPK2
CHEK2 TP53
side effects (passengers) of the destabilization of the cancer genome is a major problem in oncogenomics research. Several new methodologies [58,11,38,4346] address this problem by exploiting the properties of driver genes. For example, the mutually exclusive altera tion of genes in a pathway is a characteristic of cancer drivers [5,6,47]. One plausible explanation of this behavior is that an alteration that targets an affected pathway does not confer further selective advantage to the cancer cell. A builtin Gitools option sorts genes and samples within a heatmap to present the pattern of mutually exclusive alterations, which is one approach to visual exploration of driver genes that are involved in the same pathway (Figure 3a) [48]. Oncoprint (cBio Cancer Genomics Portal) uses the same principle to display the alterations across TCGA datasets of a gene set provided by the user.
An alternative approach to identify cancer drivers involves mapping altered genes to a FI network (Figure 3b) [7,38,46]. The Reactome FI Cytoscape plugin offers this functionality. After a gene list is submitted, a FI network is constructed using socalled linker genes: genes that are not in the usersubmitted list but that can connect two of the submitted genes. Usually, this approach identifies network regions in which recurrently altered genes, which are thought to point to driver genes and sub networks, are enriched. The visualization of genes and their alterations in the form of FI networks is thus very useful (see Figure 3b for an example).
Visualizing cause-effect relationships between different types of alterations
The effect of genomic alterations can be manifested at the genome, transcriptome or proteome level. Single nucleo tide variants (SNVs) might not directly influence
trans cription of the mutated gene but usually affect protein functionality. On the other hand, CNA and changes in methylation status frequently perturb the expression levels of the altered genes or other genes under their control. Determining the causeeffect relationships of such alterations is important to our understanding of cancer mechanisms. One approach is to plot one type of alteration (for example, CNAs) in a heatmap, sorting the tumor samples to separate diploid genes from altered genes. Changes in gene expression values, presented in another heatmap, can then be readily compared between these two groups (Figure 3a), allowing the detection of any significant differences.
Gitools can load a multidimensional data matrix con tain ing different alterations for each sample, and a simple switch between the values shown in the heatmap cells easily changes the display from one heatmap to the other [49].
Networks offer another way of visualizing causeeffect relationships. The interactions between genes in a network can represent their functional relationships, for example, one gene might regulate the expression of another. Overlaying the alterations within a cohort of tumors on top of each node of the network might illustrate the effect of a gene alteration on the expression of other genes in the network (analogous to Figure 3b).
The network viewer of the cBio Cancer Genomics Portal supports the visualization of expression data, if available. Similar visual effects could be achieved in Cytoscape by mapping data onto node properties.
Visualizing cancer patient stratifications
Cancer is a complex disease. Tumors that seem very similar when examined through conventional diagnostic methods might look markedly different from the Figure 3. Four case studies are represented using one or several of the major visualization methods applied in oncogenomics.
(a) Heatmap of oncogenomic alterations ordered by mutual exclusivity plotted with Gitools. In the upper half of the image, colors indicate the type of alteration: mutations (green), CNA gain (red) and CNA loss (blue). The heatmap below shows expression data (high expression in red and low expression in green) for the same samples and genes, allowing the visual observation that genomics regions whose copy number is amplified tend to have higher expression values. (b) The same data as in (a), with the same color code for alterations, represented as a network of functional interactions between the genes, extracted from the cBio Cancer Genomics Portal. The halo around the four selected nodes is divided into three sectors. Changes in the proportion of samples with altered copy number are indicated in red (gain) or blue (loss) in the top sector, whereas changes in the proportion of samples with mutations are indicated in green in the lower-right sector. Expression changes are shown in light red (increase) and light blue (decrease) in the lower-left sector of the halo. Panels (c-e) include clinical information. Each tumor sample is assigned to one of four subtypes of glioblastoma, color-coded as dark green (classical), light green (mesenchymal), orange (neural) and red (proneural).
molecular viewpoint, which can lead to different out comes or treatment responses. Therefore, the molecular features of tumors can be used to stratify patients to support more accurate clinical and therapeutic decisions. Over the past decade, molecular stratification of tumors using expression microarrays has been an important area of cancer research [5053]. The visualization of molecular alteration patterns in a heatmap is often used to explore subgroups of tumors and to associate them with parti cular clinical features. These heatmaps usually portray the expression patterns of genes or transcripts across samples, but the benefit of data analysis at the level of gene groups, for example pathways [5456], is increas ingly evident. Stratification and visualization can also be done at the level of pathways or other gene modules (Figure 3c), for example using sample level enrichment analysis (SLEA) [57,58], which analyzes the transcrip tional status of pathways (or other gene sets) in each tumor sample.
In the case of multidimensional oncogenomics data, various clinical features and alterations such as CNA or changes in mRNA or microRNA expression can be used to cluster or stratify tumors, leading to different group ings of samples. In Figure 3c,d, we show ways of repre senting the results of applying SLEA to the TCGA glio blastoma dataset, with the samples grouped by the corresponding glioblastoma subtype. The alterations are visualized using both Gitools and CircleMap. Please see the ‘Additional file 1 and 2’ for a more detailed description of this process.
Stratifications can also be meaningful when exploring a single locus. Figure 3e illustrates the same grouping of samples by glioblastoma subtype, employing copy number and expression data from the TCGA glioblastoma study using IGV (Figure 3e).
Caleydo StratomeX is especially well suited to explor ing relationships between groups of samples (Figure 2). These relationships are visualized as ribbons of varying width drawn between neighboring columns. Wide ribbons encode a high cooccurrence of samples in different group ings, whereas their absence indicates mutual exclu sion. This coding provides a straightforward and scalable overview of the consistency of group memberships of tumor samples across different data types.
Visualizing global alteration profile patterns
Various alteration phenotypes have been observed in cancer cells. One of the most conspicuous of these is the mutator phenotype [59]: tumor cells typically have an abnormally high mutational burden. Tumor samples with chromothripsis [60,61] or many chromosomal trans locations are also common. Categorization of the altera tion events in a cancer cell population could influence the therapeutic decision, and requires a simultaneous exploratory view of all the alteration events.
One approach to exploring visually all the alterations of a sample is the circular genome mapping proposed by Krzywinski et al. using their tool Circos [24]. Several cancer studies [59,6264] have used Circos to show the landscape of alterations. This tool is highly configurable, which is evident from the figures in the cited publications. One compact figure can represent all somatic alteration events in a given tumor sample. Data from different alteration types can be organized in layered circles while rearrangement events occupy the innermost space. Figure 3f is composed of three Circos plots of breast cancer samples [59] as they are represented on the Cosmic website [65]. The outermost circle of each diagram represents the human chromosomes, followed by a plot of ticks showing point mutations. The next layer plots CNA along all the chromosomes; the links in the middle visualize the structural rearrangements.
The recently developed ggbio package [66] for the R programming environment allows, among other things, the creation of circular genome plots, and supports a variety of data formats for sequencing data.
Interfacing of tools
Researchers often need to use several of the comple mentary tools described here to explore their datasets. Nevertheless, the landscape of visualization tools for multi dimensional oncogenomics data seems rather frag mented. This is the result of different groups focusing on the development of tools optimized to solve one particular visualization issue, which is probably a more efficient way of investing resources instead of engineering one single monolithic tool that has all possible visuali zation capabilities. Unfortunately, this fragmentation makes the use of different tools problematic: they accept very different data formats, they look different to users and so on. Thus, users need to spend time learning how to use each tool and reformatting their data to each tool’s requirements. This extra effort could be alleviated if developers were to facilitate the combined use of tools.
One of the major efforts to develop a universal interface that will bridge the gap between different bioinformatic tools is the GenomeSpace project [67]. GenomeSpace allows the user to store data in a common repository and the same web interface guides users to execute the integrated tools, load data, and store results. Conveniently, it contains several builtin converters for some oftenused data formats. Several tools listed in Table 1 (IGV, Genomica, Cytoscape and Gitools) are included in this pilot project. This platform interface approach is promising and possibly the most user friendly option for users who lack a background in bioinformatics.
possible when a tool offers an API that defines the form of communication between the tool and the rest of the world. There are different kinds of APIs, which allows the implementation of different approaches. If the API offers external control, it can send the tool a command and indicate whether the execution of this command has been successful or not. This is the case, for example, with IGV and Gitools: both offer a set of commands that the other application can use. Gitools has a builtin link that sends a ‘find locus’ command to IGV, whereas IGV exports data into a matrix format and commands Gitools to load it. In practical terms, this means that the user can explore the same data with two complementary visuali zation tools that can communicate with each other.
Another kind of API can be used for plugin develop ment. This is a general way of creating new capabilities for established tools. As mentioned above, Cytoscape and Savant support plugability, meaning that they possess internal commands that can be used by an application to extend the functions of the tool.
Unidirectional APIs are typically employed by data bases and allow easy data transfer between the data source and tools. For example, IGV’s external control of the software allows the cBio Cancer Genomics Portal and GenePattern [68] to load data directly into IGV, and Gitools accepts imported data for all BioMart [69] databases.
Conclusions and future directions
The cancer genomics research field is rapidly evolving in parallel with advances in highthroughput genomics technologies. This evolution of the field requires con tinuous advancement in visualization techniques and tools. For instance, the amount of data it is possible to generate for an oncogenomics project continues to increase, requiring visualization tools that very efficiently load and process large amounts of data.
As this rapid scientific evolution continues, cancer researchers are highly dependent on computational scientists and bioinformatics professionals to help them manage, analyze and visualize data. To speed up research advances, the barrier between the large amount of data generated in oncogenomics projects and the effective exploration of these data by cancer researchers must be minimized. Visualization and exploration tools should be intuitive and easy to use, not requiring computational or bioinformatics expertise. Not all tools currently meet these standards, as some programming or even technological knowledge is required of the user. In recent years, however, there has been an important effort to facilitate access by ‘nonbioinformaticians’ to visuali zation tools for the analysis of oncogenomics data [20,31,32]. Continued work to improve the usability of visualization software is highly important, but requires great effort from developers for low scientific reward
when compared to the development of new methods or visualization techniques. Funding agencies must under stand that increased investment in personnel dedicated to the development and maintenance of new tools, as well as user training and support, is crucial to the achievement of improvements in the field.
The complexity of oncogenomics data and the multi tude of questions to be addressed ensure that a static plot is often insufficient for data visualization. The user needs to explore the data interactively in order to address a wide range of questions. Several tools listed in Table 1 (including IGV, Gitools and Caleydo) make use of interactive visualization techniques to make this possible. Other web frameworks with various visualization and some optional analysis possibilities are being developed, including the cBio Cancer Genomics Portal [32], IntOGen [33] and Regulome Explorer [70]. Open source and plugin architecture facilitates quick adoption of these new platforms.
Although not discussed at length in this review, the use of cancer genomics data visualization in the clinical setting is likely to become a key topic in the near future, as the results of cancer genome projects begin to be translated into personalized cancer medicine. Clinicians will be the main users of this information as they make decisions regarding patient treatment. In this regard, simple, efficient tools that support the visual stratification of tumor genomic profiles and that highlight their relationships to known drugs or treatments will be more useful than the existing researchoriented tools. As a result, it will probably be necessary to develop specialized clinical tools or to adapt existing ones to the clinical setting. This has been achieved in the case of the MedSavant Browser [71], a clinical adaption of the Savant Genome Browser.
In summary, visualization of multidimensional onco geno mics data is essential for the extraction of useful knowledge from the vast amount of data generated by highthroughput technologies. Important efforts have been made in recent years to create visualization tools that can explore these datasets. Further efforts are needed to develop those resources and to create new tools to meet the changing needs of the field. Longterm investment and funding are needed to guarantee the maintenance, improvement, and evolution of visuali zation tools beyond their first publication.
Additional files
Additional file 1. The following additional data are available with the online version of this paper. Additional file 1 provides information on how to generate visualization images for the case studies covered.
Abbreviations
API, application programming interface; CNA, copy-number alteration; Cosmic, Catalogue of Somatic Mutations in Cancer; FI, functional interactions; IGV, Integrative Genomics Viewer; TCGA, The Cancer Genome Atlas.
Competing interests
The authors declare no competing financial interests and declare the authorship of Gitools and IntOGen.
Acknowledgements
We acknowledge funding from the Spanish Ministry of Science and Technology (grant number SAF009-06954 and FPI fellowship assigned to MPS), and from the Spanish National Institute of Bioinformatics (INB). We are thankful to Elaine M Lilly for assistance with language editing.
Author details
1Research Program on Biomedical Informatics - GRIB, Universitat Pompeu
Fabra (UPF), Parc de Recerca Biomèdica de Barcelona (PRBB), Dr. Aiguader 88,
E-08003 Barcelona, Spain. 2Institució Catalana de Recerca i Estudis Avançats
(ICREA), Barcelona, Spain.
Published: 31 January 2013
References
1. Parsons DW, Jones S, Zhang X, Lin JC-H, Leary RJ, Angenendt P, Mankoo P, Carter H, Siu I-M, Gallia GL, Olivi A, McLendon R, Rasheed BA, Keir S, Nikolskaya T, Nikolsky Y, Busam DA, Tekleab H, Diaz LA, Hartigan J, Smith DR, Strausberg RL, Marie SKN, Shinjo SMO, Yan H, Riggins GJ, Bigner DD, Karchin
R, Papadopoulos N, Parmigiani G, et al.: An integrated genomic analysis of
human glioblastoma multiforme.Science 2008, 321:1807-1812.
2. The Cancer Genome Atlas Consortium: Comprehensive genomic
characterization defines human glioblastoma genes and core pathways.
Nature 2008, 455:1061-1068.
3. The Cancer Genome Atlas Research Network: Integrated genomic analyses
of ovarian carcinoma.Nature 2011, 474:609-615.
4. International Cancer Genome Consortium, Hudson TJ, Anderson W, Artez A, Barker AD, Bell C, Bernabé RR, Bhan MK, Calvo F, Eerola I, Gerhard DS, Guttmacher A, Guyer M, Hemsley FM, Jennings JL, Kerr D, Klatt P, Kolar P, Kusada J, Lane DP, Laplace F, Youyong L, Nettekoven G, Ozenberger B, Peterson J, Rao
TS, Remacle J, Schafer AJ, Shibata T, Stratton MR, et al.: International network of
cancer genome projects.Nature 2010, 464:993-998.
5. Ciriello G, Cerami EG, Sander C, Schultz N: Mutual exclusivity analysis
identifies oncogenic network modules. Genome Res 2012, 22:398-406.
6. Vandin F, Upfal E, Raphael BJ: De novo discovery of mutated driver
pathways in cancer. Genome Res 2012, 12:375-385.
7. Vandin F, Upfal E, Raphael BJ: Algorithms for detecting significantly
mutated pathways in cancer. J Comput Biol 2011, 18:507-522.
8. Vaske CJ, Benz SC, Sanborn JZ, Earl D, Szeto C, Zhu J, Haussler D, Stuart JM:
Inference of patient-specific pathway activities from multi-dimensional cancer genomics data using PARADIGM.Bioinformatics 2010, 26:i237-i245.
9. Louhimo R, Lepikhova T, Monni O, Hautaniemi S: Comparative analysis of
algorithms for integration of copy number and expression data.Nat Methods 2012, 9:351-355.
10. Akavia UD, Litvin O, Kim J, Sanchez-Garcia F, Kotliar D, Causton HC, Pochanard
P, Mozes E, Garraway LA, Pe’er D: An integrated approach to uncover drivers
of cancer.Cell 2010, 143:1005-1017.
11. Tamborero D, Lopez-Bigas N, Gonzalez-Perez A: Oncodrive-CIS: a method to
reveal likely driver genes based on the impact of their copy number changes on expression.PLoS ONE, in press.
12. Zhang S, Liu C-C, Li W, Shen H, Laird PW, Zhou XJ: Discovery of
multi-dimensional modules by integrative analysis of cancer genomic data.
Nucleic Acids Res 2012, 40:9379-9391.
13. Medvedev P, Stanciu M, Brudno M: Computational methods for discovering
structural variation with next-generation sequencing.Nat Methods 2009,
6:S13-S20.
14. Rueda OM, Diaz-Uriarte R: Finding recurrent copy number alteration
regions: a review of methods.Curr Bioinform 2010, 5:1-17.
15. Eifert C, Powers RS: From cancer genomes to oncogenic drivers, tumour
dependencies and therapeutic targets.Nat Rev Cancer 2012, 12:572-578. 16. Gehlenborg N, O’Donoghue SI, Baliga NS, Goesmann A, Hibbs MA, Kitano H,
Kohlbacher O, Neuweger H, Schneider R, Tenenbaum D, Gavin A-C:
Visualization of omics data for systems biology.Nat Methods 2010,
7:S56-S68.
17. Nielsen CB, Cantor M, Dubchak I, Gordon D, Wang T: Visualizing genomes:
techniques and challenges.Nat Methods 2010, 7:S5-S15.
18. O’Donoghue SI, Gavin A-C, Gehlenborg N, Goodsell DS, Hériché J-K, Nielsen
CB, North C, Olson AJ, Procter JB, Shattuck DW, Walter T, Wong B: Visualizing
biological data - now and in the future.Nat Methods 2010, 7:S2-S4.
19. Quinlan AR, Hall IM: Characterizing complex structural variation in
germline and somatic genomes. Trends Genet 2012, 28:43-53.
20. Thorvaldsdóttir H, Robinson JT, Mesirov JP: Integrative Genomics Viewer
(IGV): high-performance genomics data visualization and exploration.
Brief Bioinform 2012. doi: 10.1093/bib/bbs017.
21. Sanborn JZ, Benz SC, Craft B, Szeto C, Kober KM, Meyer L, Vaske CJ, Goldman M,
Smith KE, Kuhn RM, Karolchik D, Kent WJ, Stuart JM, Haussler D, Zhu J: The UCSC
Cancer Genomics Browser: update 2011.Nucleic Acids Res 2011, 39:D951-959. 22. Fiume M, Smith EJM, Brook A, Strbenac D, Turner B, Mezlini AM, Robinson MD,
Wodak SJ, Brudno M: Savant Genome Browser 2: visualization and analysis
for population-scale genomics.Nucleic Acids Res 2012, 40(Web Server issue):W615-W621.
23. Robinson MD, McCarthy DJ, Smyth GK: edgeR: a Bioconductor package for
differential expression analysis of digital gene expression data.
Bioinformatics 2010, 26:139-140.
24. Krzywinski M, Schein J, Birol I, Connors J, Gascoyne R, Horsman D, Jones SJ,
Marra MA: Circos: an information aesthetic for comparative genomics.
Genome Res 2009, 19:1639-1645.
25. O’Brien TM, Ritz AM, Raphael BJ, Laidlaw DH: Gremlin: an interactive
visualization model for analyzing genomic rearrangements.IEEE Trans Vis Comput Graph 2010, 16:918-926.
26. Ding L, Ellis MJ, Li S, Larson DE, Chen K, Wallis JW, Harris CC, McLellan MD, Fulton RS, Fulton LL, Abbott RM, Hoog J, Dooling DJ, Koboldt DC, Schmidt H, Kalicki J, Zhang Q, Chen L, Lin L, Wendl MC, McMichael JF, Magrini VJ, Cook L, McGrath SD, Vickery TL, Appelbaum E, Deschryver K, Davies S, Guintoli T, Lin L, et al.: Genome remodelling in a basal-like breast cancer metastasis and xenograft.Nature 2010, 464:999-1005.
27. Rosa PL, Viara E, Hupé P, Pierron G, Liva S, Neuvial P, Brito I, Lair S, Servant N, Robine N, Manié E, Brennetot C, Janoueix-Lerosey I, Raynal V, Gruel N, Rouveirol C, Stransky N, Stern M-H, Delattre O, Aurias A, Radvanyi F, Barillot E:
VAMP: visualization and analysis of array-CGH, transcriptome and other molecular profiles.Bioinformatics 2006, 22:2066-2073.
28. Carro A, Rico D, Rueda OM, Díaz-Uriarte R, Pisano DG: waviCGH: a web
application for the analysis and visualization of genomic copy number alterations. Nucleic Acids Res 2010, 38:W182-W187.
29. Popova T, Manié E, Stoppa-Lyonnet D, Rigaill G, Barillot E, Stern MH: Genome
Alteration Print (GAP): a tool to visualize and mine complex cancer genomic profiles obtained by SNP arrays.Genome Biol 2009, 10:R128.
30. Nielsen C, Wong B: Points of view: representing genomic structural
variation.Nat Methods 2012, 9:631.
31. Perez-Llamas C, Lopez-Bigas N: Gitools: analysis and visualisation of
genomic data using interactive heat-maps.PLoS ONE 2011, 6:e19541. 32. Cerami E, Gao J, Dogrusoz U, Gross BE, Sumer SO, Aksoy BA, Jacobsen A, Byrne
CJ, Heuer ML, Larsson E, Antipin Y, Reva B, Goldberg AP, Sander C, Schultz N:
The cBio cancer genomics portal: an open platform for exploring multidimensional cancer genomics data.Cancer Discov 2012, 2:401-404. 33. Gundem G, Perez-Llamas C, Jene-Sanz A, Kedzierska A, Islam A, Deu-Pons J,
Furney SJ, Lopez-Bigas N: IntOGen: integration and data mining of
multidimensional oncogenomic data. Nat Methods 2010, 7:92-93. 34. Lex A, Streit M, Schulz H-J, Partl C, Schmalstieg D, Park PJ, Gehlenborg N:
StratomeX: visual analysis of large-scale heterogeneous genomics data for cancer subtype characterization.Comput Graph Forum 2012, 31:1175-1184.
35. Streit M, Lex A, Kalkusch M, Zatloukal K, Schmalstieg D: Caleydo: connecting
pathways and gene expression.Bioinformatics 2009, 25:2760-2761.
36. Shannon P: Cytoscape: a software environment for integrated models of
biomolecular interaction networks.Genome Res 2003, 13:2498-2504. 37. Cline MS, Smoot M, Cerami E, Kuchinsky A, Landys N, Workman C, Christmas
R, Avila-Campilo I, Creech M, Gross B, Hanspers K, Isserlin R, Kelley R, Killcoyne S, Lotia S, Maere S, Morris J, Ono K, Pavlovic V, Pico AR, Vailaya A, Wang P-L, Adler A, Conklin BR, Hood L, Kuiper M, Sander C, Schmulevich I, Schwikowski
B, Warner GJ, et al.: Integration of biological networks and gene expression
data using Cytoscape.Nat Protoc 2007, 2:2366-2382.
38. Wu G, Feng X, Stein L: A human functional protein interaction network and
39. Lopes CT, Franz M, Kazi F, Donaldson SL, Morris Q, Bader GD: Cytoscape Web: an interactive web-based network browser. Bioinformatics 2010,
26:2347-2348.
40. The Cancer Genome Atlas [http://cancergenome.nih.gov/]
41. Smoot ME, Ono K, Ruscheinski J, Wang P-L, Ideker T: Cytoscape 2.8: new
features for data integration and network visualization. Bioinformatics
2011, 27:431-432.
42. nodeCharts Cytoscape Plugin
[http://www.cgl.ucsf.edu/cytoscape/utilities/index.html#nodeCharts]
43. Gonzalez-Perez A, Lopez-Bigas N: Functional impact bias reveals cancer
drivers.Nucleic Acids Res 2012, 40:e169.
44. Mermel CH, Schumacher SE, Hill B, Meyerson ML, Beroukhim R, Getz G:
GISTIC2.0 facilitates sensitive and confident localization of the targets of focal somatic copy-number alteration in human cancers.Genome Biol 2011,
12:R41.
45. Getz G, Höfling H, Mesirov JP, Golub TR, Meyerson M, Tibshirani R, Lander ES:
Comment on “The consensus coding sequences of human breast and colorectal cancers.” Science 2007, 317:1500.
46. Cerami E, Demir E, Schultz N, Taylor BS, Sander C: Automated network
analysis identifies core pathways in glioblastoma.PLoS ONE 2010, 5:e8918. 47. Thomas RK, Baker AC, DeBiasi RM, Winckler W, LaFramboise T, Lin WM, Wang M, Feng W, Zander T, MacConaill LE, Lee JC, Nicoletti R, Hatton C, Goyette M, Girard L, Majmudar K, Ziaugra L, Wong K-K, Gabriel S, Beroukhim R, Peyton M, Barretina J, Dutt A, Emery C, Greulich H, Shah K, Sasaki H, Gazdar A, Minna J,
Armstrong SA, et al.: High-throughput oncogene mutation profiling in
human cancer.Nat Genet 2007, 39:347-351.
48. Visualizing mutually exclusive alteration patterns in cancer with Gitools
[http://bg.upf.edu/blog/2012/03/visualizing- mutually- exclusive- alteration- patterns- in- cancer-with-gitools/]
49. Exploring the effect of cancer genomic alteration on expression with
Gitools [http://bg.upf.edu/blog/2012/03/exploring- the- effect- of- cancer- genomic- alteration-on-expression-with-gitools/]
50. van ’t Veer LJ, Dai H, van de Vijver MJ, He YD, Hart AAM, Mao M, Peterse HL, van der Kooy K, Marton MJ, Witteveen AT, Schreiber GJ, Kerkhoven RM,
Roberts C, Linsley PS, Bernards R, Friend SH: Gene expression profiling
predicts clinical outcome of breast cancer.Nature 2002, 415:530-536.
51. van ’t Veer LJ, Bernards R: Enabling personalized cancer medicine through
analysis of gene-expression patterns.Nature 2008, 452:564-570.
52. Parker JS, Mullins M, Cheang MCU, Leung S, Voduc D, Vickery T, Davies S, Fauron C, He X, Hu Z, Quackenbush JF, Stijleman IJ, Palazzo J, Marron JS, Nobel AB,
Mardis E, Nielsen TO, Ellis MJ, Perou CM, Bernard PS: Supervised risk predictor
of breast cancer based on intrinsic subtypes. J Clin Oncol 2009, 27:1160-1167. 53. Sørlie T, Perou CM, Tibshirani R, Aas T, Geisler S, Johnsen H, Hastie T, Eisen MB, van de Rijn M, Jeffrey SS, Thorsen T, Quist H, Matese JC, Brown PO, Botstein D,
Lønning PE, Børresen-Dale AL: Gene expression patterns of breast
carcinomas distinguish tumor subclasses with clinical implications.Proc Natl Acad Sci U S A 2001, 98:10869-10874.
54. Subramanian A, Tamayo P, Mootha VK, Mukherjee S, Ebert BL, Gillette MA,
Paulovich A, Pomeroy SL, Golub TR, Lander ES, Mesirov JP: Gene set
enrichment analysis: a knowledge-based approach for interpreting genome-wide expression profiles.Proc Natl Acad Sci U S A 2005,
102:15545-15550.
55. Khatri P, Sirota M, Butte AJ: Ten years of pathway analysis: current approaches
and outstanding challenges.PLoS Comput Biol 2012, 8:e1002375.
56. Bild AH, Potti A, Nevins JR: Linking oncogenic pathways with therapeutic
opportunities.Nat Rev Cancer 2006, 6:735-741.
57. Gundem G, Lopez-Bigas N: Sample level enrichment analysis (SLEA)
unravels shared stress phenotypes among multiple cancer types.Genome
Med 2012, 4:28.
58. Sample Level Enrichment Analysis (SLEA) tutorial and Gitools 1.6.2
[http://bg.upf.edu/blog/2012/04/sample-level-enrichment-analysis-slea-tutorial-and-gitools-1-6-2/]
59. Stephens PJ, McBride DJ, Lin M-L, Varela I, Pleasance ED, Simpson JT, Stebbings LA, Leroy C, Edkins S, Mudie LJ, Greenman CD, Jia M, Latimer C, Teague JW, Lau KW, Burton J, Quail MA, Swerdlow H, Churcher C, Natrajan R, Sieuwerts AM, Martens JWM, Silver DP, Langerød A, Russnes HEG, Foekens JA,
Reis-Filho JS, van ’t Veer L, Richardson AL, Børresen-Dale A-L, et al.: Complex
landscapes of somatic rearrangement in human breast cancer genomes.
Nature 2009, 462:1005-1010.
60. Stephens PJ, Greenman CD, Fu B, Yang F, Bignell GR, Mudie LJ, Pleasance ED, Lau KW, Beare D, Stebbings LA, McLaren S, Lin M-L, McBride DJ, Varela I,
Nik-Zainal S, Leroy C, Jia M, Menzies A, Butler AP, Teague JW, Quail MA, Burton J, Swerdlow H, Carter NP, Morsberger LA, Iacobuzio-Donahue C, Follows GA,
Green AR, Flanagan AM, Stratton MR, et al.: Massive genomic rearrangement
acquired in a single catastrophic event during cancer development. Cell
2011, 144:27-40.
61. Rausch T, Jones DTW, Zapatka M, Stütz AM, Zichner T, Weischenfeldt J, Jäger N, Remke M, Shih D, Northcott PA, Pfaff E, Tica J, Wang Q, Massimi L, Witt H, Bender S, Pleier S, Cin H, Hawkins C, Beck C, von Deimling A, Hans V, Brors B,
Eils R, Scheurlen W, Blake J, Benes V, Kulozik AE, Witt O, Martin D, et al.:
Genome sequencing of pediatric medulloblastoma links catastrophic DNA rearrangements with TP53 mutations. Cell 2012, 148:59-71. 62. Kloosterman WP, Hoogstraat M, Paling O, Tavakoli-Yaraki M, Renkens I,
Vermaat JS, van Roosmalen MJ, van Lieshout S, Nijman IJ, Roessingh W, van ‘t
Slot R, van de Belt J, Guryev V, Koudijs M, Voest E, Cuppen E: Chromothripsis
is a common mechanism driving genomic rearrangements in primary and metastatic colorectal cancer.Genome Biol 2011, 12:R103.
63. Ellis MJ, Ding L, Shen D, Luo J, Suman VJ, Wallis JW, Tine BAV, Hoog J, Goiffon RJ, Goldstein TC, Ng S, Lin L, Crowder R, Snider J, Ballman K, Weber J, Chen K, Koboldt DC, Kandoth C, Schierding WS, McMichael JF, Miller CA, Lu C, Harris CC, McLellan MD, Wendl MC, DeSchryver K, Allred DC, Esserman L, Unzeitig G, et al.: Whole-genome analysis informs breast cancer response to aromatase inhibition.Nature 2012, 486:353-360.
64. Nik-Zainal S, Alexandrov LB, Wedge DC, Van Loo P, Greenman CD, Raine K, Jones D, Hinton J, Marshall J, Stebbings LA, Menzies A, Martin S, Leung K, Chen L, Leroy C, Ramakrishna M, Rance R, Lau KW, Mudie LJ, Varela I, McBride DJ, Bignell GR, Cooke SL, Shlien A, Gamble J, Whitmore I, Maddison M, Tarpey
PS, Davies HR, Papaemmanuil E, et al.: Mutational processes molding the
genomes of 21 breast cancers.Cell 2012, 149:979-993.
65. Bamford S, Dawson E, Forbes S, Clements J, Pettett R, Dogan A, Flanagan A,
Teague J, Futreal PA, Stratton MR, Wooster R: The COSMIC (catalogue of somatic
mutations in cancer) database and website. Br J Cancer 2004, 91:355-358.
66. Yin T, Cook D, Lawrence M: ggbio: an R package for extending the grammar
of graphics for genomic data.Genome Biol 2012, 13:R77.
67. GenomeSpace [http://www.genomespace.org/]
68. Reich M, Liefeld T, Gould J, Lerner J, Tamayo P, Mesirov JP: GenePattern 2.0.
Nat Genet 2006, 38:500-501.
69. Haider S, Ballester B, Smedley D, Zhang J, Rice P, Kasprzyk A: BioMart Central
Portal -unified access to biological data.Nucleic Acids Res 2009, 37:W23-W27.
70. Network TCGA: Comprehensive molecular characterization of human
colon and rectal cancer.Nature 2012, 487:330-337.
71. MedSavant [http://genomesavant.com/medsavant/]
72. Mostafavi S, Ray D, Warde-Farley D, Grouios C, Morris Q: GeneMANIA: a
real-time multiple association network integration algorithm for predicting gene function.Genome Biol 2008, 9:S4.
73. Segal E, Friedman N, Koller D, Regev A: A module map showing conditional
activity of expression modules in cancer.Nat Genet 2004, 36:1090-1098.
74. jHeatmap [http://bg.upf.edu/jheatmap/]
75. Brown KR, Otasek D, Ali M, McGuffin MJ, Xie W, Devani B, van Toch IL, Jurisica I:
NAViGaTOR: Network Analysis, Visualization and Graphing Toronto.
Bioinformatics 2009, 25:3327-3329.
76. Joshi-Tope G: Reactome: a knowledgebase of biological pathways.Nucleic
Acids Res 2004, 33:D428-D432.
77. Ogata H, Goto S, Sato K, Fujibuchi W, Bono H, Kanehisa M: KEGG: Kyoto
Encyclopedia of Genes and Genomes.Nucleic Acids Res 1999, 27:29-34. 78. Kelder T, van Iersel MP, Hanspers K, Kutmon M, Conklin BR, Evelo CT, Pico AR:
WikiPathways: building research communities on biological pathways.
Nucleic Acids Res 2012, 40(Database issue):D1301-D1307.
79. Zhang J, Finney R, Edmonson M, Schaefer C, Rowe W, Yan C, Clifford R, Greenblum S, Wu G, Zhang H, Liu H, Nguyen C, Hu Y, Madhavan S, Ding L,
Wheeler DA, Gerhard DS, Buetow KH: The Cancer Genome Workbench:
identifying and visualizing complex genetic alterations in tumors.
NCI Nature Pathway Interaction Database 2010, doi: 10.1038/pid.2010.1. 80. Kent WJ, Sugnet CW, Furey TS, Roskin KM, Pringle TH, Zahler AM, Haussler D:
The Human Genome Browser at UCSC.Genome Res 2002, 12:996-1006.
81. Shoemaker RH: The NCI60 human tumour cell line anticancer drug screen.
Nat Rev Cancer 2006, 6:813-823.
doi:10.1186/gm413
Cite this article as: Schroeder MP, et al.: Visualizing multidimensional cancer