R E S E A R C H
Open Access
Linked read sequencing resolves complex
genomic rearrangements in gastric cancer
metastases
Stephanie U. Greer
1, Lincoln D. Nadauld
1,2, Billy T. Lau
3, Jiamin Chen
1, Christina Wood-Bouwens
1, James M. Ford
1,
Calvin J. Kuo
1,4and Hanlee P. Ji
1,3*Abstract
Background:Genome rearrangements are critical oncogenic driver events in many malignancies. However, the
identification and resolution of the structure of cancer genomic rearrangements remain challenging even with whole genome sequencing.
Methods:To identify oncogenic genomic rearrangements and resolve their structure, we analyzed linked read sequencing. This approach relies on a microfluidic droplet technology to produce libraries derived from single, high molecular weight DNA molecules, 50 kb in size or greater. After sequencing, the barcoded sequence reads provide long range genomic information, identify individual high molecular weight DNA molecules, determine the haplotype context of genetic variants that occur across contiguous megabase-length segments of the genome and delineate the structure of complex rearrangements. We applied linked read sequencing of whole genomes to the analysis of a set of synchronous metastatic diffuse gastric cancers that occurred in the same individual.
Results:When comparing metastatic sites, our analysis implicated a complex somatic rearrangement that was present in the metastatic tumor. The oncogenic event associated with the identified complex rearrangement resulted in an amplification of the known cancer driver geneFGFR2. With further investigation using these linked read data, theFGFR2
copy number alteration was determined to be a deletion-inversion motif that underwent tandem duplication, with unique breakpoints in each metastasis. Using a three-dimensional organoid tissue model, we functionally validated the metastatic potential of anFGFR2amplification in gastric cancer.
Conclusions:Our study demonstrates that linked read sequencing is useful in characterizing oncogenic
rearrangements in cancer metastasis.
Keywords:Whole genome analysis, Cancer rearrangements, High molecular weight DNA, Cancer drivers,
Barcode linked sequence reads
Background
Genomic rearrangements are alterations of large genomic segments, sometimes spanning megabases. Rearrange-ments are composed of structural variants (SVs), of which there are several classes, including large insertions, large deletions, inversions, duplications, and translocations. Germline SVs are a significant source of variation among
normal genomes [1] while somatic SVs are widely ob-served among many different cancers [2, 3]. Somatic rearrangements of the cancer genome are important drivers of oncogenesis. For example, some transloca-tions lead to oncogenic gain-of-function that can act as critical cancer drivers and potential therapeutic targets. One example is seen in chronic myelogenous leukemia, a hematologic malignancy, which is characterized by a translocation of chromosomes 9 and 22 that leads to theBCR-ABLchimeric gene product, an essential onco-genic driver [4, 5]. Similarly, cancers derived from solid * Correspondence:[email protected]
1
Division of Oncology, Department of Medicine, Stanford University School of Medicine, CCSR 1115, 269 Campus Drive, Stanford, CA 94305-5151, USA
3Stanford Genome Technology Center, Stanford University, Palo Alto, CA
94304, USA
Full list of author information is available at the end of the article
tissues also have translocations that have functional sig-nificance in contributing to neoplastic development [6–9].
In tumors, genomic instability leads to somatic rear-rangements. Detecting and characterizing these somatic rearrangements is particularly difficult due to the sheer structural complexity of cancer genomes [10]. Genomic instability can lead to complex combinations of multiple SVs that aggregate around specific loci [11, 12]. Deter-mining the structure of cancer rearrangements is further complicated by the diploid nature of the human genome, since it is frequently unclear whether proximal SV events occur on the same parental chromosome (i.e., are in “cis”) or different chromosomes (i.e., are in “trans”). Adding to the difficulty of identifying somatic SVs, tumor cells rarely occur as pure cell populations in solid tumors, but are frequently intermingled with normal stroma. Thus, cancer genomes are practically “diluted” among normal diploid genomes and a somatic SV/rearrangement event may be represented in allelic fractions that are less than 50% of what one would see in a normal diploid genome [13, 14]. In this context, detection of somatic SVs from genomic DNA becomes more difficult. The use of RNA-seq or other RNA-based molecular assays improves the sensitivity of detecting rearranged gene products [15, 16], but generally does not reveal the underlying structure of genomic DNA rearrangements.
Whole genome sequencing (WGS) with short se-quence reads, typically less than several hundred bases, is the current method of choice for SV detection in can-cer [17–19]. We will refer to whole genome analysis with short reads as conventional WGS. This approach has proven to be highly informative for characterizing cancer genomes in terms of genetic aberrations such as point mutations and presence of copy number alterations. However, using conventional WGS for SV discovery re-mains a significant challenge. This issue is a direct result of the molecular preparation necessary to generate short read data; high molecular weight (HMW) genomic DNA is fragmented into low molecular weight species, typically under 0.5 kb, and these short fragments are used to gener-ate libraries for sequencing. As a result, one loses the gen-omic contiguity found in HMW DNA molecules. Without this genomic contiguity, it becomes significantly more dif-ficult to determine structural changes that span larger, megabase-scale segments.
In conventional WGS, SV detection relies on a combin-ation of the following methods: i) read count, ii) read-pair, iii) split-read, or iv) de novo assembly [18]. Performance among SV callers using short read sequence data varies sig-nificantly and independent verification is oftentimes re-quired with a different type of molecular assay such as PCR amplicons that cross a novel breakpoint. These SV detec-tion methods rely heavily on accurate read alignment—in highly repetitive regions of the genome, misalignment leads
to a high rate of false positive SV calls. Moreover, with short read sequences derived from small fragments of DNA, it is extremely difficult to determine rearrangements that span megabase-scale segments and to reconstruct complex SV structures. Long read sequencing technologies, such as the Pacific Bioscience’s and Oxford Nanopore’s sequencers, generate reads on the scale of thousands of kilobases, and thus have seen application for SV detection and complex SV resolution [1]. However, the cost of these technologies is prohibitive for certain studies and the base qualities achieved are much lower than Illumina sequencing, which is an issue for complex samples where there are fractional allelic differences (Additional file 1: Table S1). For example, the high cost of long read sequencing technologies gen-erally precludes their use for WGS and thus a targeted approach may be required, which relies on having prior knowledge of candidate complex SVs. In general, SV phasing and complex SV resolution is an ongoing area of research. Here, we use high quality sequence data derived from HMW DNA molecules with intact genomic contiguity to address issues associated with previous approaches.
We applied a recently developed library preparation technique that provides sequence from individual HMW DNA molecules to conduct a proof-of-concept study to identify somatic rearrangements from metastatic gastric tumors [20]. This technology relies on preparative microfluidics for generating droplet partitions. This process avoids any fragmentation and thus is ideal for sequencing HMW DNA molecules, on the order of 50 kb or higher. With an input of one nanogram of DNA that represents approximately 300 genome equivalents, the microfluidics distribute small amounts of input DNA across more than one million droplet partitions [20]. Each droplet contains anywhere from three to five DNA molecules along with a single gel bead reagent contain-ing a unique oligonucleotide barcode that identifies each droplet (Additional file 2: Figure S1). In addition to the DNA and gel bead, each droplet contains the enzymatic reagents that enable random priming and polymerase amplification to occur. This process incorporates the droplet-specific barcode into the synthesized DNA. Barcode-tagged DNA molecules are released from the droplets and then undergo a final preparative step that results in complete libraries. Subsequently, the libraries are sequenced with an Illumina system.
partition and the amount of input DNA is low. We used this molecular identification to characterize the HMW DNA molecules that span rearrangement breakpoints. In addition, the barcode linked reads enable one to phase cis-related genetic variants and identify larger haplotypes encompassing thousands of variants in megabase-size genomic segments. We used this haplotype information to make inferences about the relationship of SV break-points and infer the overall genomic structure of com-plex rearrangements occurring in cancer tissue samples. Previously, we demonstrated that linked read sequence data can be used to infer complex structural variants pri-marily based on visualizations [20]. In this study, we im-prove on the approach by quantifying barcode overlap between SV breakpoints, distinct SV events, and phased SNVs in order to assign SV phase. Further, identification of barcodes specific to SV events enables identification and fine-scale mapping of SV-specific reads to infer HMW structure and, thus, the structure of the original tumor DNA.
Gastric carcinoma is the fifth most common malig-nancy and the third leading cause of cancer deaths in the world [21]. Traditionally, gastric carcinoma has been classified into two subtypes—intestinal and diffuse—-based on distinct histopathologic features. A recent genome survey of gastric carcinoma revealed molecular subtypes of gastric cancer that partially correspond to histopathologic classification [22]. Diffuse gastric can-cer (DGC) is a distinct pathologic and molecular sub-type of stomach cancer, defined by both its distinct signet cell ring features, its infiltrative pattern of tissue invasion, and loss of the tumor suppressor CDH1 (i.e., E-cadherin) that leads to aberrant initiation of the epithelial-to-mesenchymal transition.
We developed a series of new methods that employed barcode linked read analysis to discover cancer rear-rangements composed of different SV classes in DGC. We applied these methods to a pair of metastatic diffuse gastric cancers from the same individual. An important concept for this study is that the barcodes and their linked sequences directly represent both the identity and number of single HMW DNA molecules (>50 kb on average). With this information, one can extrapolate the identity of specific DNA molecules that contain SVs. Moreover, the barcode linked reads provide a means to resolve the structure of complex SV events given that genomic contiguity is maintained. Finally, we used the barcode linked sequence data to determine specific haplotype blocks that covered the affected locus. This haplotype information enabled us to infer the parental chromosome origins of the rearrangements. Our analysis identified cancer rearrangements even in the context of having lower fractions of tumor to normal cells. We identified a unique and highly complexFGFR2(fibroblast
growth factor receptor 2) tandem duplication with a unique structure specific to each metastatic site—this complex rearrangement was not present in the primary tumor. Using an organoid system, we functionally vali-dated the role of FGFR2 gain-of-function as a potential oncogenic driver associated with metastasis.
Methods
Tumor samples and nucleic acid extraction
This study was conducted in compliance with the Helsinki Declaration. The institutional review board at Stanford University School of Medicine approved the study protocol (19071). We obtained a matched set of samples including a gastric primary cancer, two metas-tases from each ovary, and normal stomach tissue (Additional file 2: Figure S2). These samples were ob-tained from the Stanford Cancer Institute tissue bank. Based on a formal pathology review, the overall tumor purity of these samples was estimated at less than 40%. Macro-dissection of the tumor samples was performed to increase the tumor DNA fraction in the final extrac-tion. We used the Maxwell 16 FFPE Plus LEV DNA purification kit to extract genomic DNA from the formalin-fixed paraffin-embedded (FFPE) samples and Maxwell 16 Tissue DNA purification to extract DNA from frozen samples according to the manufacturer’s protocol (Promega, Madison, WI, USA). Final DNA concentrations were quantified with the Qubit 2.0 fluorometer (Invitrogen, Carlsbad, CA, USA).
Linked read library preparation, sequencing, and analysis
For sequencing we used 1 ng of extracted DNA from each of the normal and two ovarian metastatic samples. The Chromium Gel Bead and Library Kit (10X Genom-ics, Pleasanton, CA, USA) and the Chromium instru-ment (10X Genomics) were used to prepare the libraries for sequencing. The barcoded libraries were sequenced on an Illumina HiSeq 4000 system. The resulting BCL files were demultiplexed and converted to fastq files using bclprocessor (v2.0.0). The phasing software Long Ranger (v2.0.0) was run to generate a phased call-set of single nucleotide variants (SNVs) and insertion/deletions (indels), and to perform SV discovery.
Whole genome sequencing
a HiSeq X with 150 by 150-bp paired-end reads. Se-quence reads were aligned to the human genome version GRCh37.1 using the BWA-MEM algorithm of the Burrows-Wheeler Aligner (BWA) v0.7.4 [23] with de-fault parameters. Read mapping and sequencing cover-age statistics are listed in Additional file 1: Table S2. The GATK (v3.3) DepthOfCoverage tool was used to calculate coverage metrics [24].
WGS of FFPE samples
To compensate for the fragmented nature of samples preserved with FFPE, we prepared sequencing libraries for the primary tumor FFPE sample and matched nor-mal FFPE sample using the GemCode Gel Bead and Li-brary Kit (10X Genomics) and the GemCode instrument (10X Genomics). The barcoded libraries were sequenced on an Illumina NextSeq instrument, and the resulting BCL files were demultiplexed and converted to fastq files using bclprocessor (v1.2.0). The aligner function of Long Ranger (v1.2.0) was run to generate aligned bam files. For the FFPE samples, the barcoded nature of the linked reads was used solely to improve alignment of the se-quence reads; no phasing was performed for these data as the quality of FFPE samples is not adequate to infer long range haplotypes. Read mapping and sequencing coverage statistics are listed in Additional file 1: Table S2. The GATK (v3.3) DepthOfCoverage tool was used to calculate coverage metrics [24].
Rearrangement analysis
We used the Long Ranger (v2.0.0) program to identify SV breakpoints. Long Ranger produces a file of SV calls in BEDPE format which reports the start and end positions of the two breakpoints of each SV call. Using these SV calls from our normal and tumor samples, we used a custom Py-thon script to identify the somatic, tumor-specific SVs that represent potential driver events (Additional file 2: Figure S3). Within the script, we implemented the pybedtools package to perform BEDtools [25] intersections of the SV calls in the tumor sample with the SV calls in the normal sample to define somatic events.
Next, we validated the SVs identified from linked read sequencing using SVs identified from independently gen-erated and thus completely orthogonal conventional WGS. Using the conventional WGS data as input, tumor SVs were detected using LumPy and somatic copy number variants (CNVs) were detected using BICseq2 [26, 27]. LumPy was run using the lumpyexpress executable with default parameters, and the output VCF file was parsed to bed format for further processing. For copy number call-ing, BICseq2 first removes potential biases from the se-quencing data (BICseq2-norm v0.2.4) and subsequently calls CNVs from the normalized data (BICseq2-seg v0.7.2). The lambda parameter supplied to BICseq2-seg tunes the
smoothness of the resulting CNV profile; a lambda value of 30 was used to call CNVs for the primary tumor and metastatic samples. Amplifications and deletions were called as segments with tumor/normal copy number ratios greater than 1.25 and less than 0.95, respectively.
With the Long Ranger SV output, we generated a file listing the genomic coordinates 5 kb upstream and downstream of the SV breakpoint. Using the results from the LumPy SV caller [28] and the BICseq2 CNV caller [26] on the conventional TruSeq WGS data, we generated an-other file listing the genomic coordinates 5 kb upstream and downstream of the SV breakpoint. To compare the results between the linked read SVs and conventional WGS SVs, we used pybedtools [25] to identify common overlapping windows per a 5-kb positional proximity.
Finally, we identified those SV events that were located in the vicinity of known and candidate driver genes in gastric cancer. We generated a list of gastric cancer driver genes by selecting the top 10% most frequently mutated genes and the top 10% most frequently copy number variant genes in gastric cancer according to The Cancer Genome Atlas (TCGA) [22]. This ranking gener-ated a total of 3641 unique genes (Additional file 3). We generated 1-Mb windows around SV coordinates and then performed an intersection with the gene coordinates for gastric cancer genes.
IdentifyingFGFR2copy number using droplet digital PCR
To determine FGFR2 copy number, we used droplet digital PCR (ddPCR) with a QX200 instrument (Bio-Rad, Hercules, CA, USA) following the manufacturer’s in-structions. Briefly, gDNA was first digested by EcoRI-HF (NEB) and cleaned up by AMPure XP beads (Beckman Coulter). Digested gDNA (4 ng) was assayed per 20-μl reaction. The copy number assay primers and probes for FGFR2 (dHsaCP2500320) and RPP30 (dHsaCP1000485) reference were obtained from Bio-Rad. After droplet generation, the reaction mixes proceed to thermal cycling as 95 °C × 10 min (1 cycle), 94 °C × 30 s, and 60 °C × 60 s (40 cycles), 98 °C × 10 min (1 cycle), and 12 °C hold. Drop-let fluorescence was determined and the QuantaSoft soft-ware (Bio-Rad) was used to determine copy number. FGFR2 copy number was estimated as the ratio of the FGFR2andRPP30copy number multiplied by two. Each sample was measured in triplicate. As a positive control and standard curve for comparison, we used a gDNA mix-ture with different ratios of Kato III, a DGC cell line with a knownFGFR2amplification, and a normal DNA source, NA18507 gDNA (Coriell).
Structural variant phasing to determinecisortrans
relationships
from the linked reads. These scripts provided a graphic representation of barcode information and determined the overlapping haplotypes among individual SV events (Additional file 2: Figure S4). The custom scripts used to process the data are available on GitHub (https:// github.com/sgreer77/sv-phasing_linkedreads). For in-put, we used two Long Ranger result files: (1) the linked read BAM file which provides the mapping loca-tion and barcode of each sequence read; (2) the phased VCF file which contains phased variants, haplotypes, and the barcode support for the haplotype assignments. Using the barcode as an identifier for individual DNA molecules (i.e., molecular barcode) was an important component of the analysis. As shown in Additional file 2: Figure S4, the steps of the analysis process are out-lined below.
Step 1: specify SV events to be phased
The input was the SV BEDPE file containing the SV breakpoints within the proximity of cancer drivers as already described. For a pair of SV calls (vi, vj),
break-points were defined as in Eq. 1:
vi¼ðxi;yiÞ
vj¼ xj;yj
ð1Þ
Specifically, the variablexi refers to the genomic coor-dinates proximal to the p arm and the yi refers to the genomic coordinates proximal to the q arm.
Step 2: obtain molecular barcodes in windows around breakpoints
For each SV breakpoint, we generated a window seg-ment size, as denoted by the variablew, large enough to obtain molecular barcode information from mapped linked reads. The variable bar rð Þi refers to the barcode of an individual sequence read. At this step, we obtained the barcodes of all reads that mapped within the win-dow, regardless of any evidence of association with the SV event (Eq. 2):
B xð Þ ¼i bar rð Þi s:t: ri∈ xi−
w 2; xiþ
w 2
h i
n o
B xj ¼ bar rð Þi s:t: ri∈ xj−
w 2; xjþ
w 2
h i
n o
B yð Þ ¼i bar rð Þi s:t: ri∈ yi−
w 2; yiþ
w 2
h i
n o
B yj ¼ bar rð Þi s:t: ri∈ yj−
w 2; yjþ
w 2
h i
n o
ð2Þ
The window size is an adjustable parameter; a 0.1-Mb size provided an adequate number of molecular bar-codes for resolving the structure and relationship of SV events. This step was conducted for each sample.
Step 3: identify SV-containing molecules
Using the barcodes and their associated reads that mapped to the SV window as described in step 2, we identified the intersecting sets of SV barcodes (Eq. 3):
S xð i;yiÞ ¼ B xð Þi ∩B yð Þi
S xj;yj
¼ B xj ∩B yj ð
3Þ
To identify an SV-containing molecule, the distance between SV breakpoints must be greater than what one would expect to see from the reference genome or rep-resent sequences from different chromosomes. As noted earlier, the aligned sequence data enable us to infer the general molecular size of each molecule per a given par-tition. We refer to this measurement as the mean mol-ecule length (Additional file 1: Table S3). To verify that the molecules were SV-specific, we performed the same steps using the matched normal linked read data. We expect to obtain few if any SV-specific molecules when using the normal linked read data, as the SV breakpoint regions are not contiguous to each other in the reference genome and therefore should have few if any shared mo-lecular barcodes.
Step 4: link/phase SV events
Here, we attempted to phase distinct SV events with re-spect to one another. We determined if a somatic SV event could be identified from an individual HMW mol-ecule. As noted previously, the molecular barcodes per a given sequence indicate a single droplet partition con-taining three to five molecules (Additional file 2: Figure S1). Thus, barcodes indicate both the identity and num-ber of DNA molecules within a specific partition. We used the SV-specific molecular barcodes to link different SV events that occurred on the same HMW DNA mol-ecule; this should allow us to link events that are within approximately 50 kb (the average size of a HMW DNA molecule) of one another. For this phasing step, we compared the SV-specific barcodes between each SV event to identify those that were the same (Eq. 4):
C vi;vj
¼ S xð i; yiÞ∩S xj; yj
ð4Þ
If we observed SV events with the same molecular barcodes, then this was evidence that these events were in cis and positioned in the same individual DNA molecule.
the phased SNVs reported in the Long Ranger VCF files, for both the matched normal and tumor samples. The phased variants of the normal sample were used to define the haplotype structure of the region surrounding each SV breakpoint (Eq. 5); then the phased variants of the tumor sample were used to obtain the supporting molecular bar-codes for each allele (Eq. 6):
SN V vð Þ ¼i snv s:t: snv∈ xi−
w 2; xiþ
w 2
h i
or
n
snv∈ yi−w 2; yiþ
w 2
h io ð5Þ
H1ð Þ ¼vi fbar pð Þf or p in SN V við Þs:t: hap bar pð ð ÞÞ ¼1g
H2ð Þ ¼vi fbar pð Þf or p in SN V við Þs:t: hap bar pð ð ÞÞ ¼2g
ð6Þ
To determine the phase of each SV event, we used the haplotype of the alleles that shared molecular barcodes with the SV-specific molecules (Eq. 7):
R1ð Þ ¼vi H1ð Þvi ∩S vð Þi
R2ð Þ ¼vi H2ð Þvi ∩S vð Þi ð7Þ
where S(vi) is the set of barcodes that corresponds to
S(xi,yi).
By assigning each SV event to a haplotype within a phase block, we determined the cis/trans relationship between the SV events, thus placing them in phase.
Allele-specific barcode counting from linked reads to determine SV haplotype
To determine the haplotype of an SV event, we per-formed allele-specific barcode counting [20]. For this, we used a custom Python script in combination with custom R scripts for graphic visualization. First, we used the VCF file of the normal sample to obtain the haplo-type assignment of all confidently phased SNVs within a specified region of interest. Our analyses consistently use the normal sample as the source of phasing informa-tion since its variants should be phased more accurately than those of the tumor sample. We obtained the num-ber of barcodes assigned to each allele of each phased variant from the matched tumor sample VCF files; thus, we obtained the allele-specific barcode counts. Plotting of these counts depicted whether one or both haplotypes was affected by copy number changes. If only one haplo-type was affected, then the identity of the haplohaplo-type could be determined.
SV-specific molecule mapping to resolve SV breakpoint structure
To resolve complex breakpoint structures, we relied on the mapping locations and molecular barcode identities of the linked read sequences, along with the SV-specific molecules for each SV event which were previously
determined in our phasing pipeline (Step 3 in Additional file 2: Figure S4). Here, we used a custom Python script to consider a 500-kb window around each SV breakpoint which was then divided into discrete 1-kb windows, i.e., 500 windows were considered for each breakpoint. Based on the linked read BAM file, we quantified the number of times each SV-specific molecular barcode oc-curred in each 1-kb window. The analysis of this output enabled identification of 1-kb windows where SV break-points occurred as those windows with sharp decreases in barcode number. We used a custom R script to plot the mapping locations of reads with each unique mo-lecular barcode, which provides a visualization of the HMW DNA molecule from which each barcode origi-nated. The plot indicates whether each HMW DNA molecule was assigned to haplotype 1 or haplotype 2, as per the assignment of its barcode identifier to SNV al-leles in haplotype 1 or haplotype 2.
De novo assembly of structural rearrangements
We sought to determine whether we could resolve and thus validate the rearranged structure by de novo assem-bly. We extracted all the sequence reads containing SV-specific barcodes from the linked read fastq files and then used these subset fastq files as input to the Supernova de novo assembly program to generate contig sequences [29]. This assembler has been recently demonstrated to gener-ate full diploid assemblies. We visualized the structures of the resulting contigs by plotting the mapping position of each SV-specific read in the genome versus its mapping position in the contig.
Gastric organoid cancer modeling in mice and functional analysis
Cdh1flox/flox;Trp53flox/flox mice were generated by
cross-ingCdh1flox/floxmice, obtained from Jackson Laboratory,
and Trp53flox/flox mice, kindly provided by Dr. Anton Berns [30]. NOD.Cg-PrkdcscidIl2rgtm1Sug/JicTac (NOG) mice were obtained from Taconic Biosciences, Inc. The Stanford University Administrative Panel on Laboratory Animal Care approved all animal experimental protocols. We dissected stomachs from neonatal mice (age P4–7) and washed them in cold PBS to remove all luminal con-tents. We extensively minced each entire neonatal stom-ach and embedded the minced tissues in a 3D collagen gel using a double-dish culture system as previously described [31]. To maintain the organoids, we applied fresh media (F12, 20% FBS, Gentamicin 50μg/mL) every week.
Biosciences). We determined the virus titer by infection of NIH/3T3 cells and FACS analysis of GFP-positive cells 48 h post-infection. We used the adenovirus AdCre-GFP and Ad-Fc to infect the organoid cultures at day 0 by applying directly to the surface of collagen containing primary tissue. Retroviral particles were in-cubated with pellets of dissociated primary organoids at room temperature for 45 minutes before serial replating into 3D collagen gel.
We fixed samples with 4% paraformaldehyde overnight, then paraffin-embedded and sectioned them. We stained deparaffinized sections with H&E for initial histology ana-lysis. For further immunohistochemistry analysis, we used antibodies for the following proteins: PCNA (1: 300; Invi-trogen), E-cadherin (1: 300; BD Biosciences Pharmagen), p53 (1: 100; Santa Cruz), and FGFR2 (1:300; Sigma).
Gastric cells were collected from collagen gel by disag-gregation with collagenase IV (Worthington). For trans-plantation, 400,000 cells per mouse flank were mixed with Matrigel (50% Matrigel, 10% FBS, 40% F12, 100 μl of Matrigel mixture for one mouse) and injected into NOG mice. Mice were sacrificed after day 50 and we dissected the tumors and examined tumor sections with H&E staining.Pvalues were determined using a two-tailed Student’s t-test assuming unequal variances. A p value of 0.05 was considered significant.
Results
As a proof-of-concept study, we applied linked read WGS with barcodes to the gastric tumors from an indi-vidual with recurrent metastatic cancer. These tumors came from a surgical resection of metastatic sites located in the right and left ovary (Additional file 2: Figure S2). Both metastases were present at the time of the surgical procedure. Histopathology confirmed that all three sites (i.e., right metastasis, left metastasis, and primary gastric tumor) were diffuse gastric cancer. This represents clin-ical confirmation that the metastases originated from the primary gastric tumor.
Linked read sequencing of gastric cancer metastases
Using genomic DNA from the two metastatic sites as well as the matched normal tissue, we performed linked read WGS (Additional file 2: Figure S1). In addition to linked read sequencing of the metastatic samples, we also conducted a conventional WGS analysis as an or-thogonal and completely independent validation dataset. The primary tumor tissue was an FFPE sample and thus the DNA quality was inadequate for linked read sequen-cing. However, conventional WGS was performed for this primary tumor sample (Additional file 1: Table S2).
The linked read method uses massively parallel parti-tioning of HMW DNA alongside droplet barcoding to create haplotypes of variants including SNVs and indels
[20]. The mean sequencing coverage achieved using linked read sequencing for the normal, right metastatic, and left metastatic samples was 36.0, 20.1, and 35.4, respectively (Additional file 1: Table S2). The largest molecule lengths and the longest phase blocks were obtained in the normal sample, where the mean molecule length was ~51 kb and the N50 phase block size was 1.4 Mb. In contrast, the smallest mean molecule length and N50 phase block size were achieved in the right metasta-sis, at 45 kb and 0.63 Mb, respectively. These results dem-onstrated that linked read sequencing provided long-range genomic contiguity on the scale of tens of kilobases, com-pared with conventional WGS. The N50 and molecule length differences were a result of variation in size of the DNA and the extent of fragmentation. This factor likely contributed to the greater proportion of SNVs phased in the normal sample (99%) compared with either tumor sample, where 98.2 and 98.9% of SNPs were phased in the right and left metastases, respectively (Additional file 1: Table S3).
Identification of cancer SVs from linked reads
From our linked read analysis, we identified a series of somatic SV events; seven SVs occurred in the right me-tastasis and 17 events occurred in the left meme-tastasis (Additional file 1: Table S4). The right metastasis harbored three deletions, one duplication, one inversion, one trans-location, and one nonspecific distal event. In contrast, the left metastasis harbored eight deletions, three duplications, two inversions, two translocations, and two distal events. Two deletion events and one translocation event were common to both metastatic tumors. The shared transloca-tion was an inter-chromosomal event between chromo-some 11q13.5 and 19p13.12, which putatively impacts the chromatin-remodeling geneRSF1located at chromosome 11q14.1. Previous studies have shown a correlation be-tween RSF1 upregulation and tumor aggressiveness in multiple cancer types [33, 34], potentially by causing chromosomal instability [35].
The chromosomal region harboringFGFR2was dupli-cated in both metastases. However, the SV analysis re-vealed that the breakpoints of the amplification event differed between the left and right site (Additional file 1: Table S4). Furthermore, additional SV events were de-tected in the region surrounding the FGFR2 amplifica-tion, with a series of unique breakpoints specific to each metastasis. This indicated that a potentially complex rearrangement had occurred in the FGFR2 locus, and suggested an independent occurrence of the somatic SVs between the two metastatic sites.
analysis of the conventional WGS data, we used both an SV caller and a CNV caller, Lumpy [28] and BICseq2, re-spectively. Lumpy identified 485 somatic SVs in the right metastasis, five of which were shared with the seven Long Ranger SV calls. Similarly, Lumpy identified 493 somatic SVs in the left metastasis, seven of which were shared with the 17 Long Ranger SV calls (Additional file 1: Tables S4 and S5). Long Ranger reported fewer SVs than LumPy be-cause Long Ranger specializes in detecting larger SV events (i.e., the smallest SV we detected with Long Ranger was ~30 kb). In addition, Long Ranger sets stringent filter-ing parameters such as ignorfilter-ing those SVs that occur within or near repetitive genomic regions. The vari-ation between Lumpy and Long Ranger is due to differ-ent algorithms, and it has previously been shown that there is generally very little overlap among the results of different SV callers [36].
We performed CNV segmentation on the conventional WGS data using BICseq2 (“Methods”). BICseq2 identi-fied 42 somatic CNVs in the right metastasis (29 amplifi-cations and 13 deletions). Only 16 somatic CNVs were detected by BICseq2 in the left metastasis (two amplifi-cations and 14 deletions; Additional file 1: Table S4; Additional file 2: Figure S5).
Identification ofFGFR2amplificationsin both metastatic samples
As described, our CNV and SV analyses detected an amplification of the region surrounding FGFR2 in both metastases; this result came from the orthogonal ana-lyses of the conventional and linked read WGS data. However, no amplification was detected in the primary tumor from the conventional WGS data. As added con-firmation of our copy number results, we used a highly sensitive ddPCR assay to assess theFGFR2 status of the primary tumor, ovarian metastases, and matched normal
gastric tissue. The ddPCR CNV assay detected the FGFR2 amplification in both metastases but not in the primary tumor or matched normal sample (Additional file 2: Figure S6). According to the ddPCR analysis, FGFR2 copy number (CN = ~9) was higher in the right metastasis compared with the left metastasis (CN = ~6), which is concordant with what was observed for the WGS CNV results.
FGFR2rearrangement structure in the metastases
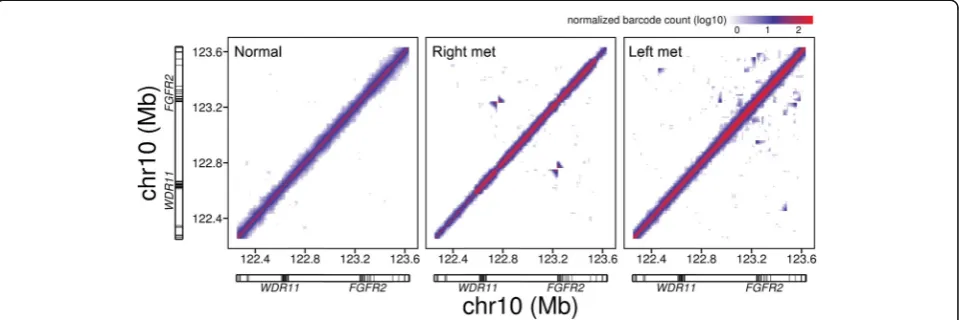
Many cancer amplifications are related to tandem dupli-cations. We used linked reads and molecular barcodes to determine the nature of the amplifications and the structures of the underlying duplications. With the linked read WGS data from each metastatic site, our analysis identified a number of unique SV events in the chromo-somal region from 10q23.31 to 10q26.13 that harbors the FGFR2 gene, a gastric cancer driver (Additional file 1: Tables S4 and S6). Moreover, the SV breakpoints in this region were unique to each metastasis, suggesting that rearrangement of this region had occurred independently. The complexity and differences among the samples for this chromosomal region are clearly displayed in plots of barcode overlap. Off-diagonal signals represented SV events (Fig. 1; Additional file 2: Figure S7). The patterns between the left and right metastasis are very distinct with little overlap.
As we previously reported, we demonstrated and vali-dated that one can generate cancer genome megabase-scale haplotypes from primary tumors and these haplotypes en-able one to reconstruct somatic SVs and rearrangements that extend over megabases [20]. We improved on this process for linking haplotypes and applied it to better characterize the rearrangement that led to theFGFR2gene amplification. First, we sought to determine the haplotypes encompassing the SV events. For each metastasis, this
analysis involved phasing the SV events and determining if the SVs were either incisor intranswith one another. This method takes advantage of the long-range barcode infor-mation and haplotype variants associated with the linked read data (“Methods”). Our method and related steps are outlined in Additional file 2: Figure S4.
In the right metastasis, we evaluated three SV events: a duplication, a deletion, and an inversion (Table 1; Additional file 1: Table S7). SV breakpoints were de-noted by a start and end position; we used this interval to define larger, 100-kb windows around each break-point from which to obtain molecular barcodes. The 100-kb windows around the start and end breakpoints of the duplication contained a total of 1315 and 1287 unique molecular barcodes derived from the linked reads, respectively. Of these “breakpoint-specific” bar-codes, 119 were shared between the breakpoints and thus represented the molecular barcodes of the SV-specific molecules of this event. Using this method, we also ob-tained 158 SV-specific molecules for the deletion event and 313 for the inversion event. The SV-specific barcodes and inferred molecules were used to phase SV events rela-tive to each other.
We determined whether any of the SV events occurred on the same DNA molecules, thus indicating that the in-dividual SVs were in cis. As described, we determined that the average molecule size was approximately 50 kb for these samples. For any pair of SVs to be in cis and also present in the same DNA molecule, we would an-ticipate that common barcodes would be present. We refer to this subset as molecule barcode overlaps and SV-specific molecules. In the case of the right metasta-sis, no molecules were shared between events, indicating that either the SV events were too distant from one an-other to be detected from the same HMW molecule (average size ~50 kb) or the SVs occurred intrans.
To phase SVs that were in genomic positions too far apart to be phased based on molecular barcode overlap, we relied on the haplotype information. First, we assigned each SV to a haplotype block based on overlap between SV-specific molecules and the phased heterozygous SNVs.
Both the SNVs and SVs are denoted by barcodes. Using both the barcode and haplotypes to which a given set of SNVs are assigned, one can identify those SV barcodes with a matching SNV barcode. These “overlapping” barcodes determine the haplotype block encompassing the SV.
In the case of the right metastasis, we extended our analysis to link distant haplotypes covering the start and end breakpoints of individual events. We denote these breakpoints as DUP (duplication), DEL (deletion), and INV (inversion) (Additional file 1: Table S7). Of the 119 SV-specific molecules for the duplication event, 92 could be assigned to one or the other haplotype using barcode comparisons; all of these molecules (92/92) were assigned to haplotype 1, and none were assigned to haplotype 2. The same trend was observed for all three SV events in this region of the right metastasis with all of them being assigned to haplotype 1. Thus, we con-cluded that all of these SV events were in cis with one another, existing on the same haplotype.
We performed this same SV phasing analysis for the left metastasis. For the FGFR2 locus, there were five discrete SV events: two duplications, two deletions, and an inversion (Table 2; Additional file 1: Table S7). One of the duplication events (DUP1) was identified by Lumpy but not by Long Ranger, and was included based on its occurrence within our region of interest, i.e., prox-imal toFGFR2. For each event, we were able to identify between 49 and 83 SV-specific barcodes. A duplication event (DUP2) and a deletion event (DEL1) shared 28 molecular barcodes, indicating 28 HMW DNA mole-cules spanned both of these events. These two events were in ciswith one another. The inversion event and a deletion event (DEL2) shared two SV-specific molecules, indicating a potentialcisrelationship between these SVs.
For the left metastasis, the other SV events did not occur on the same HMW DNA molecule due to either distance or a trans relationship; therefore, we assigned the SVs to haplotypes. All of the SV breakpoints oc-curred on one haplotype relative to one another. In all cases, the majority of the SV-specific molecules belonged
Table 1SV phasing results for SVs in the right metastasis in the region surroundingFGFR2
SV ID
SV breakpoints
Number of unique molecules in breakpoint window
SV breakpoint-spanning molecules
Somatic phase block coordinates
Number of molecules assigned to haplotype
Molecule support for haplotype assignment
Hap1 Hap2
DUP 92790689 1315 119 91045792–95201175
+
122189628–125868860
92 92 / 92 (1.0) 0 / 92 (0)
123553942 1287
DEL 93321593 1474 158 80 80 / 80 (1.0) 0 / 80 (0)
122582235 1582
INV 122756078 2081 313 201 200 / 201 (0.99) 1 / 201 (0.01)
to haplotype 1, indicating a cis relationship for all of these SV events. Interestingly, the inversion event showed relatively high identity with both haplotypes, with 37 from a total of 58 and 21 from a total 58 SV-specific molecules being assigned to haplotype 1 and haplotype 2, respectively, indicating that a rearrange-ment event at this genomic locus affected both haplo-types. Using this new approach, we assigned a haplotype to the duplication event that was not called by the Long Ranger software. This result indicates that our SV haplotyping method provides inferences that are not immediately observed with SV calling from linked read data.
Allele-specific barcode counts confirm the haplotype of the rearrangement
Our analysis of the WGS linked reads generated genome-wide phased heterozygous variants and bar-codes of all associated reads that have a variant allele assigned to a given haplotype. We leveraged these two major features to verify the haplotype segment covering the FGFR2 rearrangement. First, the barcode count for each allele of a variant provided allele-specific copy num-ber information. Second, each haplotype has one of two alleles for any given SNV position and the representation of each allele can be quantified based upon barcode counts. By using and comparing these two features, we determined the haplotype composition of the FGFR2 rearrangement. Comparing the tumor haplotypes to the germline haplotypes from the normal tissue, we were able to confidently assign common haplotypes.
To confirm thecis relationship of the duplication and deletion events in the right metastasis, we leveraged the barcode count data from all phased SNVs across the 90 to 126 Mb region of chromosome 10. These phased SNVs defined the haplotype blocks encompassing the
entirety of the genomic segment containing these SV events. Overall, the amplification consisted of a series of duplicated segments but also contained an internal dele-tion event. Based on examining the barcode informadele-tion by haplotype, we confirmed that these events both occur on the same copy of chromosome 10 (Fig. 2a). The al-leles from only one haplotype demonstrated an increase in barcode counts as shown in Fig. 2a. Haplotype 1, shown as black dots and the grey density plot on the side, showed a significant increase in barcode counts across the genome amplification segment compared to haplotype 2, shown as red dots and density plot. In com-parison, the normal diploid genome showed overlap of the allele barcode counts for either haplotype, as one would expect for a normal diploid genome.
For the left metastasis, the allele-specific barcode counts also supported the occurrence of two distinct du-plication events on the same haplotype (Additional file 2: Figure S8). It was evident that the barcodes of haplo-type 1 were preferentially elevated in the genomic region containing two distinct duplication events, but barcode counts were highest where the two events overlapped one another. Again, this evidence supported our conclusion that the duplication/amplification events were restricted to a single haplotype in this metastasis.
Comparative allele-specific barcode counting reveals a common rearranged haplotype
Given the distinctive structural differences between the two metastases at the FGFR2 locus, we determined whether both metastases had the same haplotype involved in theFGFR2amplification. As just described, our phasing analysis revealed that the SV events in the chromosomal region 10q23.31 to 10q26.13, encompassingFGFR2, were generally restricted to one haplotype in each metastasis. To conduct this comparison, we examined the FGFR2
Table 2SV phasing results for SVs in the left metastasis in the region surroundingFGFR2
SV ID SV breakpoints
Number of unique molecules in breakpoint window
SV breakpoint-spanning molecules
Number of molecules shared between SVs
Phase block coordinates
Number of molecules assigned to haplotype
Molecule support for haplotype assignment
Hap1 Hap2
DUP1 122465822 2176 49 0 122189628–125868860 42 41/42 (0.98) 1/42 (0.02)
123486940 3542
DUP2 122946842 3051 81 28 60 59/60 (0.98) 1/60 (0.02)
123782540 2588
DEL1 122959061 3198 73 21 21/21 (1.0) 0/21 (0)
123242792 4216
INV 123237230 4230 83 2 58 37/58 (0.64) 21/58 (0.36)
123563811 2635
DEL2 123555077 2721 71 63 58/63 (0.92) 5/63 (0.08)
locus from 10q23.31 to 10q26.13 and focused our analysis on the common segment where the amplification/du-plication was observed in both metastases. We made comparisons of both metastases’ haplotypes with the germline haplotype structure (e.g., same phased SNV genotypes) as determined from the normal tissue. As depicted in Fig. 2b, the allele-specific barcode counts showed that the same haplotype was amplified in both metastases (haplotype 1; Fig. 2b). As we noted, we made this haplotype assignment with high confidence
based on the specific genotypes assigned to haplotype 1 versus haplotype 2.
SV-specific molecule mapping to resolve SV breakpoint structure
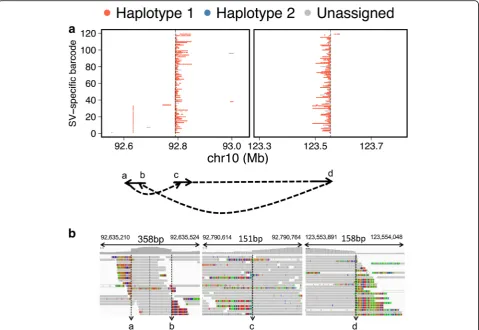
in the right metastasis. Our analysis indicated that the genomic region between breakpoint ‘c’ and breakpoint ‘d’ (Fig. 3a) was inverted and shifted such that break-point ‘d’ connected to breakpoint ‘b’, and breakpoint ‘a’ connected to breakpoint ‘c’. Thus, we were able to re-solve the breakpoint structure of the tandem duplication; this structure was supported by split-read and read-pair evidence from conventional WGS sequencing data (Fig. 3b). The same HMW molecule reconstruction was performed for the other SV events of the right metas-tasis. The deletion had a simple breakpoint structure with molecules spanning the junction (Additional file 2: Figure S9). In contrast, the inversion SV was more com-plex, with deletions at each of the inverted breakpoints (Additional file 2: Figure S10). Figure 4 provides a putative, complete structure for theFGRF2rearrangement charac-terized in the right metastasis. We illustrate how the dif-ferent component SVs such as the genomic deletions and inversion led to a common genomic motif that underwent duplication.
By mapping the breakpoint of the inversion event de-tected in the left metastasis, we observed that two dis-tinct rearrangement events occurred on each haplotype in close proximity to one another (Additional file 2: Figure S11). The inversion event identified by Long Ranger belonged to haplotype 1 only.
De novo local assembly of theFGFR2rearrangement
while contig 2 was ~150 kb and crossed the deletion and inversion breakpoints (Additional file 2: Figure S12). A comparison of where the SV-specific reads aligned to the contigs versus where they aligned to the genome revealed the structure of the contigs that supported our proposed putative rearrangement (Additional file 2: Figure S12). For the left metastasis, we used ~300,000 reads that fulfilled the SV criteria and the assembly re-vealed 53 contigs with an N50 of ~9 kb (Additional file 1: Table S8). The largest was 12 kb and aligned to the reference without evidence of breaks. Nine contigs aligned to multiple positions in the genome and only one of these had a contig size greater than the assembly N50 value. This contig incorporated the breakpoint of the SV represented as DUP2 (Table 2), thus providing additional validation of our analysis method.
FGFR2gain-of-function in gastric organoids leads to gastric cancer and metastasis
To functionally validate the potential role of FGFR2 in metastatic diffuse gastric cancer, we developed an in vitro gastric organoid culture system to model candidate driver combinations from the primary tumor and metastasis. Previously, we reported long-term in vitro primary intes-tinal organoid culture utilizing an air–liquid interface,
incorporating both epithelial and mesenchymal elements and preserving multilineage differentiation, intestinal stem cells, and the endogenous Wnt- and Notch-dependent stem cell niche [31, 37].
Using this approach, gastric organoids were estab-lished from neonatal murine tissue (Additional file 2: Figure S13a,b). After a 50-day maintenance period, the gastric organoids were checked for terminal, multilineage differentiation. This was confirmed by the presence of H +
/K+ATPase-positive and mucin-producing epithelial cells (Additional file 2: Figure S13c–e). Immunofluorescence for proliferating cell nuclear antigen (PCNA) identified ac-tive mitosis (Additional file 2: Figure S13g). The gastric organoids were genetically tractable and easily engineered by adenovirus or retroviral infection (Additional file 2: Figure S13i, j).
Since the patient’s metastatic tumors harbored CDH1 and TP53 mutations, primary gastric organoids were established from Cdh1fl/fl, Trp53 fl/fl neonatal mouse stomach. These gastric organoids were infected with adenovirus Cre-GFP to induce recombination and dele-tion ofCdh1andTrp53, thus modeling the key driver al-terations common to both the primary and metastatic tumors. The genomic deletion of Cdh1 and Trp53 was confirmed by PCR.
To model the effect of theFGFR2 amplification event in the two ovarian metastases, the Cdh1-/-;Trp53 -/-gastric organoids were further infected with anFGFR2 human retrovirus. We confirmed the FGFR2 receptor overexpression by immunofluorescence (Additional file 2: Figure S14a). Gastric organoids with theCdh1 -/-;Trp53-/-; FGFR2 cDNA demonstrated large, irregular nuclei and occasional signet rings consistent with the histological features of DGC (Additional file 2: Figure S14b).
The transformed Cdh1-/-;Trp53-/-;FGFR2 cDNA orga-noids were disaggregated and injected subcutaneously into the flanks of immunodeficient NOG mice. The Cdh1-/-;Trp53-/-;FGFR2 organoid xenografts showed rapid development of primary gastric tumors (Fig. 5a, b). In stark contrast,Cdh1-/-;Trp53-/-mice had no apparent tumors by day 50 (Fig. 5a, b). Gastric organoids with Cdh1-/-;Trp53-/-;FGFR2 cDNA exhibited a poorly differ-entiated adenocarcinoma histology with signet ring fea-tures (Fig. 5d, e). Immunofluorescence analysis showed loss of Cdh1 expression and the specific overexpression of FGFR2 in respective subcutaneous organoid tumors transformed with FGFR2 retrovirus (Fig. 5c). Evaluation
for distant disease confirmed the presence of pulmonary metastases in the lungs of NOG mice harboring sub-cutaneous Cdh1-/-;Trp53-/-;FGFR2 tumors. Similar to primary subcutaneous tumors, histological analysis of the metastatic tumors confirmed poorly differentiated adenocarcinoma with signet ring features (Fig. 5f, g).
Discussion
Determining the structure of cancer rearrangements remains a difficult task. Short-read, conventional WGS remains the most widely used method for identifying somatic rearrangements in tumors but results are far from perfect and complete resolution of complex gen-omic structures is near impossible for large events, due to insufficient read coverage at breakpoints and loss of long-range genomic contiguity. For this study, we suc-cessfully applied a novel sequencing approach that gen-erates linked read sequences with barcodes to analyze metastatic diffuse gastric tumors obtained from surgical resections.
This sequencing technology addresses many of the challenges associated with SV detection and resolution. Linked read sequencing retains long-range genomic
Fig. 5Gastric organoid tumor model. Gastric organoids with the indicated genotypes are shown.aTumor volumes were measured over time post-injection. Gastric organoids were dissociated and subcutaneously injected into the flanks of NOG mice.Cdh1-/-;Trp53-/-is shown inblue, and Cdh1-/-;Trp53-/-;FGFR2is shown inred. Error barsrepresent SEM, and asterisks indicatep< 0.04.bImages indicate tumor growth at 50 days
information by enabling sequence reads to be derived from HMW DNA molecules, on the order of 50 kb, with-out the loss of long-range contiguity due to fragmentation during library preparation. Given that genomic contiguity is maintained, we applied this technology to detect SVs. Moreover, we developed a method that leverages barcoded reads to phase SVs relative to one another (i.e., determine cis/transrelationships between SVs) and to resolve com-plex breakpoints from primary tumor samples obtained by surgical resection as opposed to cancer cell lines.
To demonstrate the utility of this approach for sequen-cing cancer genomes from tissue samples (as opposed to cancer cell lines), we analyzed two synchronously occur-ring metastatic diffuse gastric cancers that were present in the same individual. This type of gastric carcinoma has a worse prognosis compared to the other molecular sub-types and extremely restricted treatment options [38, 39]. Patients with diffuse gastric cancer invariably succumb to tumor metastasis. Despite its lethality, we know very little about the underlying genetics and biology of DGC meta-static progression—our results indicate that metameta-static drivers may be absent in the primary tumor [40]. In addition, our study is unique given that there are few if any genomic or WGS results from DGC metastases [41].
Using this new sequencing approach, we identified a complex rearrangement of the FGFR2 locus, located on the q arm of chromosome 10. In both metastases, these SV events resulted in amplification of FGFR2, as re-ported by barcode counts from linked read sequencing and CNV calling from conventional WGS data. FGFR2 is a transmembrane receptor that acts as part of a key signal transduction pathway regulating tissue repair and embryonic development among a host of other functions [42]. FGFR2 amplification occurs in 5–10% of gastric cancers, with an association to poor diagnosis and tumor metastasis [43, 44]. Preclinical models have shown that FGFR2 signaling activation due to FGFR2 amplification is an essential driver for a subset of gastric cancers [45, 46]. In addition, treatment of gastric cell lines with FGFR2-specific small molecule inhibitors or short hair-pin RNAs (shRNAs) leads to potent growth inhibition [47], suggesting a functional role for FGFR2 amplifica-tion in DGC.
Interestingly,FGFR2amplification was not observed in the primary tumor sample of our study patient, and the SV breakpoints of theFGFR2region rearrangement were unique in the right and left metastases. This suggested that amplification of FGFR2 occurred independently in each metastasis, underscoring a potential association of FGFR2 amplification to metastasis in DGC. Leveraging the long-range genomic information using the molecular barcodes from linked reads, we determined the identity of the HMW DNA molecules and used this information to resolve how the various somatic SVs contributed to a
tandem duplication that increased the FGFR2 copy number. The putative structure for the rearranged re-gion in the right metastasis included a 30-Mb deletion, an inversion with deletions at each of its breakpoints, a subsequent inversion with an associated deletion, and finally a tandem duplication. This structure would have been extremely difficult to resolve, with much less support-ing evidence, without the long-range barcode information of linked read sequencing.
We were able to validate the putative rearrangement structure of the FGFR2 region using de novo assembly to generate long contiguous sequences (Additional file 2: Figure S12). Other useful validation approaches could include long-read sequencing (e.g., Pacific Biosciences, Oxford Nanopore) or optical mapping (e.g., BioNano). However, we did not perform these technologies within the scope of this study, in part due to the high sample input requirements, the higher error rates that may affect SNVs used in haplotyping analysis, the require-ment for greater sequencing coverage given the low tumor fraction, and the higher sequencing cost for whole genome analyses (Additional file 1: Table S1).
We provided additional results supporting the potential role ofFGFR2as an oncogenic driver in DGC. The results from an in vitro organoid mouse model demonstrated that Cdh1-/-; Trp53-/- organoids did not form tumors when injected into NOG mice, whileCdh1-/-;Trp53-/-organoids with FGFR2 overexpression did promote tumor growth (Fig. 5). What’s more, the organoid-derived tumors with FGFR2 overexpression had histologic features of gastric cancer and caused metastases to the lung.
Conclusions
As genomic analysis plays an increasingly prominent role in advanced cancer patients, the addition of linked read analyses promises to overcome the constraints of conven-tional next-generation sequencing in detecting clinically actionable SVs, thereby providing a more complete picture of the treatments available for patients with refractory malignancies.
Additional files
Additional file 1: Supplemental Tables.Table S1. Platform comparison.Table S2.Alignment metrics.Table S3.Summary metrics for linked read WGS.Table S4.Long Ranger SV results.Table S5LumPy SV summary.Table S6.CNV results.Table S7.SV phasing results for both metastatic sites.Table S8.De novo assembly statistics for both metastatic sites. (XLSX 50 kb)
Allele-specific barcode counts inFGFR2region of left metastasis.Figure S9.Complex breakpoint resolution for deletion using molecular barcode mapping.Figure S10.Complex breakpoint resolution for inversion using molecular barcode mapping.Figure S11.Complex breakpoint resolution for inversion in the left metastasis using molecular barcode mapping.Figure S12.De novo assembled contigs reconstruct rearrangement breakpoints in the right metastasis.Figure S13.In vitro gastric organoid model.Figure S14.ExogenousFGFR2expression in gastric organoids. (PDF 19353 kb)
Additional file 3:Frequently altered genes in TCGA gastric samples. (CSV 101 kb)
Abbreviations
CNV:Copy number variant; ddPCR: Droplet digital PCR; DGC: Diffuse gastric cancer; FFPE: Formalin-fixed paraffin-embedded;FGFR2: Fibroblast growth factor receptor 2; HMW: High molecular weight; Indel: Insertion/deletion; SNV: Single nucleotide variant; SV: Structural variant; TCGA: The Cancer Genome Atlas; WGS: Whole genome sequencing
Acknowledgements
We thank Deanna Church and Li Xia for helpful comments regarding the analysis. We thank Michael DiMaio for pathology review.
Funding
SUG, JC, and HPJ were supported by a Research Scholar Grant, RSG-13-297-01-TBG from the American Cancer Society. HPJ received additional support from the Doris Duke Charitable Foundation Clinical Scientist Development Award and a Howard Hughes Medical Institute Early Career Grant. We also ac-knowledge support from National Institutes of Health Grants Digestive Dis-ease Center DK56339 (HPJ), P01 HG000205 (HPJ), NCI Innovative Molecular Analysis Technology 1R33CA1745701 (LN and HPJ), NHGRI R01 HG006137 (HPJ), NCI Cancer Target and Discovery Consortium U01CA17629901 (CJK and HPJ) and K08 CA166512 (LN). LN received additional support from an American Society for Clinical Oncology Young Investigator Award. Support also came from the Gastric Cancer Foundation (HPJ and JMF).
Availability of data and material
The datasets generated for this study are available in the National Institute of Health’s dbGAP repository, accession number phs001362.v1.p1. The custom scripts used to process the data are available on GitHub (https://github.com/ sgreer77/sv-phasing_linkedreads).
Authors’contributions
BTL, JC, and CMW conducted the sequencing assays and molecular validation. SUG, BTL, and HPJ analyzed the sequencing data and genetic analysis. LDN conducted the cell line and organoid experiments. LDN and CJK developed the organoid system. JMF and HPJ developed the translational portion of the study. SUG, JC, and HPJ wrote the manuscript. HPJ designed, supervised, and coordinated all aspects of the research. All authors revised, read, and approved the final manuscript.
Competing interests
The authors declare that they have no competing interests.
Consent for publication
Informed consent was obtained for the study.
Ethics approval and consent to participate
This study was conducted in compliance with the Helsinki Declaration. The institutional review board (IRB) at Stanford University School of Medicine approved the study protocol (19071). All procedures involving animals were approved by the Stanford University Administrative Panel on Laboratory Animal Care and were fully compliant with the USDA Animal Welfare Act, and our Assurance of Compliance with the PHS Policy on Human Care and Use of Laboratory Animals.
Publisher’s Note
Springer Nature remains neutral with regard to jurisdictional claims in published maps and institutional affiliations.
Author details
1Division of Oncology, Department of Medicine, Stanford University School
of Medicine, CCSR 1115, 269 Campus Drive, Stanford, CA 94305-5151, USA.
2
Medical Oncology, Intermountain Healthcare, St. George, UT 84770, USA.
3Stanford Genome Technology Center, Stanford University, Palo Alto, CA
94304, USA.4Division of Hematology, Department of Medicine, Stanford
University School of Medicine, Stanford, CA 94305, USA.
Received: 20 February 2017 Accepted: 7 June 2017
References
1. Sudmant PH, Rausch T, Gardner EJ, Handsaker RE, Abyzov A, Huddleston J, Zhang Y, Ye K, Jun G, Hsi-Yang Fritz M, et al. An integrated map of structural variation in 2,504 human genomes. Nature. 2015;526:75–81. 2. Weischenfeldt J, Symmons O, Spitz F, Korbel JO. Phenotypic impact of
genomic structural variation: insights from and for human disease. Nat Rev Genet. 2013;14:125–38.
3. Yang L, Luquette LJ, Gehlenborg N, Xi R, Haseley PS, Hsieh CH, Zhang C, Ren X, Protopopov A, Chin L, et al. Diverse mechanisms of somatic structural variations in human cancer genomes. Cell. 2013;153:919–29. 4. Rowley JD. Letter: A new consistent chromosomal abnormality in chronic
myelogenous leukaemia identified by quinacrine fluorescence and Giemsa staining. Nature. 1973;243:290–3.
5. Nowell PC, Hungerford DA. Chromosome studies on normal and leukemic human leukocytes. J Natl Cancer Inst. 1960;25:85–109.
6. Gasi Tandefelt D, Boormans J, Hermans K, Trapman J. ETS fusion genes in prostate cancer. Endocr Relat Cancer. 2014;21:R143–52.
7. Parker BC, Annala MJ, Cogdell DE, Granberg KJ, Sun Y, Ji P, Li X, Gumin J, Zheng H, Hu L, et al. The tumorigenic FGFR3-TACC3 gene fusion escapes miR-99a regulation in glioblastoma. J Clin Invest. 2013;123:855–65. 8. Williams SV, Hurst CD, Knowles MA. Oncogenic FGFR3 gene fusions in
bladder cancer. Hum Mol Genet. 2013;22:795–803.
9. Soda M, Choi YL, Enomoto M, Takada S, Yamashita Y, Ishikawa S, Fujiwara S, Watanabe H, Kurashina K, Hatanaka H, et al. Identification of the
transforming EML4-ALK fusion gene in non-small-cell lung cancer. Nature. 2007;448:561–6.
10. Negrini S, Gorgoulis VG, Halazonetis TD. Genomic instability–an evolving hallmark of cancer. Nat Rev Mol Cell Biol. 2010;11:220–8.
11. Quinlan AR, Hall IM. Characterizing complex structural variation in germline and somatic genomes. Trends Genet. 2012;28:43–53.
12. Stephens PJ, Greenman CD, Fu B, Yang F, Bignell GR, Mudie LJ, Pleasance ED, Lau KW, Beare D, Stebbings LA, et al. Massive genomic rearrangement acquired in a single catastrophic event during cancer development. Cell. 2011;144:27–40.
13. Aran D, Sirota M, Butte AJ. Systematic pan-cancer analysis of tumour purity. Nat Commun. 2015;6:8971.
14. Liu BA, Conroy JM, Morrison CD, Odunsi AO, Qin MC, Wei L, Trump DL, Johnson CS, Liu S, Wang JM. Structural variation discovery in the cancer genome using next generation sequencing: computational solutions and perspectives. Oncotarget. 2015;6:5477–89.
15. Asmann YW, Necela BM, Kalari KR, Hossain A, Baker TR, Carr JM, Davis C, Getz JE, Hostetter G, Li X, et al. Detection of redundant fusion transcripts as biomarkers or disease- specific therapeutic targets in breast cancer. Cancer Res. 2012;72:1921–8.
16. Maher CA, Kumar-Sinha C, Cao X, Kalyana-Sundaram S, Han B, Jing X, Sam L, Barrette T, Palanisamy N, Chinnaiyan AM. Transcriptome sequencing to detect gene fusions in cancer. Nature. 2009;458:97–101.
17. Chen X, Schulz-Trieglaff O, Shaw R, Barnes B, Schlesinger F, Kallberg M, Cox AJ, Kruglyak S, Saunders CT. Manta: rapid detection of structural variants and indels for germline and cancer sequencing applications. Bioinformatics. 2016;32:1220–2.
18. Tattini L, D’Aurizio R, Magi A. Detection of genomic structural variants from next-generation sequencing data. Front Bioeng Biotechnol. 2015;3:92. 19. Abel HJ, Duncavage EJ. Detection of structural DNA variation from next
generation sequencing data: a review of informatic approaches. Cancer Genet. 2013;206:432–40.
21. Ferlay JSI, Ervik M, Dikshit R, Eser S, Mathers C, Rebelo M, Parkin DM, Forman D, Bray F. GLOBOCAN 2012 v1.0 Cancer incidence and mortality worldwide: IARC CancerBase No. 11. Lyon, France: International Agency for Research on Cancer; 2013.
22. Cancer Genome Atlas Research. Comprehensive molecular characterization of gastric adenocarcinoma. Nature. 2014;513:202–9.
23. Li H, Durbin R. Fast and accurate long-read alignment with Burrows-Wheeler transform. Bioinformatics. 2010;26:589–95.
24. McKenna A, Hanna M, Banks E, Sivachenko A, Cibulskis K, Kernytsky A, Garimella K, Altshuler D, Gabriel S, Daly M, DePristo MA. The Genome Analysis Toolkit: a MapReduce framework for analyzing next-generation DNA sequencing data. Genome Res. 2010;20:1297–303.
25. Quinlan AR, Hall IM. BEDTools: a flexible suite of utilities for comparing genomic features. Bioinformatics. 2010;26:841–2.
26. Xi RB, Lee S, Xia YC, Kim TM, Park PJ. Copy number analysis of whole-genome data using BIC-seq2 and its application to detection of cancer susceptibility variants. Nucleic Acids Res. 2016;44:6274–86.
27. Xi R, Hadjipanayis AG, Luquette LJ, Kim TM, Lee E, Zhang J, Johnson MD, Muzny DM, Wheeler DA, Gibbs RA, et al. Copy number variation detection in whole-genome sequencing data using the Bayesian information criterion. Proc Natl Acad Sci U S A. 2011;108:E1128–36.
28. Layer RM, Chiang C, Quinlan AR, Hall IM. LUMPY: a probabilistic framework for structural variant discovery. Genome Biol. 2014;15:R84.
29. Weisenfeld NI, Kumar V, Shah P, Church DM, Jaffe DB. Direct determination of diploid genome sequences. Genome Res. 2017;27:757–67.
30. Meuwissen R, Linn SC, Linnoila RI, Zevenhoven J, Mooi WJ, Berns A. Induction of small cell lung cancer by somatic inactivation of both Trp53 and Rb1 in a conditional mouse model. Cancer Cell. 2003;4:181–9. 31. Ootani A, Li X, Sangiorgi E, Ho QT, Ueno H, Toda S, Sugihara H, Fujimoto K,
Weissman IL, Capecchi MR, Kuo CJ. Sustained in vitro intestinal epithelial culture within a Wnt-dependent stem cell niche. Nat Med. 2009;15:701–6. 32. Cha JY, Maddileti S, Mitin N, Harden TK, Der CJ. Aberrant receptor
internalization and enhanced FRS2-dependent signaling contribute to the transforming activity of the fibroblast growth factor receptor 2 IIIb C3 isoform. J Biol Chem. 2009;284:6227–40.
33. Liu S, Dong Q, Wang E. Rsf-1 overexpression correlates with poor prognosis and cell proliferation in colon cancer. Tumour Biol. 2012;33:1485–91. 34. Fang FM, Li CF, Huang HY, Lai MT, Chen CM, Chiu IW, Wang TL, Tsai FJ, Shih
Ie M, Sheu JJ. Overexpression of a chromatin remodeling factor, RSF-1/ HBXAP, correlates with aggressive oral squamous cell carcinoma. Am J Pathol. 2011;178:2407–15.
35. Sheu JJ, Guan B, Choi JH, Lin A, Lee CH, Hsiao YT, Wang TL, Tsai FJ, Shih IM. Rsf-1, a chromatin remodeling protein, induces DNA damage and promotes genomic instability. J Biol Chem. 2010;285:38260–9.
36. Guan P, Sung WK. Structural variation detection using next-generation sequencing data: A comparative technical review. Methods. 2016;102:36–49. 37. Li X, Nadauld L, Ootani A, Corney DC, Pai RK, Gevaert O, Cantrell MA, Rack PG,
Neal JT, Chan CW, et al. Oncogenic transformation of diverse gastrointestinal tissues in primary organoid culture. Nat Med. 2014;20:769–77.
38. Cunningham D, Allum WH, Stenning SP, Thompson JN, Van de Velde CJ, Nicolson M, Scarffe JH, Lofts FJ, Falk SJ, Iveson TJ, et al. Perioperative chemotherapy versus surgery alone for resectable gastroesophageal cancer. N Engl J Med. 2006;355:11–20.
39. Lim L, Michael M, Mann GB, Leong T. Adjuvant therapy in gastric cancer. J Clin Oncol. 2005;23:6220–32.
40. Yates LR, Campbell PJ. Evolution of the cancer genome. Nat Rev Genet. 2012;13:795–806.
41. Nadauld LD, Garcia S, Natsoulis G, Bell JM, Miotke L, Hopmans ES, Xu H, Pai RK, Palm C, Regan JF, et al. Metastatic tumor evolution and organoid modeling implicate TGFBR2 as a cancer driver in diffuse gastric cancer. Genome Biol. 2014;15:428.
42. Katoh Y, Katoh M. FGFR2-related pathogenesis and FGFR2-targeted therapeutics (Review). Int J Mol Med. 2009;23:307–11.
43. Su X, Zhan P, Gavine PR, Morgan S, Womack C, Ni X, Shen D, Bang YJ, Im SA, Ho Kim W, et al. FGFR2 amplification has prognostic significance in gastric cancer: results from a large international multicentre study. Br J Cancer. 2014;110:967–75. 44. Turner N, Grose R. Fibroblast growth factor signalling: from development to
cancer. Nat Rev Cancer. 2010;10:116–29.
45. Xie L, Su X, Zhang L, Yin X, Tang L, Zhang X, Xu Y, Gao Z, Liu K, Zhou M, et al. FGFR2 gene amplification in gastric cancer predicts sensitivity to the selective FGFR inhibitor AZD4547. Clin Cancer Res. 2013;19:2572–83.
46. Zhao WM, Wang L, Park H, Chhim S, Tanphanich M, Yashiro M, Kim KJ. Monoclonal antibodies to fibroblast growth factor receptor 2 effectively inhibit growth of gastric tumor xenografts. Clin Cancer Res. 2010;16:5750–8. 47. Kunii K, Davis L, Gorenstein J, Hatch H, Yashiro M, Di Bacco A, Elbi C,
Lutterbach B. FGFR2-amplified gastric cancer cell lines require FGFR2 and Erbb3 signaling for growth and survival. Cancer Res. 2008;68:2340–8.
• We accept pre-submission inquiries
• Our selector tool helps you to find the most relevant journal
• We provide round the clock customer support
• Convenient online submission
• Thorough peer review
• Inclusion in PubMed and all major indexing services • Maximum visibility for your research
Submit your manuscript at www.biomedcentral.com/submit