The Cryosphere, 7, 1399–1410, 2013 www.the-cryosphere.net/7/1399/2013/ doi:10.5194/tc-7-1399-2013
© Author(s) 2013. CC Attribution 3.0 License.
EGU Journal Logos (RGB)
Advances in
Geosciences
Open Access
Natural Hazards
and Earth System
Sciences
Open AccessAnnales
Geophysicae
Open AccessNonlinear Processes
in Geophysics
Open AccessAtmospheric
Chemistry
and Physics
Open AccessAtmospheric
Chemistry
and Physics
Open Access DiscussionsAtmospheric
Measurement
Techniques
Open AccessAtmospheric
Measurement
Techniques
Open Access DiscussionsBiogeosciences
Open Access Open Access
Biogeosciences
Discussions
Climate
of the Past
Open Access Open Access
Climate
of the Past
Discussions
Earth System
Dynamics
Open Access Open Access
Earth System
Dynamics
DiscussionsGeoscientific
Instrumentation
Methods and
Data Systems
Open Access
Geoscientific
Instrumentation
Methods and
Data Systems
Open Access DiscussionsGeoscientific
Model Development
Open Access Open Access
Geoscientific
Model Development
DiscussionsHydrology and
Earth System
Sciences
Open AccessHydrology and
Earth System
Sciences
Open Access DiscussionsOcean Science
Open Access Open Access
Ocean Science
DiscussionsSolid Earth
Open Access Open Access
Solid Earth
DiscussionsThe Cryosphere
Open Access Open Access
The Cryosphere
Discussions
Natural Hazards
and Earth System
Sciences
Open Access
Discussions
Snow on the Ross Ice Shelf: comparison of reanalyses and
observations from automatic weather stations
L. Cohen1and S. Dean2
1Antarctic Research Centre, Victoria University, Wellington, New Zealand 2National Institute of Water and Atmospheric Research, Wellington, New Zealand
Correspondence to: L. Cohen (lana.cohen@vuw.ac.nz)
Received: 1 March 2013 – Published in The Cryosphere Discuss.: 25 March 2013 Revised: 8 July 2013 – Accepted: 5 August 2013 – Published: 16 September 2013
Abstract. Snow accumulation measurements from auto-matic weather stations (AWS) around the Ross Ice Shelf (RIS), Antarctica, are used to provide a new set of ground-based observations which are compared to precipitation from the ECMWF ERA-Interim and NCEP/NCAR Reanalysis-2 datasets. The high temporal resolution of the AWS snow ac-cumulation measurements allow for an event-based compar-ison of reanalyses precipitation to the in situ observations. Snow accumulation records from nine AWS provide multi-ple years of accumulation data between 2008 and 2012 over a relatively large, homogeneous region of Antarctica, and also provide the basis for a statistical evaluation of accu-mulation and precipitation events. The complex effects of wind on snow accumulation (which can both limit and en-hance accumulation) complicate the use of the accumulation measurements, but this analysis shows that they can provide a valuable source of ground-based observations for compar-isons to modelled precipitation on synoptic timescales. The analysis shows that ERA-Interim reproduces more precipi-tation events than NCEP-2, and these events correspond to an average 8.2 % more precipitation. Significant correlations between reanalyses and AWS event sizes are seen at several stations and show that ERA-Interim consistently produces larger precipitation events than NCEP-2.
1 Introduction
Knowledge of the spatial and temporal variability of precip-itation and snow accumulation in Antarctica is essential for further understanding of Antarctic mass balance, ice core in-terpretation, and atmospheric circulation changes. Because
of the sparseness of in situ and satellite measurements in Antarctica, atmospheric reanalyses products are a key tool for studying precipitation in Antarctica (e.g. Monaghan et al., 2006; Krinner et al., 2007; Marshall, 2009; Bromwich et al., 2012). The European Centre for Medium-Range Weather Forecasts (ECMWF) ERA-Interim and National Centers for Environmental Predication/National Center for Atmospheric Research (NCEP/NCAR) Reanalysis-2 datasets are the most easily accessible and provide data over the longest time pe-riod (1979–present for the polar regions), and they are there-fore widely used in climatological and meteorological stud-ies of Antarctica. Understanding how well precipitation is represented by these reanalyses products (and other numer-ical weather prediction (NWP) models) is difficult to ascer-tain because of the difficulty in making precipitation mea-surements and the sparseness of these meamea-surements in the high latitudes.
for verification of NWP modelled precipitation (e.g. Lu et al., 2010) indicate that there is still a considerable need for in situ precipitation observations.
Understanding how well reanalyses precipitation is rep-resented on synoptic scales is of interest primarily for ice core interpretation and atmospheric circulation change stud-ies (e.g. Simmonds et al., 2003; Helsen et al., 2007; Thomas and Bracegirdle, 2009; Sinclair et al., 2010; Fogt et al., 2012). Synoptic-scale systems drive much of the temporal and spatial variability of precipitation in Antarctica, and un-derstanding how that variability affects climate proxies in ice cores is very important (Noone and Simmonds, 2002). The Ross and Amundsen seas in particular are regions of signif-icant synoptic-scale cyclone activity in the Southern Ocean which are the source of most of the precipitation on the Ross Ice Shelf and West Antarctic Ice Sheet (King and Turner, 1997; Simmonds et al., 2003). The synoptic variability of these regions are of interest and the source of ongoing re-search as they are known to be influenced by large-scale at-mospheric circulation changes such as the Southern Annu-lar Mode and El Ni˜no–Southern Oscillation (Cullather et al., 1996; Fogt and Bromwich, 2006; Fogt et al., 2012; Cohen et al., 2013).
Snow accumulation measurements from the University of Wisconsin Antarctic Meteorological Research Center (UW-AMRC) network of unmanned automatic weather sta-tions (AWS) provide a source of in situ observasta-tions which may be used to assess reanalyses precipitation on syn-optic scales. This study compares accumulation measure-ments from the Ross Ice Shelf, Antarctica, to individual precipitation events from the ECMWF ERA-Interim and NCEP/NCAR Reanalysis-2 datasets. The stations provide measurements of snow accumulation via changes in snow height as well as the standard suite of meteorological pa-rameters (temperature, pressure, relative humidity, and wind speed and direction) (Lazzara et al., 2012). Snow height changes are measured with acoustic depth gauge (ADG) in-struments which measure the amount of snow accumula-tion and exact timing of accumulaaccumula-tion events. ADGs have been widely used in Antarctic studies to characterize precip-itation and surface mass balance on sub-annual timescales (e.g. Braaten, 1997, 2000; Qin et al., 2004; Eisen et al., 2008; Reijmer and Van den Broeke, 2003; Thiery et al., 2012) and in climate proxy studies to investigate the synoptic origins of individual accumulation events (e.g. Reijmer et al., 2002; Helsen et al., 2007).
As snow accumulation records are a proxy for precipita-tion, using them to compare to precipitation is not straight-forward. The ADG measurements on the Ross Ice Shelf pro-vide a new dataset of high temporal resolution, ground-based accumulation observations which may provide an important source of measurements to assess modelled precipitation on synoptic timescales.
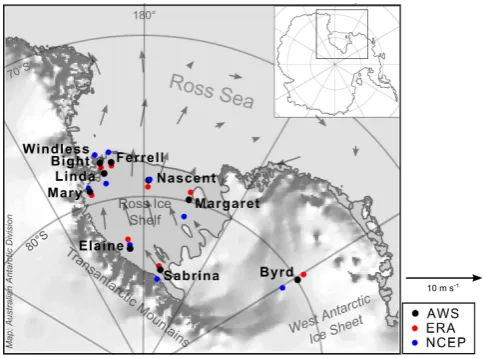
Fig. 1. Locations of the automatic weather stations (AWS) used in this study and corresponding grid point locations for ERA-Interim (red) and NCEP-2 (blue) reanalyses. Wind vectors show the clima-tological surface wind regime (850 hPa) over the RIS and Ross Sea (from ERA-Interim monthly data averaged over 2008–2012).
2 Site description and snow accumulation data
Figure 1 shows the locations of the nine UW-AMRC AWS snow height measurements used in this study and the near-est ERA-Interim and NCEP-2 grid points. The eight stations on the Ross Ice Shelf (RIS) provide a relatively dense net-work of stations in a geographically constrained area. We also use data from a station located on the West Antarctic Ice Sheet (WAIS) because of its proximity to the RIS and the significance of the WAIS for mass balance and ice core inter-pretation. The snow height change measurements are avail-able for varying time periods between January 2008 and Au-gust 2012. Though there are some measurements prior to 2008, continuous, year-round snow accumulation measure-ments have only been available since 2008. All of the stations except for Linda and Byrd have over two years of continuous accumulation measurements, with Windless Bight having the longest record of 4.5 yr. Each station’s length of record, loca-tion, and distances to nearest reanalyses grid points are sum-marized in Table 1.
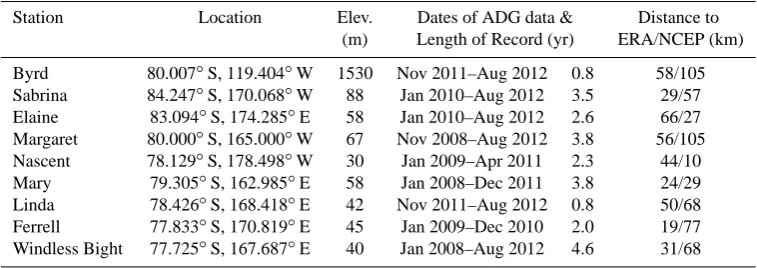
Table 1. AWS locations, elevations, dates and lengths of ADG records, and distances to nearest ERA-Interim and NCEP-2 grid points.
Station Location Elev. Dates of ADG data & Distance to (m) Length of Record (yr) ERA/NCEP (km)
Byrd 80.007◦S, 119.404◦W 1530 Nov 2011–Aug 2012 0.8 58/105 Sabrina 84.247◦S, 170.068◦W 88 Jan 2010–Aug 2012 3.5 29/57 Elaine 83.094◦S, 174.285◦E 58 Jan 2010–Aug 2012 2.6 66/27 Margaret 80.000◦S, 165.000◦W 67 Nov 2008–Aug 2012 3.8 56/105 Nascent 78.129◦S, 178.498◦W 30 Jan 2009–Apr 2011 2.3 44/10 Mary 79.305◦S, 162.985◦E 58 Jan 2008–Dec 2011 3.8 24/29 Linda 78.426◦S, 168.418◦E 42 Nov 2011–Aug 2012 0.8 50/68 Ferrell 77.833◦S, 170.819◦E 45 Jan 2009–Dec 2010 2.0 19/77 Windless Bight 77.725◦S, 167.687◦E 40 Jan 2008–Aug 2012 4.6 31/68
RIS (King and Turner, 1997; Parish et al., 2006). The sur-face wind regime is also influenced by synoptic-scale and mesoscale cyclones, which enhance and provide forcing for katabatic and barrier wind regimes (King and Turner, 1997). Figure 1 shows the climatological near-surface (850 hPa) winds on the Ross Ice Shelf (from the ERA-Interim reanaly-sis data), which illustrates the varying wind conditions ex-perienced at different stations. Most of the AWS are lo-cated in katabatic outflow paths (Mary, Linda, Elaine, Fer-rell, Nascent, and Byrd) and barrier wind regimes (Sabrina), and as a result these sites experience strong winds more often than the other sites (Braaten, 1997; Parish et al., 2006; Knuth et al., 2010; Nigro et al., 2011). We expect the snow accumu-lation at these sites may be more affected by wind redistribu-tion than other sites such as Margaret, which is located on the eastern side of the RIS near Roosevelt Island. The Windless Bight site, located near Ross Island on the northwestern edge of the RIS, is also less affected by strong wind regimes, but is known to experience high accumulation compared to other sites due to its location on the windward side of Ross Island (Monaghan et al., 2005).
Wind redistribution of snow is a significant and ongoing challenge for studying precipitation events in Antarctica be-cause the process is complex and dependent on many addi-tional factors such as snow age, air temperature, snow mois-ture, local topography (down to metre-scale sastrugi), and snow grain size (Li and Pomeroy, 1997). Increases in mea-sured snow accumulation at a site can occur due to either precipitation or blowing snow, or both, as precipitation often occurs in conjunction with high wind speeds. Increases in ac-cumulation due to clear-sky precipitation and hoar frost are not considered significant for this region (Bromwich, 1988). Decreases in accumulation due to ablation, compaction, and sublimation are significant contributors to net accumula-tion but can be largely ignored in this study as the event-based analysis only considers positive changes in accumu-lation. The densification of the snowpack that occurs on the timescale of an event (<100 h) is less than 1 mm (Arthern et al., 2010), and can thus be ignored for this study. How-ever, the densification of snow deposited during an event
due to wind can significantly increase surface snow densities (Pomeroy and Brun, 2001), and this is considered further in the analysis.
As wind is the primary factor affecting the magnitude of measured accumulation (both positively and negatively), previous studies can help provide some estimate of the fre-quency of high winds occurring during accumulation events on the RIS and their effects on measured accumulation (Braaten, 1997, 2000; Knuth et al., 2010). Based on wind speed measurements for several stations on the RIS, Knuth et al. (2010) showed that most (72 %) measured large accumu-lation events (>1 cm per 30 min) were associated with blow-ing or driftblow-ing snow which may or may not have been concur-rent with precipitation. In another study on the RIS, Braaten (1997) showed that while most ADG-measured accumula-tion events were associated with human-observed precipi-tation events (using a much smaller event size threshold of 1.3 mm), less than half of the observed events (38 %) resulted in measurable accumulation by the instrument.
3 Data processing
3.1 ADG data
Snow accumulation is measured with a Campbell Scientific SR50 acoustic depth gauge (ADG), which determines the distance to the snow surface using reflected sonic pulses. The SR50 has a resolution of 0.0001 m and accuracy of 0.01 m or 0.04 % of sensor height (whichever is larger). The instrument measures the distance to snow surface from the speed of re-flected sonic pulses, and spurious measurements can occur due to drifting and blowing snow reflecting the acoustic sig-nal, high winds (>18 m s−1)(Brazenec and Doesken, 2005), low temperatures (<−35 to−40◦C) (Fountain et al., 2010), and rime or ice on the sensor. The temperature-corrected ADG data were retrieved from the University of Wisconsin AMRC ftp site (ftp://amrc.ssec.wisc.edu). Further informa-tion and specificainforma-tions on the AWS instrumentainforma-tion and net-work is described in Lazzara et al. (2012) and on the Univer-sity of Wisconsin AMRC site (http://amrc.ssec.wisc.edu).
Snow accumulation records for each station were pro-duced by removing null measurements and measurements that do not represent physical accumulation (i.e. spurious data points outside of the initial and final accumulation val-ues). The ADG data were recorded at a 10 min sampling rate except for Nascent, which is at 20 min resolution. The ADG sensor heights are periodically adjusted to keep the sensors ∼1 to 2 m above the snow surface, and these height adjust-ments were applied based on the maintenance logs.
The datasets all contain some high-frequency noise which was minimized using the same methodology as Fountain et al. (2010), which removes data outside of one standard devi-ation of a running daily value. Since snow accumuldevi-ation due to precipitation is stepped and episodic, the removal of data points outside of the daily standard deviation removes some of the high-frequency noise while retaining the amplitude of an accumulation event, though the timing can be shifted by up to one day. The ADG data were then averaged to a 3-hourly resolution in order to compare with the reanalyses datasets.
The ADG records are continuous with no large gaps except for Mary and Windless Bight, which have gaps during the winter months of 2011 (June–October). Removal of spurious data, high-frequency noise, and gaps in the raw data account for between 1.5 and 6.8 % of the data in all stations except for Mary and Windless Bight, which are missing 17.1 % and 22.5 % of their data respectively.
3.2 Reanalyses data
Reanalyses assimilate in situ meteorological data and satel-lite data into a global circulation model to produce com-prehensive global datasets of meteorological parameters at regular vertical and horizontal resolutions throughout the atmosphere. This study investigates the precipitation
products from the NCEP-2 (NCEP) and the ERA-Interim (ERA) reanalyses datasets (Kalnay et al., 1996; Dee et al., 2011). The NCEP reanalysis provides parameters at 2.5◦ latitude/longitude resolution through 30 June 2012; ERA provides parameters at 1.5◦ latitude/longitude resolution through 31 August 2012 (though the underlying models for both are run at higher resolution).
Though both reanalyses datasets assimilate meteorological observations from the AWS network, the snow accumulation data are not used. Precipitation products from both reanaly-ses rely entirely on the model’s representation of the hydro-logical processes as they are not directly constrained by ob-servational data (Dee et al., 2011). The ERA forecast model runs at both higher spatial and temporal resolution than the NCEP model (3-hourly intervals versus 6-hourly intervals, and∼80 km versus∼210 km horizontal resolution). Thus, we expect the ERA precipitation model to perform better in regards to reproducing precipitation on smaller spatial and temporal scales. In addition, ERA reanalysis also incorpo-rates more satellite observations (including GPS radio occul-tation measurements) and uses a more sophisticated varia-tional assimilation system (4-D-Var versus 3-D-Var). Differ-ences between ERA and other reanalyses precipitation prod-ucts since 2006 have been attributed to the assimilation of the new satellite observations (Bromwich et al., 2011), and the more sophisticated variational assimilation system in ERA has also been shown to result in improved moisture analysis (Andersson et al., 2007; Simmons et al., 2010).
The NCEP precipitation is given as an instantaneous pre-cipitation rate, kg m−2s−1water equivalent (w.e.), averaged over each 6 h forecast period, which we convert to m w.e. For ERA, total precipitation is derived from the 3-hourly forecast fields and given in m w.e. Precipitation data from the reanal-yses grid points nearest to each AWS location are used for the analysis. Distances from the stations are listed in Table 1 and shown in Fig. 1.
Most of the grid points are relatively close to their respec-tive AWS, and all are less than∼100 km from the AWS. Sta-tions located in the region that has the highest topographic gradient (near the TAM) are closest to their respective grid points, which helps minimize differences due to orograph-ically induced precipitation. Smaller topographic features such as Ross Island and Roosevelt Island are not resolved topographically in either of the reanalyses, and thus, local-ized precipitation due to these features is not expected to be reproduced. For large-scale, synoptically driven precipitation events, the distances between grid points and AWS will not affect the timing or amount of precipitation considerably.
3.3 Determination of coincident events
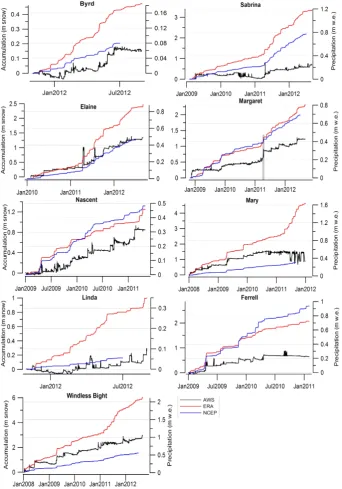
Fig. 2. Total accumulation and precipitation over time for each station (note different time periods). ADG accumulation is in m snow (left-hand axes) and ERA and NCEP reanalyses is in m w.e. (right-(left-hand axes), with axes offset by 35 % (approximate density of surface snow on RIS). A close up of the time period outlined by the grey box in the Margaret plot is shown in Fig. 4.
snow day−1, and set that as the event size cutoff for the ADG datasets. For the reanalyses data cutoff value, we use 0.5 mm w.e. day−1, which is equivalent to the ADG cutoff us-ing a mid-range fresh snow density of 100 kg m−3. For each dataset, a daily accumulation/precipitation rate is calculated at each time point (three-hourly for ADG and ERA; six-hourly for NCEP) with the day defined as the 12 h before and 12 h after the time point. An event is defined for each dataset
4 Results
Figure 2 shows each station’s ADG accumulation record along with the ERA and NCEP precipitation. Snow accu-mulation and precipitation events are seen as stepped in-creases in the plots. Dein-creases in accumulation seen in the ADG records indicate the effects of ablation, compaction, or sublimation, and are not accounted for in the reanalyses plots, which show only positive changes due to precipitation. Though negative accumulation processes are very important for surface mass balance, they are not considered in this study as we are simply attempting to identify precipitation events. For an approximate comparison of the magnitudes between the datasets (snow accumulation and precipitation), a snow density of 350 kg m−3is used to equate each station’syaxes in Fig. 2. The reanalyses precipitation shows that ERA pro-duces much more accumulation than NCEP (∼two to four times as much over the varying time periods) with the excep-tion of Ferrell, Margaret, and Nascent, which have similar total precipitation amounts for ERA and NCEP over these time periods.
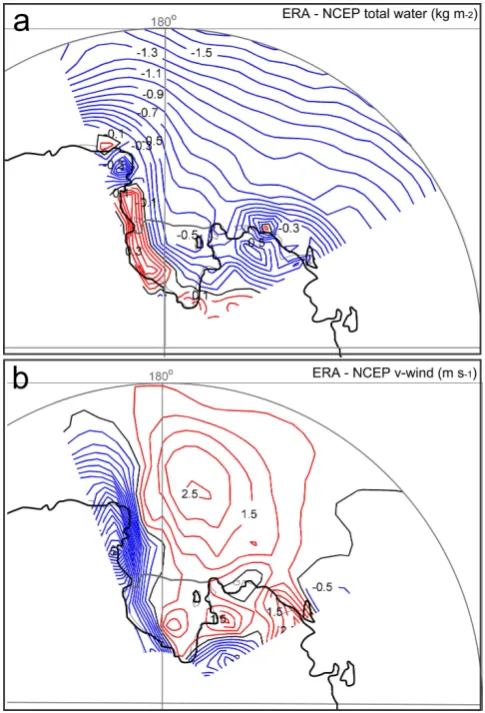
As precipitation in the reanalyses forecast models is largely driven by the meridional (moisture-bearing) circula-tion and the amount of water available (Kalnay et al., 1996; Dee et al., 2011), we look at the differences between ERA and NCEP for these parameters in order to understand why the precipitation amounts differ so much. Figure 3a and b show the difference between ERA and NCEP (ERA mi-nus NCEP) total precipitable water and near-surface merid-ional winds (850 hPa) over the RIS averaged from 2008 to 2012. Interestingly, Figure 3a shows that the ERA reanaly-sis has less moisture over much of the RIS and Ross Sea, but more along the TAM, which is consistent with the larger amounts of precipitation produced by ERA for stations along the TAM, while the stations further from the TAM (Ferrell, Margaret, and Nascent) produce similar amounts to NCEP. Figure 3b shows that ERA has a weaker southerly compo-nent (more positive v wind) for air coming from the Ross Sea (moisture-bearing) onto the RIS, but a stronger southerly component along the TAM. The weaker cyclonic circulation over the RIS in ERA is thus able to explain the differences in total precipitable water. The figures show that the largest differences between ERA and NCEP for both water content and meridional circulation are along the TAM. This is pos-sibly due to the higher spatial resolution of the ERA model being able to more accurately reproduce the effects of the barrier formed by the TAM.
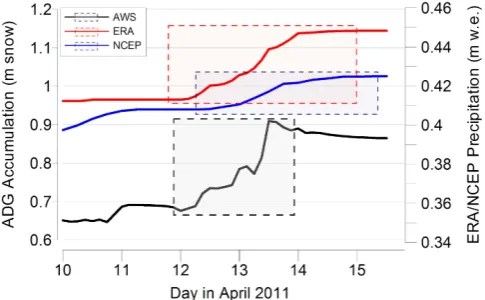
Figure 4 shows a close-up of six days in the ADG, ERA, and NCEP records for Margaret station (corresponding to the grey box in Fig. 2). The figure illustrates the characteristics typical of most of the coincident events identified in all of the stations. The highly stepped nature of ADG accumula-tion events is clear, as is the more broad nature of reanalyses events. The duration of events are different for each dataset,
Fig. 3. Differences between ERA and NCEP reanalyses (ERA mi-nus NCEP) from 2008 to 2012 over the Ross Sea and RIS region (60–85◦S, 160–240◦E) for (a) total precipitable water (total col-umn water) (kg m−2)and (b) 850 hPa meridional winds (m s−1). Red contours are positive (ERA larger than NCEP), blue contours are negative (NCEP larger than ERA), and grey line is zero. Total precipitable water contours are 0.1 kg m−2, and wind contours are 0.5 m s−1.
but the events overlap in time (or are within 24 h, as discussed in Sect. 3.3) as illustrated in Fig. 4.
Fig. 4. Zoomed-in section of the Margaret accumulation plot (cor-responding to the grey box in Margaret in Fig. 2) showing the char-acteristics typical of a coincident event. ADG snow accumulation is on the left-handyaxis, and ERA/NCEP precipitation is on the right-handyaxis as in Fig. 2 (note axes are different scales for clarity). The dashed boxes indicate the different durations of the coincident event (defined as>5 mm snow day−1 and >0.5 mm w.e. day−1) for each dataset.
precipitation in reanalyses forecast models and is worth fur-ther investigation.
Table 2 shows the number of accumulation events (>5 mm day−1 for ADG and>0.5 mm day−1 for reanaly-ses) identified for each of the ADG, ERA, and NCEP datasets as well as the number of coincident events for each pair-ing (ADG–ERA and ADG–NCEP). The probability that the number of coincident events in each time series is random is determined from the hypergeometric probability density dis-tribution, and is much less than 0.01 for all pairings. For all stations except Nascent, ERA produces a much larger num-ber of precipitation events, and except for Sabrina, a higher percentage of these events are coincident with ADG events.
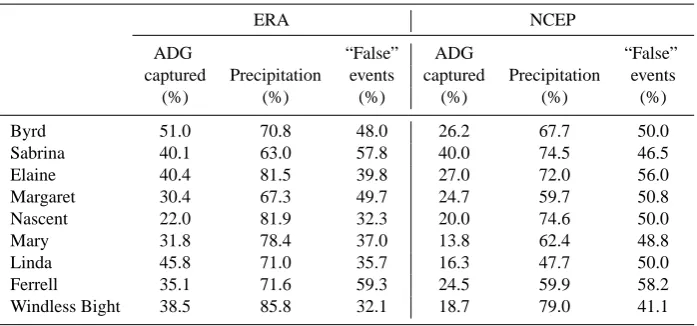
Table 3 shows the percentage of coincident events cap-tured by reanalyses datasets and the percentage of precipi-tation derived from these coincident events. ERA events co-incide with between 22 and 51 % of ADG events, and NCEP events coincide with between 14 and 40 % of ADG events. On average, ERA captures a higher percentage of ADG events than NCEP (average 37 % versus 23 %). Because of the known considerable influence of wind-redistributed snow on snow accumulation discussed in Section 2, many of the events identified in the ADG data may actually be due to blowing/drifting snow, where no precipitation occurred, and as such we would not necessarily expect these percentages to be very high. Identifying and quantifying these events is very difficult, and is a persistent challenge in snow accumula-tion studies. The coincident events do correspond to sizeable amounts of the total reanalysis precipitation (between 63 and 86 % and between 48 and 79 % for ERA and NCEP respec-tively), with ERA producing an average of 8.2 % (significant at the 93 % confidence level) more precipitation than NCEP.
That ERA captures on average 14 % more events but only 8.2 % more precipitation indicates that the “extra” events ERA is capturing are smaller precipitation events.
Table 3 also shows the percentage of reanalyses events that are not seen in the ADG data (“false” events). The NCEP reanalyses dataset has more false events than ERA (aver-age 50 % and 44 % respectively). These events would in-clude cases where snow accumulation is less than the ADG threshold of 5 mm day−1(either due to small amounts of pre-cipitation or wind limiting accumulation) or the event does not fall within the 48 h window used to define a coincident event. Distinguishing between these circumstances are diffi-cult, but in a study of one ADG record on the RIS, Braaten (1997) found that 38 % of meteorologist-observed precipita-tion events resulted in no measured accumulaprecipita-tion in the ADG record, suggesting that identifying whether the additional re-analyses events are in fact real is beyond the capability of the ADG dataset.
To assess the effect of changing the reanalysis event size cutoff on the analysis, we compare the number of coincident events and percentage of precipitation captured by coincident events using different reanalyses cutoff val-ues of 0.35 mm day−1, 0.5 mm day−1, 1 mm day−1, and 2 mm day−1 (the values in Tables 2 and 3 are calculated using 0.5 mm day−1). The two smallest values (0.35 and 0.5 mm day−1)are equivalent to the ADG measurement cut-off value (5 mm day−1)using freshly precipitated snow den-sities (7 and 10 %). Not surprisingly, increasing the reanal-yses cutoff decreases the number of coincident events and amount of precipitation accounted for. Over this range of cut-off values the average percentage of coincident events cap-tured for all stations decreases from 40 to 24 % for ERA and from 27 to 13 % for NCEP. The average percentage of precip-itation accounted for decreases from 77 to 61 % for ERA and from 70 to 49 % for NCEP. For the NCEP dataset, though the decrease in number of coincident events is similar to ERA (16 vs. 14 %), a larger change in the amount of precipitation (16 vs. 21 %) is seen. This suggests that the NCEP dataset produces more precipitation at smaller amounts, making it more sensitive to the lower cutoff values. The percentage of “false” events also changes much more in the NCEP dataset, decreasing from 51 to 39 % as the cutoff increases (from 0.35 to 2 mm day−1), while ERA “false” events change only slightly from 44 to 40 %.
Table 2. The number of events for ADG, ERA-Interim, and NCEP-2 datasets and number of coincident events.
Number of Events
ADGa ERA ADG–ERA ADGb NCEP ADG–NCEP
Byrd 51 50 26 42 22 11
Sabrina 182 173 73 170 127 68
Elaine 146 98 59 137 84 37
Margaret 237 143 72 235 118 58
Nascent 200 65 44 200 80 40
Mary 305 154 97 305 82 42
Linda 59 42 27 49 16 8
Ferrell 94 81 33 94 55 23
Windless Bight 369 209 142 353 112 66
ato 31 Aug 2012 bto 30 Jun 2012
Table 3. Percentages of ADG events captured by reanalysis datasets, the amount of precipitation captured by those events (as a percentage of the total reanalysis precipitation), and percentage of reanalysis events that are not seen in ADG data (“false” events) for each reanalysis dataset.
ERA NCEP
ADG “False” ADG “False”
captured Precipitation events captured Precipitation events
(%) (%) (%) (%) (%) (%)
Byrd 51.0 70.8 48.0 26.2 67.7 50.0
Sabrina 40.1 63.0 57.8 40.0 74.5 46.5
Elaine 40.4 81.5 39.8 27.0 72.0 56.0
Margaret 30.4 67.3 49.7 24.7 59.7 50.8
Nascent 22.0 81.9 32.3 20.0 74.6 50.0
Mary 31.8 78.4 37.0 13.8 62.4 48.8
Linda 45.8 71.0 35.7 16.3 47.7 50.0
Ferrell 35.1 71.6 59.3 24.5 59.9 58.2
Windless Bight 38.5 85.8 32.1 18.7 79.0 41.1
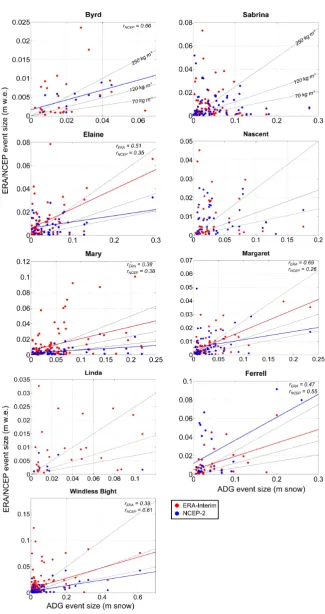
and reanalyses event sizes that are significant at 90 % level. Regression lines which lie near the range of fresh snow den-sities with zero-intercept and higher correlation coefficients indicate better relationships between reanalyses precipitation and ADG data.
Five of the nine stations have significant relationships with both ERA and NCEP (Elaine, Margaret, Mary, Ferrell, and Windless Bight), and one has a significant relationship with NCEP (Byrd), indicating that many precipitation events are being accurately represented by both reanalyses datasets. The rvalues vary between 0.26 and 0.69, with neither reanalyses product showing higher correlations over all stations. The regressions show that ERA events are generally larger than NCEP events. The smaller values seen in NCEP would be consistent with previous studies showing that NCEP under-estimates precipitation in Antarctica (Cullather et al., 1996; Zou et al., 2004). However the NCEP regressions are not consistent enough to draw any conclusions about biases, and none are significantly lower than expected values. The one
regression that is significantly higher than expected values (Ferrell) is dominated by several events.
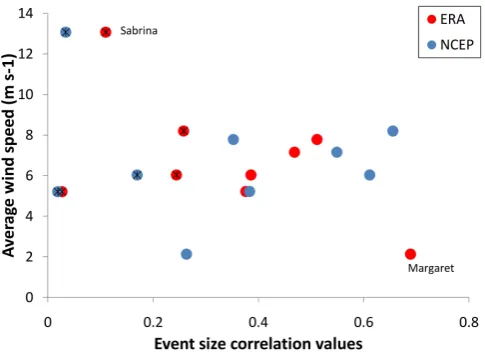
Fig. 6. Relationship between near-surface wind speed and event size correlation values (from Fig. 5), including those not signifi-cant at>90 % level (indicated with asterisk). Wind speed values are derived from ERA-Interim 850 hPa monthly averages (750 hPa for Byrd), averaged over the period of this study (2008–2012). Sta-tions with the highest (Sabrina) and lowest (Margaret) wind speed are labelled.
often enhanced by wind conditions), the ERA and NCEP re-gressions do reflect this (via regression slopes closer to fresh-snow values). However, the ERA data for this site still show a significant number of events where ERA events are much larger than ADG events. Finally, Margaret, which is located in the least wind-affected region of the RIS (Parish et al., 2006), has the highest correlation and near-zero intercept for the ERA data, but interestingly has the lowest correlation for NCEP. Figure 6 illustrates the relationship between average near-surface wind speed from 2008 to 2012 and the event-size correlation values from Fig. 5 (including those that are not significant). The figure supports the notion that the sites located in windier locations tend have the lowest correlations between ADG-measured events and reanalysis events.
5 Conclusions
This study develops an event-based analysis of ADG snow accumulation records from nine AWS located around the Ross Ice Shelf, and compares the observations to precipita-tion from ERA-Interim and NCEP-2 reanalyses. This pro-vides an assessment of the feasibility to use these measure-ments as validation for precipitation in reanalyses and other NWP models. The high-temporal-resolution ADG measure-ments provide a relatively dense network of multi-year ac-cumulation records in a relatively homogeneous region of Antarctica, and are shown to provide some insight into re-analyses precipitation on synoptic timescales for recent time periods (2008–2012). Analysis of the number of events in each dataset shows that, for all locations, ERA has more
matching events with the ADG measurements than NCEP, capturing an average 37 % of ADG accumulation events ver-sus 23 % for NCEP. These coincident events correspond to an average 75 and 66 % of the total reanalyses precipitation for ERA and NCEP respectively. Quantifying how many of the ADG events are precipitation versus blowing/drifting snow (and thus how many events the reanalyses are missing) is a difficult and ongoing challenge in measuring precipitation. Previous estimates of the number of wind-affected accumu-lation events from ADG data (which may or may not be co-incident with precipitation events) on the RIS are of the order of 70 % (Knuth et al., 2010), suggesting that the reanalyses may actually be capturing most precipitation events. Overall this analysis suggests that the ERA data perform better than NCEP, capturing 14 % more events and 8.2 % more precipi-tation.
Comparisons of the sizes of coincident events between ADG and reanalyses data show that there are significant cor-relations (at >90 %) for several of the stations, and these correlations are near the range of expected values, provid-ing further evidence that the reanalyses are reproducprovid-ing ac-tual precipitation events. The ERA data consistently produce more precipitation per event than the NCEP data, which is consistent with capturing more precipitation overall. Nei-ther reanalyses dataset shows consistently higher correlations with the ADG event sizes, but using known biases of limiting snow (Ferrell, Nascent, Mary, Sabrina) or wind-enhancing snow (Windless Bight) helps interpret some of the overall patterns of the event size correlations. ERA consis-tently shows correlations in the upper range of expected snow densities, while NCEP less consistently shows correlations in the lower range of expected snow densities.
Determination of the biases in the reanalyses datasets (i.e. ERA overestimating or NCEP underestimating precip-itation) is not possible due to the limitation of the ADG dataset. Further work to identify biases and make quantitative estimates would require extensive further analysis of site-specific wind conditions and snow density. In terms of pro-viding snow accumulation measurements, the placement of most of the ADGs on the Ross Ice Shelf is not ideal since they are specifically located in katabatic and barrier wind regimes where snow accumulation is highly affected by winds. De-spite this, the analysis shows important differences between the two datasets, and indicates that the ADG measurements could be used more extensively in the future to provide a valuable source of ground-based precipitation observations.
“Climate Present and Past” project of the National Climate Centre’s Climate Observations Programme (2012/13 SCI).
Edited by: M. Van den Broeke
References
Andersson, E., Holm, E., Bauer, P., Bejaars, A., Kelly, G. A., Mc-Nally, A. P., Simmons, A. J., Thepaut, J. N., and Tompkins, A. M.: Analysis and forecast impact of the main humidity observing systems, Q. J. Roy. Meteor. Soc., 133, 1473–1485, 2007. Arthern, R. J., Vaughan, D. G., Rankin, A. M., Mulvaney, R., and
Thomas, E. R.: In situ measurements of Antarctic snow com-paction compared with predictions of models, J. Geophys. Res., 115, F03011, doi:10.1029/2009JF001306, 2010.
Braaten, D.: A detailed assessment of snow accumulation in kata-batic wind areas on the Ross Ice Shelf, Antarctica, J. Geophys. Res., 102, 30047–30058, 1997.
Braaten, D.: Direct measurements of episodic snow accumulation on the Antarctic polar plateau, J. Geophys. Res., 105, 10119– 10128, 2000.
Brazenec, W. A. and Doesken, N. J.: An evaluation of two ultra-sonic snow depth sensors for potential use at automated surface weather observing sites, 13th Symposium on Meteorological Ob-servations and Instrumentation, American Meteorological Soci-ety, Savannah, GA, 2005.
Bromwich, D. H.: Snowfall in high southern latitudes, Rev. Geo-phys., 26, 149–168, 1988.
Bromwich, D. H., Guo, Z., Bai, L., and Chen, Q.: Modeled Antarc-tic Precipitation – Part I: Spatial and Temporal Variability, J. Cli-mate, 17, 427–447, 2004.
Bromwich, D. H., Fogt, R. L., Hodges, K. I., and Walsh, J. E.: A tro-pospheric assessment of the ERA-40, NCEP, and JRA-25 global reanalyses in the polar regions, J. Geophys. Res., 112, D10111, doi:10.1029/2006JD007859, 2007.
Bromwich, D. H., Nicolas, J. P., and Monaghan, A. J.: An assess-ment of precipitation changes over Antarctica and the Southern Ocean since 1989 in contemporary global reanalyses, J. Climate, 24, 4189–4209, 2011.
Bromwich, D. H., Nicolas, J. P., Monaghan, A. J., Lazzara, M. A., Keller, L. M., Weidner, G. A., Wilson, A. B.: Central West Antarctica among the most rapidly warming regions on Earth, Nat. Geosci., 6, 139–145, doi:10.1038/ngeo1671, 2012. Cohen, L., Dean, S., and Renwick, J.: Synoptic Weather Types
for the Ross Sea Region, Antarctica, J. Climate, 26, 636–649, doi:10.1175/JCLI-D-11-00690.1, 2013.
Cullather, R. I., Bromwich, D. H., and Van Woert, M. L.: Inter-annual variations in Antarctic precipitation related to El Ni˜no-Southern Oscillation, J. Geophys. Res., 101, 19109–19118, 1996.
Cullather, R. I., Bromwich, D. H., and van Woert, M. L.: Spatial and temporal variability of Antarctic precipitation from atmospheric methods. J. Climate, 11, 334–367, 1998.
Dee, D. P., Uppala, S. M., Simmons, A. J., Berrisford, P., Poli, P., Kobayashi, S., Andrae, U., Balmaseda, M. A., Balsamo, G., Bauer, P., Bechtold, P., Beljaars, A. C. M., van de Berg, L., Bid-lot, J., Bormann, N., Delsol, C., Dragani, R., Fuentes, M., Geer, A. J., Haimberger, L., Healy, S. B., Hersbach, H., H´olm, E. V., Isaksen, L., K˚allberg, P., K¨ohler, M., Matricardi, M., McNally,
A. P., Monge-Sanz, B. M., Morcrette, J.-J., Park, B.-K., Peubey, C., de Rosnay, P., Tavolato, C., Th´epaut, J.-N., and Vitart, F.: The ERA-Interim reanalysis: configuration and performance of the data assimilation system. Q. J. Roy. Meteor. Soc., 137, 553–597, doi:10.1002/qj.828, 2011.
Eisen, O., Frezzotti, M., Genthon, C., Isaksson, E., Magand, O., Van den Broeke, M. R., Dixon, D. A., Ekaykin, A., Holm-lund, P., Kameda, T., Karlo, L., Kaspari, S., Lipenkov, V. Y., Oerter, H., Takahashi, S., and Vaughan, D. G.: Ground-based measurements of spatial and temporal variability of snow ac-cumulation in East Antarctica, Rev. Geophys., 46, RG2001, doi:10.1029/2006RG000218, 2008.
Fogt, R. L. and Bromwich, D. H.: Decadal Variability of the ENSO Teleconnection to the High-Latitude South Pacific Governed by Coupling with the Southern Annular Mode, J. Climate, 19, 979– 997, 2006.
Fogt, R. L., Wovrosh, A. J., Langen, R. A., and Simmonds, I.: The characteristic variability and connection to the underlying synop-tic activity of the Amundsen-Bellingshausen Seas Low, J. Geo-phys. Res., 117, D07111, doi:10.1029/2011JD017337, 2012. Fountain, A. G., Nylen, T. H., Monaghan, A., Basaigic, H. J., and
Bromwich, D.: Snow in the McMurdo Dry Valleys, Antarctica, Int. J. Climatol., 30, 633–642, doi:10.1002/joc.1933, 2010. Helsen, M. M., van de Wal, R. S. W., and Van den Broeke, M. R.:
The isotopic composition of present-day Antarctic snow in a La-grangian atmospheric simulation, J. Climate, 20, 739–756, 2007. Kalnay, E., Kanamitsu, M., Kistler, R., Collins, W., Deaven, D., Gandin, L., Iredell, M., Saha, S., White, G., Woollen, J., Zhu, Y., Leetmaa, A., Reynolds, R., Chelliah, M., Ebisuzaki, W., Higgins, W., Janowiak, J., Mo, K. C., Ropelewski, C., Wang, J., Jenne, R., and Joseph, D.: The NCEP/NCAR 40-Year Reanalysis Project, B. Am. Meteorol. Soc., 77, 437–470, 1996.
King, J. C. and Turner, J.: Antarctic Meteorology and Climatology, Cambridge University Press, 409 pp., 1997.
Knuth, S. L., Tripoli, G. J., Thom, J. E., and Weidner, G. A.: The in-fluence of blowing snow and precipitation on snow depth change across the Ross Ice Shelf and Ross Sea regions of Antarctica, J. Appl. Meteor. Climatol., 49, 1306–1321, 2010.
Kojima, K.: Densification of snow in Antarctica, in Antarc-tic Snow and Ice Studies, in: Antarct. Res. Ser., vol. 2, edited by: Mellor, M., 157–218, AGU, Washington, DC, doi:10.1029/AR002p0157, 1964.
Krinner, G., Magand, O., Simmonds, I., Genthon, C., and Dufresne, J. L.: Simulated Antarctic precipitation and surface mass balance at the end of the twentieth and twenty-first centuries, Clim. Dy-nam., 28, 215–230, 2007.
Lazzara, M. A., Weidner, G. A., Keller, L. M., Thom, J. E., and Cassano, J. J.: Antarctic Automatic Weather Station Program: 30 years of polar observations, B. Am. Meterol. Soc., 93, 1519– 1537, 2012.
Li, L. and Pomeroy, J. W.: Probability of occurrence of blowing snow, J. Geophys. Res., 102, 21955–21964, 1997.
Lu, C., Yuan, H., Tollerud, E. I., and Wang, N.: Scale-dependent uncertainties in global QPFs and QPEs from NWP model and satellite fields. J. Hydrometerol., 11, 139–155, 2010.
Monaghan, A. J., Bromwich, D. H., Powers, J. G., and Manning, K. W.: The climate of the McMurdo, Antarctica, region as rep-resented by one year of forecasts from the Antarctic Mesoscale Prediction System, J. Climate, 18, 1174–1189, 2005.
Monaghan, A. J., Bromwich, D. H., Fogt, R. L., Wang, S.H., Mayewski, P. A., Dixon, D.A., Ekaykin, A., Frezzotti, M., Good-win, I., Isaksson, E., Kaspari, S. D., Morgan, V. I., Oerter, H., van Ommen, T. D., van der Veen, C. J., Wen, J.: Insignificant change in Antarctic snowfall since the International Geophysical Year, Science, 313, 827–831, 2006.
Nigro, M. A., Cassano, J. J., and Seefeldt, M. W.: A weather-pattern based approach to evaluate Antarctic Mesoscale Prediction Sys-tem (AMPS) forecasts: Comparison to automatic weather station observations, Weather Forecast., 26, 184–198, 2011.
Noone, D. and Simmonds, I.: Annular variations in moisture trans-port mechanisms and the abundance of d18O in Antarctic snow, J. Geophys. Res., 107, 4742, doi:10.1029/2002JD002262, 2002. Parish, T. R., Cassano, J. J., and Seefeldt, M. W.: Characteristics of the Ross Ice Shelf air stream as depicted in Antarctic Mesoscale Prediction System simulations, J. Geophys. Res., 1ll, D12109, doi:10.1029/2005JD006185, 2006.
Pomeroy, J. and Brun, E.: Physical Properties of Snow in: Snow Ecology: An Interdisciplinary Examination of Snow-Covered Ecosystems, Cambridge University Press, 45–126, 2001. Qin, D., Xiao, C., Allison, I., Bian L., Stephenson, R., Ren, J., and
Yan, M.: Snow surface height variations on the Antarctic ice sheet in Princess Elizabeth Land, Antarctica: 1 year data from an automatic weather station, Ann. Glaciol., 39, 181–187, 2004. Reijmer, C. H. and Van den Broeke, M. R.: Temporal and spa-tial variability of the surface mass balance in Dronning Maud Land, Antarctica, as derived from automatic weather stations, J. Glaciol., 49, 512–520, doi:10.3189/172756503781830494, 2003.
Reijmer, H., Van den Broeke, M. R., and Scheele, M. P.: Air parcel trajectories and snowfall related to five deep drilling locations in Antarctica based on the ERA-15 dataset, J. Climate, 15, 1957– 1968, 2002.
Simmons, A. J., Willett, K. M., Jones, P. D., Thorne, P. W., and Dee, P. D.: Low-frequency variations in surface atmospheric humidity, temperature, and precipitation: Inferences from reanalyses and monthly gridded observational data sets, J. Geophys. Res., 115, D01110, doi:10.1029/2009JD012442, 2010.
Simmonds, I., Keay, K., and Lim, E. P.: Synoptic activity in the seas around Antarctica, Mon. Weather Rev., 131, 272–288, 2003. Sinclair, K. E., Bertler, N. A. N., and Trompetter, W. J.: Synoptic
controls on precipitation pathways and snow delivery to high-accumulation ice core sites in the Ross Sea region, Antarctica. J. Geophys. Res., 115, D22112, doi:10.1029/2010JD014383, 2010. Thiery, W., Gorodetskaya, I. V., Bintanja, R., Van Lipzig, N. P. M., Van den Broeke, M. R., Reijmer, C. H., and Kuipers Munneke, P.: Surface and snowdrift sublimation at Princess Elisabeth station, East Antarctica, The Cryosphere, 6, 841–857, doi:10.5194/tc-6-841-2012, 2012.
Thomas, E. R. and Bracegirdle, T. J.: Improving ice core interpre-tation using in situ and reanalysis data, J. Geophys. Res., 114, D20116, doi:10.1029/2009JD012263, 2009.