Molecular Characterization and Identification of Facilitative Glucose
Transporter 2 (GLUT2) and Expression of Related Glycometabolism
in Response to Different Starch Levels in Blunt Snout Bream
(
Megalobrama amblycephala
)
Hua-Liang Liang
1, Ogwok-Manas Wilson-Arop
1, Hai-Feng Mi
2, Ke J
1, Xian-Ping Ge
1, 2*, Ming-Chun Ren
1, 2*1Wuxi Fisheries College, Nanjing Agricultural University, Wuxi 214081, China; E-Mails:
hualiang_liang@163.com (H.-L.L);3196182418@qq.com (O.M. -W.A); jk18851176706@163.com (K.-J); gexp@ffrc.cn (X. -P.G);renmc@ffrc.cn (M.-C.R)
2Key Laboratory for Genetic Breeding of Aquatic Animals and Aquaculture Biology, Freshwater
Fisheries Research Center (FFRC), Chinese Academy of Fishery Sciences (CAFS), Wuxi 214081, China. E-Mails: mihf@tongwei.com (H. -F.M)
*Correspondence: E-mail: gexp@ffrc.cn; renmc@ffrc.cn. Tel. +86-510-85556566
Abstract:
Facilitative glucose transporters (GLUT) are transmembrane transporter of proteins involved in glucose transport across the plasma membrane. To date, there is noinformation about glucose transporter 2 (GLUT2) in blunt snout bream (Megalobram aamblycephala). In this study, GLUT2 were cloned and characterized from blunt snout bream, and its-expression in response to diets with different carbohydrate levels (17.1%; 21.8%; 26.4%; 32.0%; 36.3% and 41.9% of dry matter). In this study, the full-length cDNA of
GLUT2 was 2577 bp, including a 5’-untranslated region (UTR) of 73 bp, a 3’-UTR of 992 bp,
and an open reading frame of 1512 bp, encoding a polypeptide of 503 amino acids with
predicted molecular weight of 55.046 kDa and theoretical isoelectric point of 7.52. GLUT2
has twelve across the membrane area locating at 7-29; 71-93; 106-123; 133-155; 168-190;
195-217; 282-301; 316-338; 345-367; 377-399; 412-434; 438-460 aimo acids respectively.
Conservative structure domains located at 12-477 aimo acids belonging to sugar porter family
major facilitator superfamily (MFS) transporter. The blunt snout bream GLUT2 showed high
identity to their orthologs in other fish species and mammals. Quantitative real-time
(qRT)-PCR assays revealed that GLUT2 expression was high in the liver, intestine and
kidney; highest in the liver. Compared with the control group (17.1%), high dietary carbohydrate levels (32.0%; 36.3% and 41.9%) resulted in high plasma glucose at 3h after
feeding, but high plasma glucose were back to basal at 24h after feeding. Furthermore, high
dietary carbohydrate levels significantly improved the glycolysis and inhibitied gluconeogenesis by augmentation of GK and PK expression, inhibition of PEPCK and G6P
mRNA levels (P<0.05). However, GLUT2; GK; PK; PEPCK and G6P mRNA levels were back to basal.
Keywords:
blunt snout bream (megalobrama amblycephala); glucose transporter 2;
glycometabolism; starch
1. Introduction
Sufficient quantities of protein to meet anabolic requirements should be supplied in the
diet to gain the protein-sparing effect of the carbohydrate [1], but the utilization of carbohydrate by fish is varies [2], and different from mammals, the utilization of carbohydrate in fish is limited; feeding with high level of carbohydrate, not only caused the reduction of
fish growth, but also could lead to prolonged hyperglycemia [3-6].In recent years, facilitative glucose transporter (GLUT) has become a hotspot in research in mammalian and fish.
Growing evidences found that GLUTs across the plasma membrane of mammalian cells is the
first rate-limiting step for glucose metabolism and involved in regulation of glucose
metabolism and energy homeostasis [7-11].
Glucose concentrations in the liver are maintained at equilibrium with glucose in blood
due to the existence of a specific diffusion glucose transporter called facilitative glucose
transporter 2 (GLUT2) [12-15]. Compared to GLUT1, 3, 4, GLUT2 is the major glucose transporter in hepatocytes and exhibits several distinctive characteristics [16,17]. In mammalian, at least 13 different GLUT isoforms have been thus far identified [18,19], which
are categorized into class I (GLUT1-4), class II (GLUT5, 7, 9, and 11), and class III (GLUT6, 8, 10, 12 and the myo-inositol transporter HMIT1) [9,20,21]. In recent years, the four mammalian GLUT homologues belonging to class I have also been identified in fish: GLUT1
Atlantic cod [13,28]. There is only a few information concerning cloning and identification of GLUT2 in rainbow trout Atlantic cod and sea bass (Dicentrarchus labrax) [13-15].
Blunt snout bream, Megalobrama amblycephala, is an important cultured freshwater fish species in China, because of its excellent flesh quality, rapid growth performance and high
larval survival rate [29-31]. Furthermore, it is also distributed in North America (northern Canada to southern Mexico), Africa and Eurasia [32]. Commercial production has a fast increase and approximately 0.79 million tons in 2015 [33]. In the previous studies, we found high level of carbohydrate intake could reduce fish growth and result in prolonged
hyperglycemia in blunt snout bream [6,34]. However, there is no information concerning identification of GLUT2 in blunt snout bream, and the mechanisms by which glucose
transporters in this fish species are regulated to maintain to plasma glucose levels have not
been identified. Therefore, the aim of this study was to clone and identify GLUT2 in blunt
snout bream, and to investigate the expression of GLUT2 and related gene of
glycometabolism in response to different starch levels.
2. Result
2.1. Cloning and characterization of blunt snout bream GLUT2 cDNA
GLUT2 cDNA sequence of blunt snout bream predicted a start codon at nucleotide 73, a
stop codon at nucleotide 1288. The cDNA is 2577 bp in length and contains a 5’-untranslated
region (UTR) of 73 bp, a 3’-UTR of 992 bp, and an open reading frame of 1512 bp (GenBank under accession no: KC513421.2) (Fig. 1). Blunt snout bream GLUT2 encoded polypeptide of 503 amino acids with predicted molecular weight of 55.046 kDa and theoretical isoelectric
point of 7.52. GLUT2 has twelve across the membrane area locating at 7-29; 71-93; 106-123; 133-155; 168-190; 195-217; 282-301; 316-338; 345-367; 377-399; 412-434; 438-460 aimo
acids respectively. Conservative structure domains located at 12-477 aimo acids belonging to
sugar porter family major facilitator superfamily (MFS) transporter.
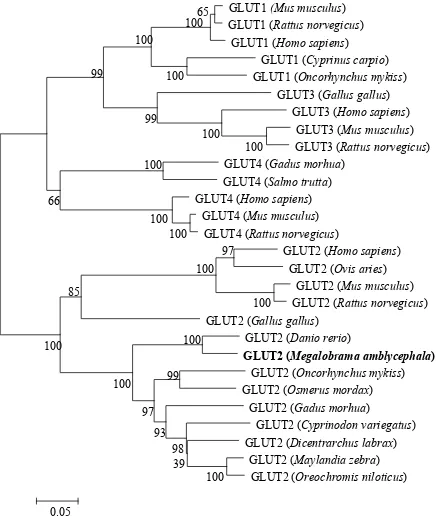
Phylogenetic analysis was performed to study the relation of blunt snout bream GLUT2
to class I GLUTs from other vertebrates, with special attention to GLUTs in fish, which
clearly showed that it clustered with fish GLUT2 sequences, as well as other vertebrate
GLUT2, but not with other class I GLUTs (Fig. 2).
zebrafish (Danio rerio; GenBank under accession no: NP_001036186.1); chicken (Gallus gallus; GenBank under accession no: NP_997061.1); human (Homo sapiens;GenBank under accession no: NP_000331.1); Mouse (Mus musculus; GenBank under accession no: NP_112474.2) are shown in Fig. 3. At the amino acid level, blunt snout bream GLUT2 had the high degree of sequence identity to three GLUT2s from zebra fish, chicken, human and
mouse, with 91%, 63%, 57% and 54% identity, respectively. (Fig.2).
1 ATTGGGAAAGCAGCGAGAACCTTGGAGCCACTATTAATGACCAAGAGCGGCTTTTGCTGACACTTCATGCAAA 74 ATGGAGAAGCAGTTAACAGGCACACTCGCTCTGGCAGTGTTCACAGCTGCACTTGGCTCTCTGCAGATGGGATAC
M E K Q L T G T L A L A V F T A A L G S L Q M G Y 149 AGCCTGGGTGTCATCAATGCCCCACAGAAGGTCATTGAGAGGCACTATGCAAGATCTCTCGGTGTCTATGATGAA
S L G V I N A P Q K V I E R H Y A R S L G V Y D E 224 AATCTGTCCCGTAGAGAAGGAGGAAATGCCACAGAACATGAAGAACCTTCCGATCCTTCTGTGGTCATGTACTGG N L S R R E G G N A T E H E E P S D P S V V M Y W 299 TCCTTGTCTGTGGCCATCTTCTCCATTGGAGGCATGGTGTCCTCCTTTCTAGTGAGCTTTGTTAGCGACTTCCGT S L S V A I F S I G G M V S S F L V S F V S D F R 374 GGAAGGATCAAAGGCATGCTGGCAATAAATGTCCTTGCCATAACAGCTGGGCTGCTCATGGGCCTGGCTAAGATG G R I K G M L A I N V L A I T A G L L M G L A K M 449 GGCACACCTTACCTCATGGTGATAGCAGGACGTGCTATCATGGGACTGTACTGTGGTCTGTCATCTGGCCTGGTG G T P Y L M V I A G R A I M G L Y C G L S S G L V 524 CCCCTGTACATTGGAGAGATTTCTCCAATGAAGTTCAGAGGGGCTATGGGAGCGCTCCACCAGCTGGCTATTGTA P L Y I G E I S P M K F R G A M G A L H Q L A I V 599 ATTGGCATCCTTATTAGTCAAGTCATTGGTCTGGAGTTCCTGCTGGGAAATGATGACATGTGGCACGTACTGCTG I G I L I S Q V I G L E F L L G N D D M W H V L L 674 GGTCTTTCTGGAGCTCCTGCCATCCTGCAGAGTCTGCTGCTGCTTCTGTGTCCAGAGAGTCCTCGATACCTCTAC G L S G A P A I L Q S L L L L L C P E S P R Y L Y 749 ATCAAACAGGGCAAAGTGGAAGAAGCATGCAAGAATCTGAAAAGGCTGAAGGGAGATTACGACACCTCAAAAGAC I K Q G K V E E A C K N L K R L K G D Y D T S K D 824 ATAGCAGAGATGCAGGCAGAGAAGGAGGAGGCCATGAAAGAGGCGAAAATGTCCATCTGGCGGCTACTCCGTTCC I A E M Q A E K E E A M K E A K M S I W R L L R S 899 TCGGTGTACCGCCAGCAGCTCTTTGTGGCCCTCATGATGCACTTTTCCCAGCAGTTCTCTGGGATCAACGCTATC S V Y R Q Q L F V A L M M H F S Q Q F S G I N A I 974 TTTTATTACTCTACTTCGATCTTCCAGACTGCTGGTGTTGGTCAGCCTGTGTATGCCACTATTGGAGTGGGAGTT F Y Y S T S I F Q T A G V G Q P V Y A T I G V G V 1049 ATAAACATCATTTTCACCCTTGTGTCGGTGATCTTGGTGGACAGAACGGGCAGACGAACTCTTACTCTGGTTGGG
V A E L F S Q G P R P A A I A L A G C C N W T C N 1349 TTCATAATTGGCATGTTTTTTCCTTATTTAGAGGGTCTTTGTGGGAGCTACGTCTTTGTCATTTTTGCAGTACTC F I I G M F F P Y L E G L C G S Y V F V I F A V L 1424 CTGTTCGGTTTCACCGTTTTTATCTATTTGCGTGTACCTGAAACAAAAGGGAAGACTTTTGAGGAGATAGCAGCG L F G F T V F I Y L R V P E T K G K T F E E I A A 1499 GTTTTCCACCACAAACGTGGAGCCCCTCCTTCCAAACCACAAGAAGAGGCTGAGATGGTGCAGCTCAAGAGCTCT V F H H K R G A P P S K P Q E E A E M V Q L K S S 1574 ACAGAGGCCTGA
T E A * 1586 AGGAGGACCGTTAGTTTATGGCAACTGTGGAATGAACGATGTTACTGCAGGCACAGAACTTAACTGCTATGACAGAAC 1664 TGAACTGCTGTATGTTCCACTGAACCTCATGCAGAACTCATCATTTGACAGGAAATAATTAGTTTAGAGATTAACTAA 1742 ACACAACTGCATAATCGTGAGAGATGGTGCACAATATAGACATGCACTGGCCTTGGCGCAGCTAATGTTGAATTTAGA 1820 TGATTGTATATTATTTTTATATTCCCAAAGTTATATATCTGTTAAAGATATTTTTTAAAGGTATCATTTTCTTCAGTG 1898 TATTTAATTAGTGATATTGATGGTGGCAAATTTAAAGTGATTTGTCCTTTCAGTTCAATATGGAGAGAATTGTATGTG 1975 TCAACTGAGATTTGTGAGATATAAATCAACTGAAAGAAGGTTATACAAACTTCAGTGCATTACATAATTAATATGGTA 2054 GTATGGTTATATGATAGATATTTAAAATTAAATATTCAAAGACAAAATGTAAGAATTTATTACATTTTGTTTTAGAGT 2132 TACAATGGTTGGATTACATTTGTGTATTTTTTCCCATTATAAAATTACCCATGTTTTAAAGTAAACCATTCCAACTTC 2210 AAAACAACCTTAATTATTTGCTTTGCTAGATATCTAAAAATCCAAAGATTGTTAACAATTACTTTATAATTTTGCAGA 2288 ATAGAAGACCCTTGAATTATATTATATTAAATGATATAGGAAAGCCTTTGAAAACACAATGGTGCTGCAACCCTTTTT 2366 TTGCTGTGTCTTTTAATCTGTTGCTATTATACTTCATGGCAGTTTGATGATTGTCAAAGTACCTGGAAACTTATTGCA 2243 AATATGCAGTGAATGTTACGTTTAGGCCTACTCTATTGTTAAAAAGTTTAGGGTCGGTAAGTGTCTTATTTAGCTACT 2522 CACCAAGGCTGCATTTAGTTGATCAAAAATACTGTAAAAACAGTAATATTGTGAAA
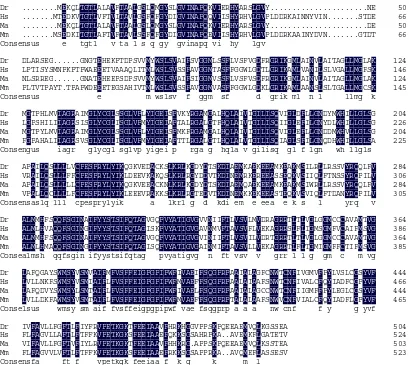
Fig 2. Comparison of the deduced amino acid sequences of GLUT2 with those of other known GLUT2 proteins, which from zebrafish; human; chicken; mouse; blunt snout bream.Identical residues are shaded black. Dr: Danio rerio, NP_001036186.1; Gg: Gallus gallus, NP_997061.1;
Hs: Homo sapiens, NP_000331.1; Mm: Mus musculus, NP_112474.2; Ma: Megalobrama
amblycephala, AGK44960.2
Fig 3. Phylogenetic tree of known vertebrate GLUT protein sequences. A phylogenetic tree
was constructed with the complete protein sequence of blunt snout bream (Megalobrama
amblycephala) GLUT2, and a number of protein sequences corresponding to various vertebrate
GLUTs. GeneBank accession no: GLUT1 (Mus musculus): AAA37752.1; GLUT1 (Rattus
norvegicus): P11167.1; GLUT1 (Homo sapiens): AAA52571.1; GLUT1 (Cyprinus carpio):
AAF75683.1; GLUT1 (Oncorhynchus mykiss): AAF75681.1; GLUT3 (Gallus gallus):
GLUT1
(Mus musculus)
GLUT1 (Rattus norvegicus)
GLUT1 (Homo sapiens)
GLUT1 (Cyprinus carpio)
GLUT1 (Oncorhynchus mykiss)
GLUT3 (Gallus gallus)
GLUT3 (Homo sapiens)
GLUT3 (Mus musculus)
GLUT3 (Rattus norvegicus)
GLUT4 (Gadus morhua)
GLUT4 (Salmo trutta)
GLUT4 (Homo sapiens)
GLUT4 (Mus musculus)
GLUT4 (Rattus norvegicus)
GLUT2 (Homo sapiens)
GLUT2 (Ovis aries)
GLUT2 (Mus musculus)
GLUT2 (Rattus norvegicus)
GLUT2 (Gallus gallus)
GLUT2 (Danio rerio)
GLUT2 (
Megalobrama amblycephala
)
GLUT2 (Oncorhynchus mykiss)
GLUT2 (Osmerus mordax)
GLUT2 (Gadus morhua)
GLUT2 (Cyprinodon variegatus)
GLUT2 (Dicentrarchus labrax)
GLUT2 (Maylandia zebra)
GLUT2 (Oreochromis niloticus)
100
100
97
100
100
100
100
65
100
100
100
99
100
99
66
85
100
100
100
99
100
97
93
98
39
NP_990842.1; GLUT3 (Homo sapiens): AAF82116.1; GLUT3 (Mus musculus):
AAH34122.1
; GLUT3 (Rattus norvegicus): AAA62503.1; GLUT4 (Gadus morhua): AAZ15731.1; GLUT4(Salmo trutta): AAG12191.1; GLUT4 (Homo sapiens): NP_001033.1; GLUT4 (Mus musculus):
BAB03251.1; GLUT4 (Rattus norvegicus): NP_036883.1; GLUT2 (Homo sapiens): NP_000331.1;
GLUT2 (Ovis aries): XP_004003211.1; GLUT2 (Mus musculus): NP_112474.2; GLUT2 (Rattus
norvegicus): P12336.1; GLUT2 (Gallus gallus): NP_997061.1; GLUT2 (Danio rerio):
NP_001036186.1; GLUT2 (Megalobrama amblycephala): KC513421.2; GLUT2 (Oncorhynchus
mykiss): AAK09377.1; GLUT2 (Osmerus mordax): ACO34844.1; GLUT2 (Gadus morhua):
AAV63984.1; GLUT2 (Cyprinodon variegatus): XP_015230748.1; GLUT2 (Dicentrarchus
labrax): ABJ98775.2; GLUT2 (Maylandia zebra): XP_004540234.1; GLUT2 (Oreochromis
niloticus): XP_003442932.1. The scale bar refers to evolutionary distances in substitutions per site.
The numbers at tree nodes refer to percentage bootstrap values after 1000 replicates.
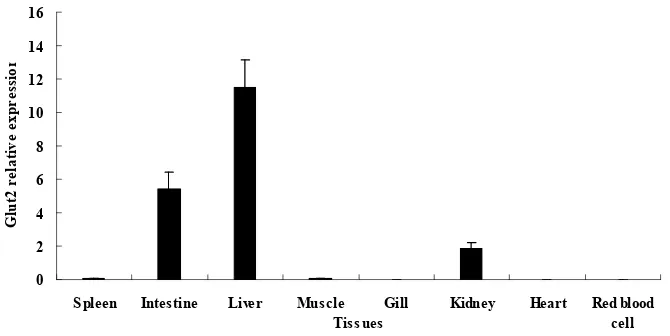
2.2. Tissue distribution of GLUT2
Quantitative real-time reverse transcription polymerase chain reaction analysis
(qRT-PCR) was used to quantify GLUT2 expression in the tissues of the liver, intestine, heart,
spleen, muscle, red blood cell, kidney and gill. GLUT2 mRNA was found to be constitutively
expressed in liver, intestine and kidney tissues, and highest level expression of GLUT2 was
observed in the liver. There were negligible expression levels in spleen, muscle, and
undetected expression levels in heart, red blood cell, gill (Fig. 4).
Fig 4. Tissue-specific mRNA expression of GLUT2 determined using quantitative real-time PCR. Vertical bars represent mean ± SE values for triplicate samples.
0 2 4 6 8 10 12 14 16
Spleen Intestine Liver Muscle Gill Kidney Heart Red blood cell Tissues
G
lu
t2
r
el
at
iv
e ex
pres
si
2.3.
Chronic starch feeding trial
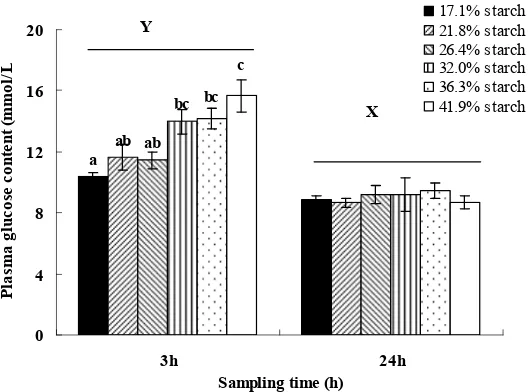
Compared to control group (17.10%), feeding 32.0%; 36.3% and 41.9% starch levels
groups significantly raised plasma glucose levels at 3h after feeding, but there were no
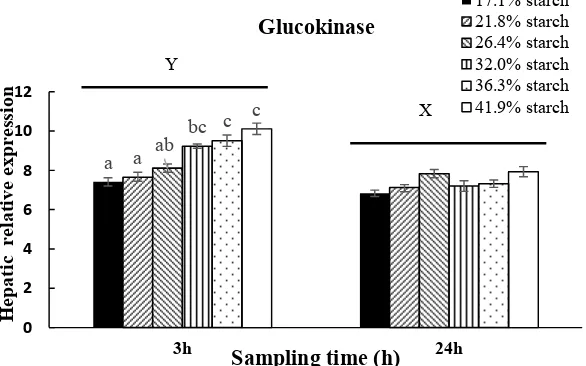
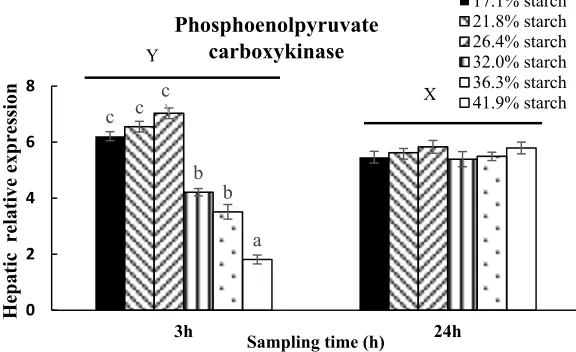
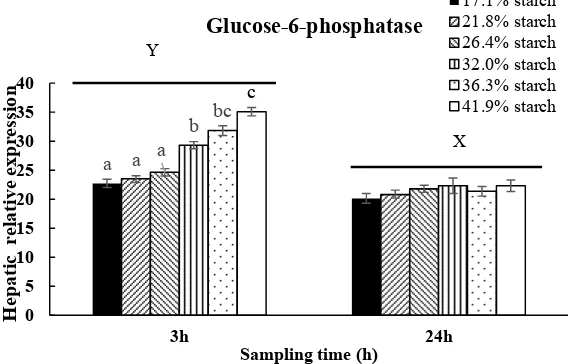
significant differences among the groups throughout the experiment at 24h after feeding (Fig. 5). 21.8%; 36.3% and 41.9% starch levels significant up-regulated relative expression of GLUT2 in liver at 3h after feeding (Fig. 6). High dietary carbohydrate levels (32.0%; 36.3% and 41.9%) significantly improved the relative expression of GK and PK (Fig. 7; 8), but significantly inhibitied the relative expression of PEPCK and G6P in liver at 3h after feeding
(Fig. 9; 10). GLUT2; GK; PK; PEPCK and G6P mRNA levels were back to basal in liver at 24h after feeding (Fig. 6; 7; 8; 9; 10).
Fig 5. Serum glucose levels of feeding different experimental feed at 3h and 24h after feeding. Vertical bars represent mean ± SE values for triplicate samples. Value with different superscripts are significantly different (P<0.05).
a ab ab
bc bc c
0 4 8 12 16 20
3h 24h
Sampling time (h)
P
las
m
a g
lu
cos
e
co
nt
en
t (
m
m
ol
/L
17.1% starch 21.8% starch 26.4% starch 32.0% starch 36.3% starch 41.9% starch
Y
Fig 6. Relative expression of GLUT2 in liver in response to different carbohydrate levels at 3h and 24h after feeding. Vertical bars represent mean ± SE values for triplicate samples. Value with different superscripts are significantly different (P<0.05)
Fig 7. Relative expression of glucokinase in liver in response to different carbohydrate levels at 3h and 24h after feeding. Vertical bars represent mean ± SE values for triplicate samples. Value with different superscripts are significantly different (P<0.05)
a a b ab b b
0 5 10 15 20 25 30
3h Sampling time (h) 24h
H
ep
at
ic
G
lu
t2
re
la
ti
ve
ex
pres
si
on
17.1% starch 21.8% starch 26.4% starch 32.0% starch 36.3% starch 41.9% starch Y
X
a a ab
bc c c
0 2 4 6 8 10 12
3h 24h
Hepatic
relative expression
Sampling time (h) Glucokinase
17.1% starch 21.8% starch 26.4% starch 32.0% starch 36.3% starch 41.9% starch X
Fig 8. Relative expression of pyruvate kinase in liver in response to different carbohydrate levels at 3h and 24h after feeding. Vertical bars represent mean ± SE values for triplicate samples. Value with different superscripts are significantly different (P<0.05)
Fig 9. Relative expression of phosphoenolpyruvate carboxykinase in liver in response to different carbohydrate levels at 3h and 24h after feeding. Vertical bars represent mean ± SE values for triplicate samples. Value with different superscripts are significantly different (P<0.05)
a ab
abc abc bc c
0 5 10 15 20
3h 24h
Hepatic
relative expression
Sampling time (h)
Pyruvate kinase
17.1% starch 21.8% starch 26.4% starch 32.0% starch 36.3% starch 41.9% starch
Y
X
c c c
b b
a
0 2 4 6 8
3h 24h
Hepatic
relative expression
Sampling time (h)
Phosphoenolpyruvate carboxykinase
17.1% starch 21.8% starch 26.4% starch 32.0% starch 36.3% starch 41.9% starch X
Fig 10. Relative expression of glucose-6-phosphatase in liver in response to different carbohydrate levels at 3h and 24h after feeding. Vertical bars represent mean ± SE values for triplicate samples. Value with different superscripts are significantly different (P<0.05)
3. Discussion
GLUT2 was the first characterized by cDNA cloning the Slc2a2/SLC2A2 gene from rat
and human liver cDNA libraries [35,36]. To the best of our knowledge, we firstly cloned and identified GLUT2 in blunt snout bream. In the present study, a full-length cDNA clone
representing the GLUT2 in blunt snout bream was obtained. By phylogenetic analysis, blunt
snout bream GLUT2 clustered with fish GLUT2 sequences and other vertebrate GLUT2, not
with other class I GLUTs. Therefore, the deduced blunt snout bream protein sequence was
considered the blunt snout bream ortholog of GLUT2. GLUT2 has twelve across the
membrane area locating at 7-29; 71-93; 106-123; 133-155; 168-190; 195-217; 282-301;
316-338; 345-367; 377-399; 412-434; 438-460 aimo acids respectively. Conservative
structure domains located at 12-477 aimo acids belonging to sugar porter family major
facilitator superfamily (MFS) transporter. Quantitative real-time reverse transcription
polymerase chain reaction analysis indicated that GLUT2 expression of blunt snout bream
was high in the liver, intestine and kidney, and highest in the liver. Tissue-specific expression
of GLUT2 in blunt snout bream is generally consistent with that reported for GLUT2 in
Atlantic cod and rainbow trout [13,14,37]. Different from sea bass and human, the highest expression of GLUT2 mRNA was observed intestinal tissue, followed by liver [15,38].
In general, fish, especially carnivorous fish have limited ability to metabolize glucose,
and high digestible carbohydrate intake results in postprandial hyperglycemia for many hours
a a a
b bc
c
0 5 10 15 20 25 30 35 40
3h 24h
Hepatic
relative expression
Sampling time (h)
Glucose-6-phosphatase
17.1% starch 21.8% starch 26.4% starch 32.0% starch 36.3% starch 41.9% starch
[2]. A positive correlation between plasma glucose concentration and dietary carbohydrate level was found in cobia (Rachycentron canadum L); rainbow trout; silver perch (Bidyanus bidyanus) [1,39-41]. In our study, plasma glucose levels increased with an increasing dietary carbohydrate level at 3h after feeding, and were back to basal in the experiment at 24h after
feeding. In the study of fish nutrition found that different fish species have different the
capacity of glucose regulation. In omnivorous fish, the capacity of glucose regulation of carp
only needed 5h to restore plasma glucose levels [3,42]. Tilapia and catfish (Ictalurus punctatus) needed 6h and 8h to return to normal levels respectively [43]. For carnivorous fish, rainbow trout and white sturgeon (Acipenser transmontanus), a 24h period was needed before plasma glucose levels were back to basal [40,44,45]. The present study confirmed the findings in fish which dietary carbohydrate level improved plasma glucose concentrations in
juvenile blunt snout bream.
GLUT2 mRNA level can affect the capacity of glucose transfer between liver and blood,
thereby affects glucose metabolism in the liver [46]. In our study, GLUT2 expression was raised in liver with increasing carbohydrate levels at 3h after feeding, highest expression in
41.9% carbohydrate level, however, GLUT2 expression were back to basal at 24h after
feeding, indicating optimal dietary carbohydrate supplementation could enhance the capacity
of glucose transfer between liver and blood in this juvenile fish. The present results suggest
GLTU2 clould be regulated by dietary carbohydrate as mammals [7]. In fish, literature data in this area are relative scarcity. Thorens et al. (1990) indicated that the expression of GLUT2
increases after feeding a high-carbohydrate diet [47]. In rainbow trout, dietary carbohydrate did not induce a specific effect; expressions of GLUT2 mRNA were heightened at 24h after
feeding [37]. Different from our study, dietary carbohydrate did not affect expression of GLUT2 mRNA at 6 h after feeding [37].The reason could be due to species differences, furthermore, carbohydrate level, feeding procedure and sample collection time could affect
result of the trail.
Glycolysis is important in the glycometabolism pathway, furthermore, glucokinase (GK)
and pyruvate kinase (PK) are two important rate-limiting enzymes in this pathway [48-50]. In this study, dietary carbohydrate improved expression of GK with increasing dietary
at 24h after feeding. In rainbow trout and gilthead sea bream (Sparus aurata), Panseratet al. (2000b) also found that carbohydrate feeding induced a high expression of GK gene, and
there is a time-dependent decrease of hepatic GK mRNA levels in fish fed dietary
carbohydrate 24h after a meal compared with 6h after a meal [51]. So high GK expression associated with dietary carbohydrate intake, one consequence of which is the relatively high levels of glycemia [40,41,52], which supported our experimental results. PK is the final step of glycolysis. In this study, the relative expression of PK showed a similar trend as plasma
glucose level at 3h after feeding and were back to basal at 24h after feeding. This result was consistent with the previous researches in mammals [53]. In aquatic animals, some similar researches were also reported such as gilthead sea bream [54,55], carp [56]; grass carp [57] and channel catfish (Ictalurus punctatus) [58]. At the same time, other researchers have demonstrated that the above fact has not been observed in Senegalese sole (Solea senegalensis, Kaup) and eel (Anguilla anguilla) [59,60]. The present results suggested that
dietary carbohydrate levels may improve hepatic glucose utilized by glycolysis pathway including up-regulation of GK and PK mRNA levels at 3h after feeding at least in juvenile
blunt snout bream liver.
The rate of gluconeogenesis is principally controlled by the activities of certain
unidirectional enzymes, such as phosphoenolpyruvate carboxykinase (PEPCK) and
glucose-6-phosphatase (G6P) [61]. In the present study, high dietary carbohydrate (32.0%; 36.3% and 41.9%) level decreased the relative expression of PEPCK and G6P at 3h after feeding and were back to basal at 24h after feeding, which was similar to those generally observed in mammals [62]. Several papers have reported the inhibition of PEPCK gene expression by glucose [63,64]. In aquatic animals, similar researches were also reported such as common carp (Cyprinus carpio) [65]; gilthead sea bream; dark barbel catfish (Pelteobagrus vachelli) [66]. However, Panserat et al. (2001) observed that there was no significantly effect of dietary carbohydrate on PEPCK gene expression [67]. G6P catalyzes the final step of gluconeogenesis, the production of free glucose from glucose-6-phosphate
by the dietary carbohydrate levels tested [69,70]. The present results suggested that dietary carbohydrate levels inhibited gluconeogenesis by inhibition of PEPCK and G6P expression at 3h after feeding in juvenile blunt snout bream. However, the mechanism that dietary carbohydrate regulated by gluconeogenesis including PEPCK and G6P is still unclear and
need to be further investigated.
4. Materials and methods
4.1.
Chronic carbohydrate feeding trial
2.1.1 Experimental diets
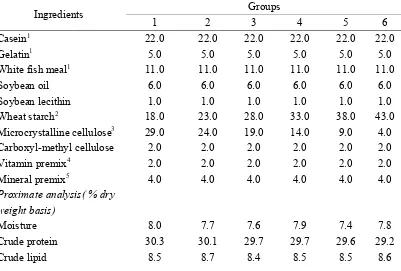
Experimental diets were formulated to contain 30.0% crude protein, 8.5% crude lipid.
Dietary protein was supplied by Casein, Gelatin and White fish meal, soybean oil and lecithin
as lipid sources, wheat starch as sugar sources (Table 1). Experimental diets were formulated to contain graded carbohydrate levels (17.1 (control), 21.8, 26.4, 32.0, 36.3 and 41.9% of dry
diet). Ingredients were ground into powder through 60 mash sieve and mixed uniformly with
soybean oil, lecithin and water to make sinking pellet feed. The pellet feed was forced though
a pelletizer (F-26 (II), South China University of Technology, China), which were then dried
at 45°C overnight and then stored at-20°C for further use.
Table 1
Formulation and proximate composition of experimental diets for starch
feeding trial
Ingredients Groups
1 2 3 4 5 6
Casein1 22.0 22.0 22.0 22.0 22.0 22.0
Gelatin1 5.0 5.0 5.0 5.0 5.0 5.0
White fish meal1 11.0 11.0 11.0 11.0 11.0 11.0
Soybean oil 6.0 6.0 6.0 6.0 6.0 6.0
Soybean lecithin 1.0 1.0 1.0 1.0 1.0 1.0
Wheat starch2 18.0 23.0 28.0 33.0 38.0 43.0
Microcrystalline cellulose3 29.0 24.0 19.0 14.0 9.0 4.0
Carboxyl-methyl cellulose 2.0 2.0 2.0 2.0 2.0 2.0
Vitamin premix4 2.0 2.0 2.0 2.0 2.0 2.0
Mineral premix5 4.0 4.0 4.0 4.0 4.0 4.0
Proximate analysis( % dry weight basis)
Moisture 8.0 7.7 7.6 7.9 7.4 7.8
Crude protein 30.3 30.1 29.7 29.7 29.6 29.2
Starch 17.1 21.8 26.4 32.0 36.3 41.9
Ash 5.5 5.5 5.4 5.6 5.4 5.2
Notes: 1Csein, obtained from Hua’ an Biological Products Lit. (Gansu, China), crude protein 90.2%; gelatin,
obtained from Zhanyu chemical Lit. (Shanghai, China), crude protein 91.3%; white fish meal, obtained from Copeinca (Lima, Peru), crude protein 67.4%, crude lipid 9.3%.
2wheat starch obtained from Guangsheng starch Lit. (Jiangsu, China).
3microcrystalline cellulose, obtained from Xinwang chemical Lit. (Zhejiang, China).
4vitamin premix (per kg diet): Vitamin A, 9 000 IU; Vitamin D, 2 500 IU; Vitamin E, 45 mg; Vitamin K
3, 2.2 mg;
Vitamin B1, 3.2 mg; Vitamin B2, 10.90 mg; Vitamin B6, 50 mg; Vitamin B12, 1.16 mg; Biotin, 0.50 mg;
Pantothenate, 10 mg; Folic acid, 1.65 mg; Inositol, 150 mg; Niacin acid, 25 mg.
5mineral premix (g /kg of diet): calcium biphosphate, 20 g; sodium chloride, 2.6g; potassium chloride, 5 g;
magnesium sulphate, 2 g; ferrous sulphate, 0.9 g; zinc sulphate, 0.06 g; cupric sulphate, 0.02; manganese sulphate,
0.03 g; sodium selenite, 0.02 g; cobalt chloride, 0.05 g; potassium iodide, 0.004 g.
4.1.2 Experimental procedure
Pre-adult blunt snout bream were obtained from the breeding farm of Freshwater
Fisheries Research Centre (FFRC) of Chinese Academy of Fishery Sciences. During the
acclimation period, fish were hand-fed three times daily at 8:00, 12:00 and 16:00 until
apparent satiation on the basis of visual observation of fish feeding behavior. At the initiation
of the experiment, fish were weighed and counted 24h after last feeding. The pre-adult blunt
snout bream (161 ± 2.7g) were randomly sorted into eighteen tanks (1000 L) with 20 fish.
Each diet was randomly assigned to triplicate tanks for 9 weeks. Fish were hand-fed three
times daily at 8:00, 12:00 and 16:00 until apparent satiation on the basis of visual observation
of fish feeding behavior. During the experimental period, water temperature ranged from 27
to 29°C, pH from 7.1 to 7.8, dissolved oxygen from 6.3 to 7.2mg/L, ammonia nitrogen from
0.006 to 0.008mg/L and hydrogen sulfide from 0.007 to 0.009mg/L.
4.1.3 Sample collection
At the end of the feeding trial, six experimental blunt snout bream from each tank were
collected, anesthetized with 100 mg L-1 MS-222, blood samples were collected immediately
from the caudal vein with disposable medical syringes and then liver samples were collected
from the sampled fish. Plasma was separated by centrifugation (3500×g, 10 min, 4°C).
Plasma and liver samples were stored at -80°C until analysis.
4.2. Cloning of GLUT2 cDNAs
blunt snout bream by using the RNAiso Plus Reagent (Takara, Dalian, China). First-strand cDNA was synthesized using the reverse transcriptase M-MLV Kit (Takara, Dalian, China). 3’-Rapid amplification of cDNA ends (RACE) and 5’-RACE were performed by the 3’-full
RACE Core Set Ver.2.0 Kit and 5’-full RACE Kit (Takara, Dalian, China). All primers used for cloning are listed in Table 2. The PCR products were purified using a gel extraction kit (Sangon, China) and sequenced on the ABI3730 DNA analyzer (ABI, USA) after insertion into the PMD-18T vector (Takara, Dalian, China).
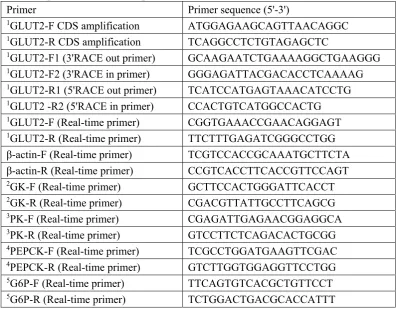
Table 2
Sequences of the PCR primers used in this work
Primer Primer sequence (5'-3')
1GLUT2-F CDS amplification ATGGAGAAGCAGTTAACAGGC
1GLUT2-R CDS amplification TCAGGCCTCTGTAGAGCTC
1GLUT2-F1 (3'RACE out primer) GCAAGAATCTGAAAAGGCTGAAGGG
1GLUT2-F2 (3'RACE in primer) GGGAGATTACGACACCTCAAAAG
1GLUT2-R1 (5'RACE out primer) TCATCCATGAGTAAACATCCTG
1GLUT2 -R2 (5'RACE in primer) CCACTGTCATGGCCACTG
1GLUT2-F (Real-time primer) CGGTGAAACCGAACAGGAGT
1GLUT2-R (Real-time primer) TTCTTTGAGATCGGGCCTGG
β-actin-F (Real-time primer) TCGTCCACCGCAAATGCTTCTA
β-actin-R (Real-time primer) CCGTCACCTTCACCGTTCCAGT
2GK-F (Real-time primer) GCTTCCACTGGGATTCACCT
2GK-R (Real-time primer) CGACGTTATTGCCTTCAGCG
3PK-F (Real-time primer) CGAGATTGAGAACGGAGGCA
3PK-R (Real-time primer) GTCCTTCTCAGACACTGCGG
4PEPCK-F (Real-time primer) TCGCCTGGATGAAGTTCGAC
4PEPCK-R (Real-time primer) GTCTTGGTGGAGGTTCCTGG
5G6P-F (Real-time primer) TTCAGTGTCACGCTGTTCCT
5G6P-R (Real-time primer) TCTGGACTGACGCACCATTT
Note:
1GLUT2: Glucose transporter 2;
2GK: Glucokinase;
3PK: Pyruvate kinase;
4PEPCK: Phosphoenol pyruvate carboxykinase;
5G6P: Glucose-6-phosphatase
4.3. Nucleotide sequence and bioinformatic analyzes
Similarity searches of the sequenced cDNA of GLUT2 were done by blastn
(www.ncbi.nlm.nih.gov/blast/). The multiple-sequence alignments of amino acids were performed by DNAman. The deduced amino acid sequences were analyzed with DNAman
(http://smart.embl-heidelberg.de/) and PROSITE program (http://kr.expasy.org/prosite/) were used to predict the functional sites or domains in the amino acid sequence. Phylogenetic
analyses were carried out based on amino acid sequences using the neighbour-joining method,
and the trees were constructed using MEGA 5.1. Transmembrane structure analyses were
carried out based on amino acid sequences by TMHMM 2.0. The sequenced cDNA of
GLUT2 were done by CDD (http://www.ncbi.nlm.nih.gov/Structure/cdd/wrpsb.cgi) to predict Conservative structure domains.
4.4. Quantitative real-time PCR analysis of GLUT2 expression
Relative gene expressions of GLUT2 was determined using Real-time PCR analysis as
described in our previous study [72]. Briefly, total RNA was extracted from the liver of juvenile blunt snout bream using an RNAiso plus kit (Takara, Dalian, China). After quality and quantity of RNA were checked, complementary DNA (cDNA) was synthesized using a
PrimeScript TM RT reagent kit (Takara, Dalian, China). We designed specific primers according to the partial cDNA sequences of these genes and cloned sequences (Table 3) [73].
β-actin was employed as a nonregulated reference gene, aspreviously used in blunt snout
bream studies [72] (Habte-Tsion et al., 2015). No changes in β-actin gene expression were observed in our investigations. Relative quantification of target gene expression was
performed using the Pfaffl's mathematical model [74].
4.5 Statistical analysis
All data were subjected to one-way analysis of variance (ANOVA) using the software of
SPSS 16.0 for Windows. Significant differences between means were evaluated by Turkey’s
Multiple Range Test. P<0.05 was considered significant. Data are expressed as means with
SEM (X± SEM).
5. Conclusion
The present study demonstrated that GLUT2 was 2577 bp, encoding a polypeptide of
503 amino acids with predicted molecular weight of 55.046 kDa and theoretical isoelectric
point of 7.52. GLUT2 has twelve across the membrane area locating at 7-29; 71-93; 106-123;
133-155; 168-190; 195-217; 282-301; 316-338; 345-367; 377-399; 412-434; 438-460 aimo
acids respectively. Conservative structure domains located at 12-477 aimo acids belonging to
positive correlation between plasma glucose concentration and dietary carbohydrate level at
3h after feeding. At 24h after feeding, plasma glucose concentration returned to basal level.
Furthermore, high dietary carbohydrate levels improved the glycolysis and inhibited gluconeogenesis by augmentation of GK and PK expression, inhibition of PEPCK and G6P
expression. However, when plasma glucose levels were back to basal at 24h, GLUT2; GK;
PK; PEPCK and G6P were independent of dietary starch levels.
Acknowledgements
This study was financially supported by Central Public-interest Scientific Institution
Basal Research Fund, Freshwater Fisheries Research Center, CAFS (NO. 2017JBFM15), the
National Natural Science Foundation of Jiangsu Province (BK20161143), the Modern
Agriculture Industrial Technology System special project-the National Technology System for
Conventional Freshwater Fish Industries (CARS-46).
Author Contributions: Xianping Ge and Mingchun Ren designed the study, Hualiang Liang
carried out the experiments and wrote the manuscript. Ogwok-Manas Wilson-Arop reviewed
the manuscript. Ke J performed data analysis. Haifeng Mi provided technical assistance.
Conflicts of Interest: The authors declare no conflict of interest.
Abbreviations
Facilitative Glucose Transporter: GLUT
Glucokinase: GK
Pyruvate kinase: PK
Phosphoenol pyruvate carboxykinase: PEPCK
References
1. Stone, D.A.J.; Allan, G.L.; Anderson, A.J. Carbohydrate utilization by juvenile silver perch,
Bidyanus bidyanus (Mitchell). III. The protein-sparing effect of wheat starch-based carbohydrate.
Aquacult. Res. 2003, 34, 123-134.
2. Wilson R.P. Utilization of dietary carbohydrate by fish. Aquaculture 1994, 124, 67-80.
3. Furuichi, M.; Yone, Y. Change of blood sugar and plasma insulin levels of fishes in glucose tolerance
test. Bull. Jpn. Sot. Sci. Fish. 1981, 47, 761-764.
4. Wilson, R.P.; Poe, W.E. Apparent inability of channel catfish to utilize dietary mone-and
disaccharides as energy sources. J. Nutr. 1987, 117, 280-285
5. Shi, Y.S. Utilization of carbohydrate in warmwater fish with particular reference to tilapia,
Oreochromis niloticus, x O. aureus. Aquaculture 1997, 151, 79-96.
6. Ren M.C.; Habte-Tsion, H.M.; Xie, J.; Liu, B.; Zhou, Q.L.; Ge, X.P.; Pan, L.K.; Chen R.L. Effects of
dietary carbohydrate source on growth performance, diet digestibility and liver glucose enzyme
activity in blunt snout bream, Megalobrama amblycephala. Aquaculture 2015, 438, 75-81.
7. Rencurel, F.; Girard, J. Regulation of liver gene expression by glucose. Proc. Nutr. Soc. 1998, 57,
265-275.
8. Katsumata, M.; Burton, K.A.; Li, J.; Dauncey, M.J. Suboptimal energy balance selectively
up-regulates muscle GLUT gene expression but reduces insulindependent glucose uptake during
postnatal development. FASEB J. 1999, 13, 1405-1413.
9. Joost, H.G.; Thorens, B. The extended GLUT-family of sugar/polyol transport facilitators:
nomenclature, sequence characteristics, and potential function of its novel members (review). Mol.
Membr. Biol. 2001, 18, 247-256.
10. Macheda, M.L.; Rogers, S.; Best, J.D. Molecular and cellular regulation of glucose transporter
(GLUT) proteins in cancer. J. Cell. Physiol. 2005, 202, 654.
11. Barron, C.C.; Bilan, P.J.; Tsakiridis, T.; Tsian,i E. Facilitative glucose transporters: Implications for
cancer detection, prognosis and treatment. Metabolism. 2016, 65, 124-139.
12. Castillo, J.; Crespo, D.; Capilla, E.; Diaz, M.; Chauvigne, F.; Cerda, J.; Planas, J.V. Evolutionary
structural and functional conservation of an ortholog of the GLUT2 glucose transporter gene
(SLC2A2) in zebrafish. Am. J. Physiol. Regul. Integr. Comp. Physiol. 2009, 297, R1570-R1581.
and GPDH: Developmental stage expression, tissue expression and relationship to
starvation-induced changes in blood glucose. J. Exp. Biol. 2006, 209, 4490-502.
14. Krasnov, A.; Teerijoki, H.; Mölsä, H. Rainbow trout (Oncorhynchus mykiss) hepatic glucose
transporter. Biochim. Biophys. Acta 2001, 1520, 174-178.
15. Terova, G.; Rimoldi, S.; Brambilla, F.; Gornati, R.; Bernardini, G.; Saroglia, M. In vivo regulation
of GLUT2 mRNA in sea bass (Dicentrarchus labrax) in response to acute and chronic hypoxia.
Comp. Biochem. Physiol. B Biochem. Mol. Biol. 2009, 152, 306-316.
16. Mueckler, M.; Thorens, B. The SLC2 (GLUT) family of membrane transporters. Mol. Aspects Med.
2013, 34, 121-138.
17. Mueckler, M.; Caruso, C.; Baldwin, S.A.; Panico, M., Blench, I.; Morris, H.R.; Allard, W.J.;
Lienhard, G.E.; Lodish, H.F. Sequence and structure of a human glucose transporter. Science
1985, 229, 941-945.
18. Wood, I.S.; Trayhurn, P. Glucose transporters (GLUT and SGLUT): expanded families of sugar
transport proteins. Br. J. Nutr. 2003, 89, 3-9.
19. Wu, X.; Freeze, H.H. GLUT14, a duplicon of GLUT3, is specifically expressed in testis as
alternative splice forms. Genomics 2002, 80, 553-557.
20. Joost, H.G.; Bell, G.I.; Best, J.D.; Birnbaum, M.J.; Charron, M.J.; Chen, Y.T.; Doege, H.; James,
D.E.; Lodish, H.; Moley, K.H.; Moley, J.F.; Mueckler, M.; Rogers, S.; Schurmann, A.; Seino, S.;
Thorens, B. Nomenclature of the GLUT/SLC2A family of sugar/polyol transport facilitators. Am.
J. Physiol. Endocrinol. Metab. 2002, 282, E974-976.
21. Wood, I.S.; Wang, B.; Lorente-Cebrián, S.; Trayhurn, P. Hypoxia increases expression of selective
facilitative glucose transporters (GLUT) and 2-deoxy-Dglucose uptake in human adipocytes.
Biochem. Biophys. Res. Comm. 2007, 361, 468-473.
22. Wright, J.R.; O'Hali, W.; Yang, H.; Bonen, A. GLUT-4 deficiency and absolute peripheral
resistance to insulin in the teleost fish tilapia. Gen. Comp. Endocrinol. 1998, 111, 20-27.
23. Teerijoki, H.; Krasnov, A.; Pitkanen, T.I.; Molsa, H. Cloning and characterization of glucose
transporter in teleost fish rainbow trout (Oncorhynchus mykiss). Biochim. Biophys. Acta 2000,
1494, 290-294.
24. Teerijoki, H.; Krasnov, A.; Pitkanen, T.I.; Molsa, H. Monosaccharide uptake in common carp
B 2001, 128, 483-491.
25. Hall, J.R.; MacCormack, T.J.; Barry, C.A.; Driezic, W.R. Sequence and expression of a constitutive,
facilitated glucose transporter (GLUT1) in Atlantic cod Gadus morhua. J. Exp. Biol. 2004, 207,
4697-4706.
26. Zhang, Z.; Wu, R.S.; Mok, H.O.; Wang, Y.; Poon, W.L.; Cheng, S.H.; Kong, R.Y. Isolation,
characterization and expression analysis of a hypoxia-responsive glucose transporter gene from
the grass carp, Ctenopharyngodon idellus. Eur. J. Biochem. 2003, 270, 3010-3017.
27. Hall, J.R.; Richards, R.C.; MacCormack, T.J.; Ewart, K.V.; Driezic, W.R. Cloning of GLUT3
cDNA from Atlantic cod Gadus morhua and expression of GLUT1 and GLUT3 in response to
hypoxia. Biochim. Biophys. Acta 2005, 1730, 245-252
28. Planas, J.V.; Capilla, E.; Gutierrez, J. Molecular identification of a glucose transporter from fish
muscle. FEBS Lett. 2000, 481, 266-270.
29. Zhou, Z.; Ren, Z.; Zeng, H.; Yao, B. Apparent digestibility of various feedstuffs for blunt snout
bream, Megalobrama amblycephala. Aquac. Nutr 2008, 4, 153-165.
30. Ren, M.C.; Liao, Y.J.; Xie, J.; Liu, B.; Zhou, Q.L.; G,e X.P.; Cui, H.H.; Pan, L.K.; Chen, R.L.
Dietary arginine requirement of juvenile blunt snout bream, Megalobrama amblycephala.
Aquaculture 2013, 414-415, 229-234.
31. Liang, H.L.; Ren, M.C.; Habte-Tsion, H.M.; Ge, X.P.; Xie, J.; Mi, H.F.; Xi, B.W.; Miao, L.H.; Liu,
B.; Zhou, Q.L.; Fang, W. Dietary arginine affects growth performance, plasma amino acid
contents and gene expressions of the TOR signaling pathway in juvenile blunt snout bream,
Megalobrama amblycephala. Aquaculture 2016, 461, 1-8.
32. Li, X.F.; Liu, W.B.; Jiang, Y.Y.; Zhu, H.; Ge, X.P. Effects of dietary protein and lipid levels in
practical diets on growth performance and body composition of blunt snout bream (Megalobrama
amblycephala) ingerlings. Aquaculture 2010, 303, 65-70.
33. Ministry of Agriculture of the People’s Republic of China, 2016: Chinese fisheries yearbook.
Chinese Agricultural Press, Beijing, China.
34. Zhou, C.P.; Ge, X.P.; Liu, B.; Xie, J.; Chen, R.L. Ren, M.C. Effect of high dietary carbohydrate on
the growth performance, blood chemistry, hepatic enzyme activities and growth hormone gene
expression of wuchang bream (megalobrama amblycephala) at two
35. James, D.E.; Brown, R.; Navarro, J.; Pilch, P.F. Insulin-regulatable tissues express a unique insulin
sensitive glucose transport protein. Nature 1988, 333, 183-185.
36. Kayano, T.; Fukumoto, H.; Eddy, R.L.; Fan, Y.S.; Byers, M.G.; Shows, T.B.; Bell, G.I. Evidence for
a family of human glucose transporter-like proteins. Sequence and gene localization of a protein
expressed in fetal skeletal muscle and other tissues. J. Biol. Chem. 1988, 263, 15245-15248.
37. Panserat, S.; Plagnes-Juan, E.; Kaushik, S. Nutritional regulation and tissue specificity of gene
expression for proteins involved in hepatic glucose metabolism in rainbow trout (Oncorhynchus
mykiss). J. Exp. Biol. 2001, 204, 2351-2360.
38. Kellett, G.L. The facilitated component of intestinal glucose absorption. J. Physiol. 2001, 531.3,
585-595.
39. Ren, M.C.; Ai, Q.H.; Mai, K.S.; Ma, H.M.; Wang, X.J. Effect of dietary carbohydrate level on
growth performance, body composition, apparent digestibility coefficient and digestive enzyme
activities of juvenile cobia, Rachycentron canadum L. Aquacult. Res. 2011, 42, 1467-1475.
40. Bergot F. Effects of dietary carbohydrate and of their mode of distribution on glycaemia in rainbow
trout (Salmo gairdneri, richardson). Comp. Biochem. Physiol. A 1979, 64, 543-547.
41. Brauge, C.; Corraze, G.; Me´dale, F. Effect of dietary levels of lipid and carbohydrate on growth
performance, body composition, nitrogen excretion and plasma glucose levels in rainbow trout
reared at 8 or 18°C. Reprod Nutr. Dev. 1995, 35, 277-290
42. Shikata, T.; Iwanaga, S.; Shimeno, S. Effects of dietary glucose, fructose and galactose on
hepatopancreatic enzyme activities and body composition in carp. Fish. Sci. 1994, 60, 613-617.
43. Lin, S.C.; Liou, C.H.; Shiau, S.Y. Renal threshold for urinary glucose excretion by tilapia in
response to orally administered carbohydrates and injected glucose. Fish Physiol. Biochem. 2000,
3, 127-132.
44. Deng, D.F.; Refstie, S.; Hung, S.S.O. Glycemic and glycosuric responses in white sturgeon
(Acipenser transmontanus) after oral administration of simple and complex carbohydrate.
Aquaculture 2001, 199, 107-117.
45. Legate, N.J.; Bonen, A.; Moon, T.W. Glucose tolerance and peripheral glucose utilization in
rainbow trout (Oncorhynchus mykiss), American eel (Anguilla rostrata), and black bullhead
catfish (Ameiurus melas). Gen. Comp. Endocrinol. 2001, 122, 48-59.
of the human glucose transporter 2 (GLUT 2) gene in the insulin-producing cell line βTC-3.
Diabetologia 1995, 38, 112-115.
47. Thorens, B.; Charron, M.J.; Lodish, H.F. Molecular physiology of glucose transporters. Diabetes
Care 1990, 13, 209-218.
48. Massa, M.L.; Gagliardino, J.J.; Francini, F. Liver glucokinase: An overview on the regulatory
mechanisms of its activity. IUBMB Life 2011, 63, 1-6.
49. Feksa, L. R.; Cornelio, A.R.; Vargas, C.R. Alanine Prevents the Inhibition of Pyruvate Kinase
Activity Caused by Tryptophan in Cerebral Cortex of Rats. Metab. Brain Dis. 2003, 18, 129-137.
50. Ferre, T.; Riu, E.; Bosch, F.; Valera, A. Evidence from transgenic mice that glucokinase is rate
limiting for glucose utilization in the liver. FASEB. 1996, J10, 1213-1218.
51. Panserat, S.; Médale, F.; Blin, C.; Brèque, J.; Vachot, C.; Plagnes-Juan, E.; Gomes,
E.; Krishnamoorthy, R.; Kaushik, S. Hepatic glucokinase is induced by dietary carbohydrate in
rainbow trout, gilthead seabream, and common carp. Am. J. Physiol. Regul. Integr. Comp. Physiol.
2000, 278, R1164.
52. Palmer, T.N.; Ryman, B.E. Studies on oral glucose intolerance in fish. J. Fish Biol. 1972, 4,
311-319.
53. Thompson, K.S.; Towle, H.C. Localization of the carbohydrate response element of the rat L-type
pyruvate kinase gene. J. Biol. Chem. 1991, 266, 8679-8682.
54. Metón, I.; Fernández, F.; Baanante, I.V. Short- and long-term effects of refeeding on key enzyme
activities in glycolysis-gluconeogenesis in the liver of gilthead seabream (Sparus aurata).
Aquaculture, 2003, 225, 99-107.
55. Metón, I.; Mediavilla, D.; Caseras, A.; Cantó, E.; Fernández, F.; Baanante, I.V. Effect of diet
composition and ration size on key enzyme activities of glycolysis-gluconeogenesis, the pentose
phosphate pathway and amino acid metabolism in liver of gilthead sea bream (Sparus aurata). Br.
J. Nutr. 1999, 82, 223-232.
56. Shimeno, S.; Takeda, M.; Takayama, S.; Fukui, A.; Sasaki, H.; Kajiyama, H. Adapatation of
hepatopancreatic enzymes to dietary carbohydrate in carp (Cyprinus carpio). Nippon Suisan
Gakkaishi 1981, 47, 71-77.
57. Yuan, X.; Zhou, Y.; Liang, X.F.; Li, J.; Liu, L.; Li, B.; He, Y.; Guo, X.; Fang, L. Molecular
of dietary carbohydrate level. Aquaculture 2013, 410-411, 32-40.
58. Likimani, T.A.; Wilson, R.P. Effects of diet on lipogenic enzyme activities in channel catfish
hepatic and adipose tissue. J. Nutr. 1982, 112, 112.
59. Dias, J.; Rueda-Jasso, R.; Panserat, S.; da Conceição, L.E.C.; Gomes, E.F.; Dinis, M.T. Effect of
dietary carbohydrate-to-lipid ratios on growth, lipid deposition and metabolic hepatic enzymes in
juvenile Senegalese sole (Solea senegalensis, Kaup). Aquac. Res. 2004, 35, 1122-1130
60. Suárez, M.D.; Sanz, A.; Bazoco, J.; García-Gallego, M. Metabolic effects of changes in the dietary
protein: carbohydrate ratio in eel (Anguilla anguilla) and trout (Oncorhynchus mykiss).
Aquaculture 2002, 10, 143-156.
61. Michael, M.D.; Kulkarni, R.N.; Postic, C.; Previs, S.F.; Shulman, G..I.; Magnuson, M.A.; Kahn,
C.R. Loss of insulin signaling in hepatocytes leads to severe insulin resistance and progressive
hepatic dysfunction. Mol. Cell 2000, 6, 87-97.
62. Hanson, R.W.; Reshef, L. Regulation of phosphoenolpyruvate carboxykinase (GTP) gene
expression. Annu. Rev. Biochem. 1997, 66, 581-611.
63. Cournarie, F.; Azzout-Marniche, D.; Foretz, M.; Guichard, C.; Ferre, P.; Foufelle, F. The inhibitory
effect of glucose on phosphoenolpyruvate carboxykinase gene expression in cultured hepatocytes
is transcriptional and requires glucose metabolism. FEBS Lett 1999, 460, 527-532.
64. Scott, D.K.; O'Doherty, R.M.; Stafford, J.M.; Newgard, C.B.; Granner, D.K. The repression of
hormone-activated PEPCK gene expression by glucose is insulin-independent but requires glucose
metabolism. J. Biol. Chem. 1998, 273, 24145.
65. Panserat, S.; Plagnes-Juan, E.; Kaushik, S. Gluconeogenic enzyme gene expression is decreased by
dietary carbohydrate in common carp (Cyprinus carpio) and gilthead seabream (Sparus aurata).
Biochim. Biophys. Acta. 2002, 1579, 35-42.
66. Yang Y. Effect of dietary carbohydrate level on growth performance and mRNA expression of
several carbohydrate metabolism genes in juvenile Darkbarbel catfish, Pelteobagrus vachelli. East
China Normal University 2011, Shanghai.
67. Panserat, S.; Plagnesjuan, E.; Brèque, J.; Kaushik, S. Hepatic phosphoenolpyruvate carboxykinase
gene expression is not repressed by dietary carbohydrate in rainbow trout (Oncorhynchus mykiss).
J. Exp. Biol. 2001, 204, 359.
glucose-6-phosphatase gene expression in liver of the gilthead sea bream (Sparus aurata). Br. J.
Nutr. 2002, 88, 607-614.
69. Panserat, S.; Médale, F.; Brèque, J.; Plagnes-Juan, E.; Kaushik, S. Lack of significant long-term
effect of dietary carbohydrate on hepatic glucose-6-phosphatase expression in rainbow trout
(Oncorhynchus mykiss). J. Nutr. Biochem. 2000, 11, 22-29.
70. Enes, P.; Panserat, S.; Kaushik, S.; Oliva-Teles, A. Effect of normal and waxy maize starch on
growth, food utilization and hepatic glucose metabolism in European sea bass (Dicentrarchus
labrax) juveniles. Comp. Biochem. Physiol. A 2006, 143, 89-96
71. Sun, S.; Gu, Z.; Fu, H.; Zhu, J.; Ge, X.; Xuan, F. Molecular cloning, characterization, and
expression analysis of p53 from the oriental river prawn, Macrobrachium nipponense, in response
to hypoxia. Fish Shellfish Immunol. 2016, 54, 68-76.
72. Habte-Tsion, H.M.; Ge, X.P.; Liu, B.; Xie, J.; Ren, M.C.; Zhou, Q.L.; Miao, L.H.; Pan, L.K.; Chen
R.L. A deficiency or an excess of dietary threonine level affects weight gain, enzyme activity,
immune response and immune-related gene expression in juvenile blunt snout bream
(Megalobrama amblycephala). Fish Shellfish Immunol. 2015, 42, 439-446.
73. Gao, Z.; Luo, W.; Liu, H.; Zeng, C.; Liu, X.; Yi, S.; Wang, W. Transcriptome Analysis and
SSR/SNP Markers Information of the Blunt Snout Bream (Megalobrama amblycephala). Plos
One 2012, 7, e42637.
74. Pfaffl, M.W. A new mathematical model for relative quantification in real-time RT-PCR. Nucleic