Second harmonic generation from phase-engineered
metasurfaces of nanoprisms
Kannta Mochizuki1, Mako Sugiura1, Hirofumi Yogo1, Stefan Lundgaard2, Jingwen Hu2, Soon Hock Ng2, Yoshiaki Nishijima3,4, Saulius Juodkazis2,4,5, Atsushi Sugita1,∗
1 Department of Applied Chemistry and Biochemical Engineering, Shizuoka University, 3-5-1 Johoku,
Hamamatsu, Shizuoka 432-8561, Japan
2 Optical Sciences Centre and ARC Training Centre in Surface Engineering for Advanced Materials (SEAM),
School of Science, Swinburne University of Technology, Hawthorn, VIC 3122, Australia
3 Department of Physics, Electrical and Computer Engineering, Graduate School of Engineering, Yokohama
National University, 79-5 Tokiwadai, Hodogaya-ku, Yokohama 240-8501, Japan
4 Institute of Advanced Sciences, Yokohama National University, 79-5 Tokiwadai, Hodogaya-ku, Yokohama
240-8501, Japan
5 World Research Hub Initiative (WRHI), School of Materials and Chemical Technology, Tokyo Institute of
Technology, 2-12-1, Ookayama, Meguro-ku, Tokyo 152-8550, Japan * Correspondence: A.S. [email protected]
Version August 10, 2020 submitted to Micromachines
Abstract: Metasurfaces of gold (Au) nanoparticles on a SiO2-Si substrate were fabricated for 1
the enhancement of second harmonic generation (SHG) using electron beam lithography and
2
lift-off. Triangular Au nanoprisms which are non-centro-symmetric and support the second- order
3
non-linearity were examined for SHG. The thickness of the SiO2spacer is shown to be an efficient 4
parameter to spectrally tune to maximise SHG. Electrical field enhancement at the fundamental
5
wavelength was shown to define the intensity of the second harmonics. Numerical modeling of
6
light enhancement was verified by experimental measurements of SHG and reflectivity spectra at
7
the normal incidence. At the plasmonic resonance, SHG is enhanced up to∼3.5×10³times for the
8
optimised conditions.
9
Keywords:metasurfaces, second harmonic generation, phase control, finite difference time domain
10
1. Introduction
11
Energy up-conversion is important for very different fields: non-linear optics (NLO) and
12
generation of higher laser harmonics, harvesting of long-wavelength, sub-bandgap energy light in
13
solar cells, and photo-thermal excitation of neurons at the near-IR transparency window in tissue [1–3].
14
Creating efficient strategies for generation of second and higher harmonics of light using non-linearχ(2) 15
andχ(3)response of metasurfaces is a recent and active line of research [4–8]. At the nanoscale, phase 16
matching conditions that are required for efficient energy transfer from the fundamental wavelengthλ 17
into higher harmonicλ/2 along the co-propagation direction is relaxed at the near-field, however, the 18
efficiency of the second harmonic generation (SHG) is low. It can only be compensated by the field
19
enhancement and geometrical factors of the nanoparticles. For example, an array of gold nano-bumps
20
made by controlled ultra-short laser pulse fabrication showed up to∼ 102times stronger SHG as 21
compared with flat film of gold [9]. The light field enhancement by nano-bumps at the fundamental
22
wavelength was defining the enhancement of SHG. Recently, we showed that the phase control of light
23
reflected and incident on a nanoparticle can enhance surface enhanced Raman scattering (SERS) [10,11].
24
This mechanism can provide an additional control for the phase sensitive SHG based on theπphase 25
change upon reflection when light travels through the low-to-high refractive index boundary and the
26
0 phase change for traversing the high-to-low interface. This mechanism based on Fresnel coefficients
27
is explored in this study together with a propagation phase control by thickness of glass layer.
28
It was shown recently that optically induced magnetization of gold nanoparticles due to the inverse
29
Faraday effect can be harnessed for non-reciprocal ultra-fast optical rotation [12]. Also, nanoparticles of
30
Ag formed by annealing of the implanted Ag+into a Pr:CaF2laser crystal host broadens and enhances 31
spectral emission of Pr3+required for a shorter laser pulse generation [13]. The use of nanoparticles
32
and nanostructures in optical control of light enhancement, propagation direction, reflection and NLO
33
effects continues to evolve and widen.
34
Here, we demonstrate that phase control of light incident and reflected from the layered silica-Si
35
structure allows controlled SHG enhancement. We fabricate and characterise metasurfaces made
36
of plasmonic nanoparticles with a controlled-thickness silica spacer layer on top of a Si substrate.
37
Numerical modeling by finite difference time domain (FDTD) was carried out to reveal characteristics
38
of light field enhancement.
39
2. Experimental
40
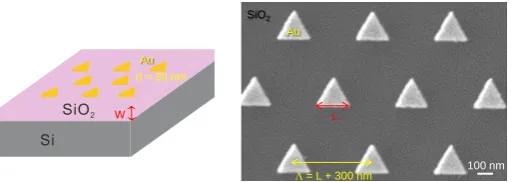
2.1. Fabrication of metasurfaces
41
Samples of plasmonic metasurfaces were prepared by standard electron beam lithography (EBL)
42
and lift-off (Fig.1). A 30-nm-thick gold film was sputtered on a triangular lattice pattern in ZEP520
43
resist. A thin film of 3 nm of Cr was deposited first for better adhesion of gold. Si(100) wafers were
44
used as a substrate withw=200 and 300 nm thermally-oxidised SiO2. 45
2.2. Characterisation of metasurfaces
46
Extinction - total losses due to absortion and scattering - was measured using a fiber-coupled
47
tungsten-halogen lamp (SLS201L/M, Thorlabs) for the white light source. For the femtosecond laser
48
radiation we used a mode-locked Ti:sapphire oscillator (Tsunami, Spectra-Physics). The oscillation
49
wavelength was tunable between 730 and 920 nm, and the pulse width and repetition rate were∼100 fs
50
and 75 MHz, respectively. Second harmonic generation (SHG) was measured under wavelength
51
tunable fs-laser irradiation of metasurfaces at normal incidence. Linear polarisation of the incident
52
light atλ = 800 nm wavelength was set either with λ/2 or λ/4-plate. The former was used for 53
rotating the polarisation direction of the linearly-polarised lights. The latter was used for converting
54
the linearly-polarised light into the circularly-polarised lights. Polarisation of second harmonic was
55
interrogated with a Glan-Taylor polariser for the linearly-polarised excitation. The combination of the
56
secondλ/4-plate and the Glan-Taylor polarised was used for analyzing the polarisation state of the 57
SHG waves converted from the circularly-polarised excitation [14].
58
100 nm
L
L = L + 300 nm W
Au
Au
SiO2
d = 30 nm
Figure 1.Schematic of the sample (left) and an SEM image of the triangle Au nanoparticles (right). The spacer of SiO2with widthw=200, 300 nm was deposited on the Si substrate to control the E-field enhancement at the plasmonic Au triangular nanoparticles. The pattern was triangular with period
200 nm
200
nm
A
A’ E –pol.
(a) (b)
E
c A-A’ (refractive index)
Si
SiO2 air
Au Plane wave
180 nm 300 nm
400 500 600 700 800 900 1000 0.0
0.5 1.0 1.5 2.0 2.5
Cross se
ction
(10
5nm 2)
Wavelength (nm)
Au nanoprism on SiO2; Si; SiO2-Si sext; ;
sabs; ; ssc; ; (c)
geo
metr
ical
SiO2: 180 nm
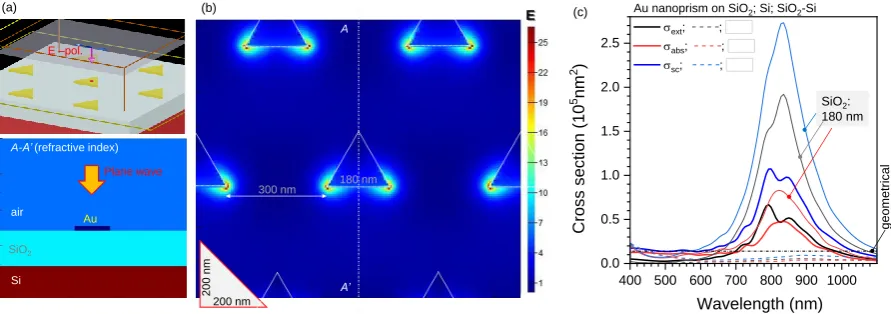
Figure 2.(a) 3D FDTD setting for calculations under linearly polarised (along x-axis) E-field; plane wave illumination. Refractive index cross section (A-A’). (b) E-field enhancement cross section at the middle-plane of 30-nm-thick Au nano-particles (15 nm above SiO2). The incident field|E|=1. The maximum field cross section shown is atλ=825 nm as in the experiment, see text for discussion. (c) Absorption, scattering and extinction cross sectionsσext=σabs+σscfor theL=180 nm nanoprism
on SiO2(solid lines; refractive indexn=1.4), Si (dashed-lines), and SiO2(w=180 nm)-on-Si; optical properties of Si were taken from the material database of Lumerical. The FDTD calculations were carried out using total-field scattered-field (TFSF) light source. Geometrical cross-section corresponds to the footprint area of the nanoprismSAu=
√ 3
4 L2≈0.1403×10⁵nm2.
The SHG signals were detected by liquid nitrogen-cooled CCD camera after being spectrally
59
resolved by multichannel spectrograph (SpectraPro SP-500, Princeton Instruments).
60
2.3. Numerical modeling
61
Numerical simulations of light field enhancement were carried out by finite difference time
62
domain (FDTD) method using Lumerical FDTD Solutions. Permittivity of Si, SiO2, and Au were taken 63
from the database included within the software. Periodic boundary conditions were used for the
64
triangular lattice pattern under auto-optimised mesh size (Fig.2(a,b)).
65
Cross sections of absorptionσabs, scatteringσscand extinction (i.e., the total lossesσext=σabs+σsc) 66
were calculated using total-field scattered-field light source (Fig.2(c)). Nanoprisms with side length of
67
L=180 nm made on SiO2or SiO2-on-Si showed strong scattering around 800 nm wavelength which 68
was used in this study for SHG from such metasurfaces. At this nanoprism size, the scattering is
69
stronger than absorbance which is also important for efficient SHG. Only a SiO2spacer thickness of 70
w=180 nm is shown in Fig.2(c) to illustrate the effect of markedly increased scattering. Nanoprisms
71
on Si had red-shifted resonance and is outside the scope of this study. It is noteworthy, that light E-field
72
enhancement is even stronger at the Au-Si interface as compared with Au-SiO2and can be useful 73
for sensor applications in the IR spectral range. These numerical estimates of light absorption and
74
scattering by single nanoprisms was encouragement to embark on fabrication of arrays with different
75
sized nanoprisms on reflective Si substrates with different SiO2spacer thicknesses. 76
3. Results and Discussion
77
The second-order NLO responses of the metal nanoparticles are expressed by the surface integral
78
of the local non-linear polarisations created on the metal surfaces [15]. The second-order NLO
79
susceptibilitiesχ(2)of the metal surfaces are predominantly determined by the surface effects [16–18]. 80
The electric-dipole type selection rule is applied for expressing the non-linear wave conversions on
81
the metal nanoparticles [19]. The geometries of the triangular nanoprisms are classified intoD3h
82
x y
Ey Ex
Ex
Ey ELHC ERHC
1 mm (a) (b)
Polarisation angle (degrees)
SH
G
Int
ens
it
y
(
arb
.
unit
s
)
Sc
at
terin
g
I
nt
ens
it
y
(
arb
.
unit
s
)
Wavelength (nm)
2w 2w
y
unit cell
w w
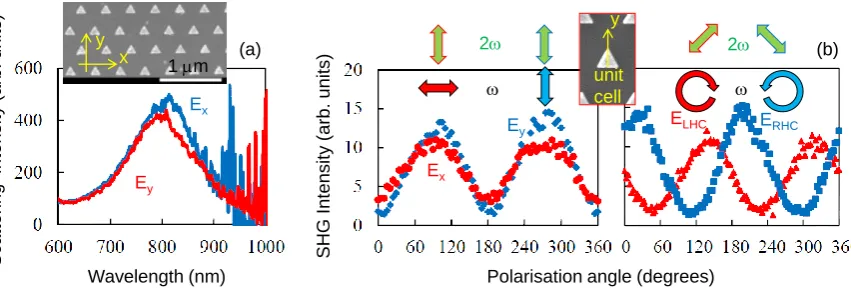
Figure 3.(a) Scattering spectrum of Au nanoprisms on glass for two polarisations in back-scattering geometry. The sizes of the nanoprism were:L=150 nm base of the equilateral triangle, 30 nm thickness, corner-to-corner separation was 250 nm. The prisms arranged two-dimensionally in a trigonal lattice (see SEM image in inset). (b) Polarisation-resolved SHG (2ω) at 800 nm (ω) excitation for different linear and the circular (left- and right-hand) polarisations of excitation in back-scattering/reflection geometry. SHG was y-polarised for different angles of orientation of the incident linearly polarised light (ω). SHG was linearly polarised at±45◦from y-axis for the LHC and RHC excitation (ω).
x and y-directions are defined as the base and height directions of the triangular nanoprisms. The
84
field distributions calculated by FDTD distributions were symmetric in the y-axis for both of the
85
pump polarisation geometries and asymmetric in the x-axis. Thus, the SHG emissions along the
86
y-axis was related to breaking symmetry in the x-directions of the electric field, hence, the non-linear
87
tensor componentsχ(yxx2) andχ(yyy2) were responsible for the second-order non-linearities. Next, we 88
tested experimentally the angular dependence of scattering at different excitation wavelengths and
89
polarisation dependence at the maximum of the SHG at 800 nm for nanoprisms on glass samples.
90
3.1. Au triangular nanoprisms on glass
91
Figure3shows the scattering spectrum from the Au nanoprisms. The scattering spectra were
92
probed by light with polarisations either parallel or perpendicular to the baselines of nanoprisms
93
(x- and y-pol. respectively). The spectral shape of the scattering signal was independent on the
94
polarisation direction of the probe light and peaked at 800 nm. The linear optical properties of the
95
nanoprisms were isotropic. Independent of the polarisation of the excitation, the Au nanorods emitted
96
the SHG at polarisation perpendicular to the baseline of the triangular nanoprism (Fig.3(b)). The SHG
97
spectroscopy was performed for the nanoprisms with right- and left-handed circular (RHC, LHC)
98
polarised excitation.
99
The SHG intensities transmitted continuously through theλ/4-plate and the polariser was the 100
highest at +45◦for the LHC excitation and -45◦ for the RHC (Fig.3(b)). The form of the nonlinear
101
susceptibility tensor for theD3hsymmetry demands that the circularly-polarised fundamental light
102
waves are converted into the circularly-polarised SHG waves. The rotation direction of the SHG waves
103
had to be opposite to that of the fundamental. The polarisation state observed byλ/4-plate and the 104
Glan-Taylor prism is consistent with the expectation imposed by the tensor form for the structures
105
with theD3hsymmetry [14].
106
Next, we investigate how SHG can be controlled by increasing light field enhancement at the excitation
107
wavelength.
108
3.2. Au triangular nanoprisms on Si with SiO2spacer 109
Triangular nanoprisms with different side length fromL=120 to 140 nm were fabricated on a
110
strongly reflective Si substrate with two different SiO2spacer thicknesses ofw=200 nm and 300 nm 111
(Fig.1).
L=160 nm
L=180 nm L=200 nm L=220 nm
L=120 nm L=140 nm
Si
SiO2/Si
Au/SiO2/Si
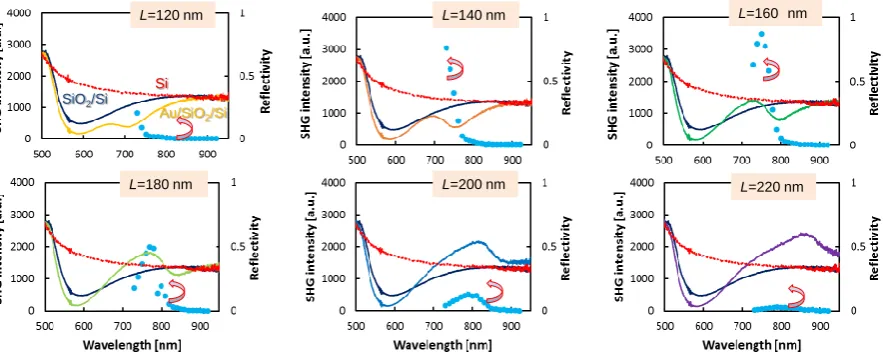
Figure 4.Plots showing experimentally measured SHG excitation spectra from metasurfaces (cyan dots, left-axis) of Au triangular nanoparticles on a SiO2/Si substrate with triangle side-lengths,L=120 nm to 220 nm. Reflectivity spectraR(λ)(right-axis) are shown for bare Si, Si with SiO2, and the metasurface for each plot. The SiO2 spacer width was the samew = 300 nm (see Fig.A1forw = 200 nm). Polarisation of the incident field was horizontalEx.
Figures4(also, see Fig. A1) summarise reflectivity and SHG results from metasurfaces with
113
different side lengthLof nanoprisms. The largest spectral sensitivity of SHG vs size of nanoprism
114
Lwas observed for the thickerw=300 nm spacer (Fig.4). For thinnerw=200 nm, the SHG from
115
L=120 and 140 nm metasurfaces was measurable but at the level of tens-of-counts (Fig.A1) and the
116
strongest SHG was observed forL=220 nm. It is instructive to compare spectral SHG response with
117
reflectivity spectrum. An increase of SHG was observed when the SiO2spacer conferred anti-reflective 118
properties to the surface (Rsmaller as compared with bare Si). The reflectivity of a metasurface with
119
Au nanoprisms is defined by the geometry: period and size of nanoparticles. At peak reflectivity of
120
the fundamental wavelength, the strongest SHG was observed. FDTD simulations confirmed this
121
observation (Fig.2(b) shows the maximum SHG atλ=825 nm). Forw=200 nm, SHG was enhanced 122
for larger nanoprismsL≥180 nm (Fig.A1). Larger triangles formed a larger unit cell of the triangular
123
lattice, hence, the increase of SHG is affected as the ratio of metal area per unit cell, i.e.,SAu/Scell≡ L 2 2Λ2, 124
whereΛ=L+300 nm for the data shown in Figs.4,A1.
125
On the resonance at maximum reflectivity, SHG was enhanced more than 3×10³times as compared
126
with the non-resonant case (Fig.4). Also, the maximum of SHG was observed at shorter wavelengths.
127
Obviously the effect of the spacer as a phase retarder for the light reflected from Si on a path to
128
the nanoprism and positively interfering with incident and reflected light from the top of the SiO2 129
layer is an important factor. Although the Au nanoprisms were made on Si substrates without SiO2 130
spacer, the plasmonic responses were not observed in the present spectral window due to a high∼3.7
131
refractive index of Si causing the localized surface plasmon resonance condition satisfied at much
132
longer wavelengths.
133
The maximum of SHG had well defined optimal conditions which corresponded toL=160 nm
134
andw = 300 nm. FDTD calculations confirmed the strongest light enhancement occurring at the
135
tips of nanoprisms observed at the experimentally determined maximum of SHG enhancement.
136
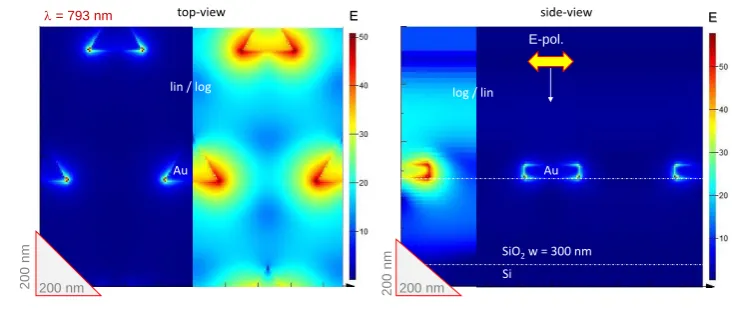
Figure5shows the light field enhancement close to the peak wavelength of SHG forL = 180 nm.
137
The enhancement of the E-field more than 50 times was observed and was located at the silica-Au
138
interface. It is noteworthy that the absolute values of enhancement obtained by FDTD should not
139
be considered due to ideal geometrical structures and interfaces being different due to fabrication
140
tolerances [21,22]. The side-view FDTD cross section (Fig.5) reveals that some of incident light is
141
scattered at larger angles from the direction of propagation at the edges/corners of the nanoprisms.
142
This facilitates light trapping in silica (between air and Si) which contributes to light enhancement at
side-view top-view 200 nm 20 0 nm E-pol.
l= 793 nm E E
lin / log log / lin
200 nm
20
0
nm
Si
SiO2w = 300 nm Au Au
Figure 5.FDTD at the maximum E-field enhancement forL=180 nm andw=300 nm (see Fig.4). The top-view monitor is at the air-silica interface and the side-view monitor crosses the side of triangle and vertexes with the highest field enhancement. The E-field scale bars are linear; polarisation of incident field was horizontalEx.
500 600 700 800 900 1000 0.0 0.2 0.4 0.6 0.8 R e fl e ct ivi ty Wavelength (nm) (b) L=180 nm, w=300 nm
500 600 700 800 900 1000 0.0 0.2 0.4 0.6 0.8 R e fl e ct ivi ty Wavelength (nm) (a) L=180 nm, w=200 nm
500 600 700 800 900 1000 0.0 0.2 0.4 0.6 0.8 R e fl e ct ivi ty Wavelength (nm) (b) L=180 nm, w=300 nm
500 600 700 800 900 1000 0.0 0.2 0.4 0.6 0.8 R e fl e ct ivi ty Wavelength (nm) (a) L=180 nm, w=200 nm
(a) (b)
FDTD
Exp.
500 600 700 800 900 1000 0.0 0.2 0.4 0.6 0.8 R e fl e ct ivi ty Wavelength (nm) (b) L=180 nm, w=300 nm
500 600 700 800 900 1000 0.0 0.2 0.4 0.6 0.8 R e fl e ct ivi ty Wavelength (nm) (a) L=180 nm, w=200 nm
Figure 6.Experimental (Exp; red) and calculated (FDTD; dashed) reflectivity spectra of Au nanoprisms withL=180 nm side length. The thicknesses of the SiO2spacer were (a)w=200 nm and (b) 300 nm.
neighbouring nanoprisms.
144
The maximum of SHG is red-shifted for larger nano-triangles. This tendency was confirmed by FDTD
145
simulations (Fig.A2). The maximum of E-field enhancement was observed at 924 nm wavelength
146
(L = 220 nm) as compared with 825 nm for theL = 180 nm. The pattern of E-field enhancement
147
was qualitative same, the vertexes of equal-side triangles which are aligned to the polarisation of
148
incident plane wave are enhanced. The peak enhancement up toE=30 times was observed at the
149
maximum (incident fieldE=1). Side-view of E-field distribution shows even stronger localization at
150
the SiO2-air-Au point (note, the lateral cross sections are shown at 15 nm above the interface at the 151
middle thickness of Au nanoparticle). These locations of largest E-field locatization at the interface are
152
locations for SHG. From the side-view image it is also clear that some light was deposited into the
153
SiO2spacer which also facilitates field enhancement at the neighbouring nanoparticles. 154
Figure6shows direct comparison between experimentally measured reflectivity Rtogether with
155
FDTD numerical results for the two tested spacer thicknesses. Maximum ofRwas a good predictor
156
for the most efficient SHG and a good match between theoretical estimates and experimentally
157
measuredRvalues was observed at the peak of SHG. It could be envisaged that by using different
158
2D and 3D nanofabrication techniques including direct laser writing [23–26] it should be possible
159
to inscribe non-centrosymmetric patterns into the interface or fill by NLO polymers rendering
160
such meta-surfaces/materials as efficient SHG materials [27]. The use of reflective plasmonic
161
non-centrosymmetric patterns are very promising for nanoscale engineering of SHG [28,29]. The
162
presented triangular symmetricD3hpattern of nanoprisms can be used to enhance SHG from 2D
163
photo and thermally induced material re-organisation can be used for breaking usually random
165
orientation and symmetry of polymers to make them active for SHG [31]. Use of anisotropic
166
bio-polymers such as silk [32] and nanocellulose [33] and their polymer composites is another way to
167
make host materials for the anisotropic light-matter interaction required for SGH.
168
4. Conclusions and Outlook
169
It is demonstrated that SHG from non-centro-symmetric triangular nanoprisms can be enhanced
170
using a SiO2 spacer between the nanoprisms and Si substrate. Experimental results proved that 171
the Au nanoprisms are well suited for harnessing second-order non-linearities at normal incidence
172
conditions at the nanoscale. The polarisation dependence of SHG showed that at the linearly polarised
173
fundamental wave the SHG was always y-polarised, independent of the polarisation of the excitation
174
light. For the circularly polarised excitation, the SHG was also circularly polarised with the handedness
175
opposite to the excitation light as expected from theD3hsymmetry.
176
By optimising the thickness of the SiO2spacer it is possible to maximise SHG generation by 177
several orders of magnitude. It is expected that this method will allow achievement of high yield SHG
178
from films of non-linear optical (NLO) materials placed on metasurfaces:I(2ω)∝|χmeta(2) +χ(NLO2) × 179
dNLO|2I2(ω), whereI(ω)is light intensity at the fundamental wavelength (λ = 2πc/ω) which is 180
locally enhanced at the nanoscale on the nanoprisms,dNLOis the thickness of the non-linear optical 181
material which is expected to be thin for best harvesting of the local field enhancement. Metasurfaces
182
of nanoparticles are expected to be able to withstand higher light intensities without degradation
183
and has to be investigated next. As polymers enters the second century of their development [34], a
184
combination of new polymers with augmented functionalities and metasurfaces will bring new science
185
and applications.
186
Author Contributions: Conceptualisation, A.S; methodology, A.S.; validation, A.S.,S.J.; formal analysis, A.S.;
187
investigation (experimental), K.M., M.S., H.Y.; investigation (numerical) M.S., S. L., J.H. S.H.N.; resources, A.S.;
188
data curation, A.S., S.H.N., Y.N.; writing—original draft preparation, A.S., S.J.; writing—review and editing, all
189
the authors; visualisation, K.M., H.Y.; supervision, A.S.; project administration, A.S.; funding acquisition, A.S.
190
Funding:This work was supported by Nippon Sheet Glass Co., Ltd. grant, JST CREST Grant Number JPMJCR19I3,
191
Japan and the ARC Discovery DP190103284 and Linkage LP190100505 grants.
192
Acknowledgments:Support of operational costs of the Nanotechnology facility (2016-2019) by Swinburne Univ.
193
Technol. is acknowledged. Visits of Shizuoka University students to present their research at the student research
194
biannual workshop “Fast-Small”, Swinburne 2012-19 were supported by the SSSV (Exhibition of Laboratory
195
Exchange Program) program of Shizuoka Univ. MS is grateful for the support from Shizuoka Univ. for a research
196
stay at Swinburne Univ. in 2019-20.
197
Conflicts of Interest:The authors declare no conflict of interest.
198
Appendix A Reflection and SHG spectra forw=200nm SiO2on Si
199
Experimental spectra of reflectivity and SHG are overlayed for the metasurfaces with the side
200
length of the nanoprism ranging fromL = 120 nm to 220 nm for the SiO2spacedw = 200 nm in 201
Fig.A1(see main text forw=300 nm in Fig.4).
202
FigureA2presents summary a of FDTD modeling of the light field enhancement for thew =
203
200 nm SiO2spacer at several wavelengths. The inset “ray-box” shows schematics of interference 204
taking place on the front surface as addition of the SiO2-reflected and Si-reflected rays. Each of them 205
experienceπ phase shift due to reflectance from the medium with a higher refractive index. The 206
Si-reflected ray has additional propagation phase traversing the SiO2spacer twice. When the spacer is 207
close to theλ/4 condition, a constructive E-field addition takes place on the air-SiO2surface (where 208
Au nanoprisms are positioned). The actual field values depend on the Fresnel coefficients, which
209
are, in turn, incidence angle dependent. This interference and phase matching is the physical reason
210
for the increased SHG efficiency with the optimised thickness of SiO2spacer aroundw=300 m [10]. 211
Such description is strictly valid for the optical far-field representation of reflection and the actual
212
near-field conditions where diffraction from the Au nanoprisms is taking place is accounted for in the
L=160 nm
L=180 nm L=200 nm L=220 nm
L=120 nm L=140 nm
Si
SiO2/Si Au/SiO2/Si
Figure A1.Plots showing experimentally measured SHG excitation spectra from metasurfaces (cyan dots, left-axis) of Au triangular nanoparticles on a SiO2/Si substrate with triangle side-lengths,L= 120 nm to 220 nm. Reflectivity spectraR(λ)(right-axis) are shown for bare Si, Si with SiO2, and the metasurface for each plot. The SiO2spacer width was the samew = 200 nm. Polarisation of the incident field was horizontalEx.
A-A’ (side-view)
A A’ top-view
E E
Si
SiO2
air
Au Au
200 nm
20
0
nm
Au
(a) (b)
200 nm
E-pol.
E-pol. E
l = 825 nm
l = 871 nm
l = 924 nm
Ei(0) Er(0+p)
Et(0)
~
l
/4
n = 1
n = 1.4
n = 3.5 Ray-box
Figure A2. FDTD simulations for the L = 220 nmw = 200 nm case. (a) E-field enhancement at
λ=825 nm (see Fig.2(b) for comparison) and 871 nm which are close-to-maximum. (b) Top- and side views of E-field enhancement for a linearly polarised plane wave. Refractive index cross-section is shown on right-side to distinguish the lateral cross-sections. Note, the cross-sectionA-A’is made though the center of triangle and not at the largest intensity vertexes. Incident light hasExpolarisation.
Inset “ray-box” shows schematically the phase change upon reflection from interfaces for the incident, transmitted and reflected E-fieldsEi,t,r in ray optics presentation [10]. In addition to the Fresnel
coefficient defined phase changes, a propagation phase is adding up and amounts toπfor traversing a
λ/4 thickness twice upon back-reflection from Si.
FDTD simulations. More systematic studies are required for the dependence of SHG from the spacer
214
thicknessw. Here, only two thicknessesw=200 nm and 300 nm were tested.
215
References
216
1. Sun, Q.C.; Ding, Y.C.; Sagar, D.M.; Nagpal, P. Photon upconversion towards applications in energy
217
conversion and bioimaging. Progr. Surface Sci.2017,92, 281–316.
2. Wen, S.; Zhou, J.; Schuck, P.J.; Suh, Y.D.; Schmidt, T.W.; Jin, D. Future and challenges for hybrid
219
upconversion nanosystems. Nature Photonics2019,13, 828–838.
220
3. Zhou, J.; Chizhik, A.I.; Chu, S.; Jin, D. Single-particle spectroscopy for functional nanomaterials. Nature 221
2020,579, 41–50.
222
4. Aouani, H.; Rahmani, M.; Navarro-Cía, M.; Maier, S.A. Third-harmonic-upconversion enhancement from
223
a single semiconductor nanoparticle coupled to a plasmonic antenna.Nature Nanotech.2014,9, 290–294.
224
5. Kauranen, M.; Zayats, A.V. Nonlinear plasmonics. Nano Lett.2012,6, 737–748.
225
6. Butet, J.; Brevet, P.R.; Martin, O.J.F. Optical second harmonic generation in plasmonic nanostructures: from
226
fundamental principles to advanced applications.ACSNano2015,9, 10545–10562.
227
7. Krasnok, A.; Tymchenko, M.; Alù, A. Nonlinear metasurfaces: a paradigm shift in nonlinear optics.
228
Materials Today2014,21, 8–21.
229
8. Guixin, L.; Shuang, Z.; Thomas, Z. Nonlinear photonic metasurfaces.Nat. Rev. Mater.2017,2, 17010.
230
9. Cherepakhin, A.B.; Pavlov, D.V.; Shishkin, I.I.; Voroshilov, P.M.; Juodkazis, S.; Makarov, S.V.; Kuchmizhak,
231
A.A. Laser-printed hollow nanostructures for nonlinear plasmonics.Appl. Phys. Lett.2020,117, 041108.
232
10. Zheng, Y.; Rosa, L.; Thai, T.; Ng, S.H.; Juodkazis, S.; Bach, U. Phase controlled SERS enhancement. Sci. 233
Reports2019,9, 744.
234
11. Jayawardhana, S.; Rosa, L.; Juodkazis, S.; Stoddart, P.R. Additional Enhancement of Electric Field in
235
Surface-Enhanced Raman Scattering due to Fresnel Mechanism. Sci. Rep.2013,3, 2335.
236
12. Cheng, O.H.C.; Son, D.H.; Sheldon, M. Light-induced magnetism in plasmonic gold nanoparticles. Nature 237
Photonics2020,14, 365–368.
238
13. Nie, W.; Jiang, S.; Li, R.; Ren, F.; Clayton, A.; Juodkazis, S.; Chen, F. Plasmon-induced photoluminescence
239
and Raman enhancement in Pr:CaF2crystal by embedded silver nanoparticles. Appl. Surf. Sci. 2020, 240
530, 147018.
241
14. Konishi, K.; Higuchi, T.; Li, J.; Larsson, J.; Ishii, S.; Kuwata-Gonokami, M. Polarization-Controlled Circular
242
Second-Harmonic Generation from Metal Hole Arrays with Threefold Rotational Symmetry.Phys. Rev. Sci. 243
Lett.2014,112, 135502.
244
15. O’Brien, K.; Suchowski, H.; Rho, J.; Salandrino, A.; Kante, B.; Yin, X.; Zhang, X. Predicting nonlinear
245
properties of metamaterials from the linear response.Nature Mater.2015,14, 379–383.
246
16. Wang, F.X.; Rodriguez, F.J.; Albers, W.M.; Ahorinta, R.; Sipe, J.E.; Kauranen, M. Surface and bulk
247
contribution to the second-order nonlinear optical response of a gold film. Phys. Rev. B2009,80, 233402.
248
17. Sipe, J.E.; So, V.C.Y.; Fukui, M.; Stegemann, G.I. Analysis of second-harfnonic generation at metal surfaces.
249
Phys. Rev B1980,21, 4389–4402.
250
18. Maytorena, J.A.; Mochan, W.L.; Mendoza, B.S. Hydrodynamic model for second-harmonic generation at
251
conductor surfaces with continuous profiles. Phys. Rev B1995,51, 2556–2562.
252
19. Canfield, B.K.; Husu, H.; Laukkanen, J.; Bai, B.; Kuittinen, M.; Turunen, J.; Kauranen, M. Local Field
253
Asymmetry Drives Second-Harmonic Generation in Noncentrosymmetric Nanodimers. Nano Lett.2007,
254
7, 1251–1255.
255
20. Boyd, R.W., Nonlinear Optics; Academic press: Cambridge, Massachusetts, 2008; chapter 1. The nonlinear
256
optical susceptibility, p. 1.
257
21. Nishijima, Y.; Balcytis, A.; Naganuma, S.; Seniutinas, G.; Juodkazis, S. Tailoring metal and insulator
258
contributions in plasmonic perfect absorber metasurfaces. ACS Appl. Nano Mater.2018,1, 3557–3564.
259
22. To, N.; Nishijima, Y.; Juodkazis, S. Detailed Experiment-Theory Comparison of Mid-Infrared Metasurface
260
Perfect Absorbers. Micromachines2020,11, 409.
261
23. Yamasaki, K.; Juodkazis, S.; Matsuo, S.; Misawa, H. Three-dimensional microchannels in polymers: one
262
step fabrication. Appl. Phys. A2003,77, 371–373.
263
24. Buividas, R.; Rekštyt ˙e, S.; Malinauskas, M.; Juodkazis, S. Nano-groove and 3D fabrication by controlled
264
avalanche using femtosecond laser pulses.Opt. Mat. Express2013,3, 1674–1686.
265
25. Seet, K.K.; Mizeikis, V.; Juodkazis, S.; Misawa, H. Three-Dimensional Horizontal Circular Spirals Photonic
266
Crystals with stop gaps below 1µm. Appl. Phys. Lett.2006,88, 221101. 267
26. Li, Z.Z.; Wang, L.; Fan, H.; Yu, Y.H.; Chen, Q.D.; Juodkazis, S.; Sun, H.B. O-FIB: far-field-induced near-field
268
breakdown for direct nanowriting in an atmospheric environment. Light: Sci. Appl.2020,9, 052003.
27. Sugita, A.; Ito, K.; Sato, Y.; Suzuki, R.; Sato, K.; Narumi, T.; Mase, N.; Takano, Y.; Matsushita, T.; Tasaka,
270
S.; Kawata, Y. The role of chemisorption for push-pull chromophores on SiO2surfaces in non-electrically 271
poling host-guest NLO polymers.J Photochem Photobiol A: Chem.2017,340, 35–45.
272
28. Yogo, H.; Matsui, T.; Nihashi, S.; Hirabayashi, T.; Inami, W.; Ono, A.; Kawata, Y.; Sugita, A. Polarized
273
second-harmonic-generation spectroscopy for Au nanorods arrayed on SiO2substrates at localized surface 274
plasmon resonances. Jpn J Appl Phys2017,56, 122002.
275
29. Sugita, A.; Kaname, S.; Mochizuki, K.; Kikuchi, K.; Ono, A.; Inami, W.; Kawata, Y. Second harmonic
276
conversions of surface-plasmon-polariton-enhanced optical fields in nonlinear optics polymer/Ag/glass
277
structures. Phys Rev B2020,101, 045303.
278
30. Rosa, H.G.; Ho, Y.W.; Verzhbitskiy, I.; Rodrigues, M.; Taniguchi, T.; Watanabe, K.; Eda, G.; Pereira, V.M.;
279
Gomes, J. Characterization of the second- and third-harmonic optical susceptibilities of atomically thin
280
tungsten diselenide. Sci. Reports2018,8, 10035.
281
31. Makihara, K.; Kaneta, D.; Iwamura, T.; Sugita, A.; Leproux, P.; Couderc, V.; Kano, H. Photo-induced
282
meta-stable polar conformations in polystyrene microspheres revealed by time-resolved SHG microscopy.
283
Appl Phys Express2020,13, 052003.
284
32. Ryu, M.; Honda, R.; Reich, A.; Cernescu, A.; Li, J.L.; Hu, J.; Juodkazis, S.; Morikawa, J. Near-Field IR
285
Orientational Spectroscopy of Silk. Appl. Sci.2019,9, 3991.
286
33. Fujisawa, H.; Ryu, M.; Lundgaard, S.; Linklater, D.P.; Ivanova, E.P.; Nishijima, Y.; Juodkazis, S.; Morikawa,
287
J. Direct Measurement of Temperature Diffusivity of Nanocellulose-Doped Biodegradable Composite
288
Films. Micromachines2020,11, 738.
289
34. Abd-El-Aziz, A.S.; Antonietti, M.; Barner-Kowollik, C.; Binder, W.H.; Böker, A.; Boyer, C.; Buchmeiser,
290
M.R.; Cheng, S.Z.D.; D’Agosto, F.; Floudas, G.; Frey, H.; Galli, G.; Genzer, J.; Hartmann, L.; Hoogenboom,
291
R.; Ishizone, T.; Kaplan, D.L.; Leclerc, M.; Lendlein, A.; Liu, B.; Long, T.E.; Ludwigs, S.; Lutz, J.F.;
292
Matyjaszewski, K.; Meier, M.; Müllen, K.; Müllner, M.; Rieger, B.; Russell, T.P.; Savin, D.A.; Schlüter, A.D.;
293
Schubert, U.S.; Seiffert, S.; Severing, K.; Soares, J.; Staffilani, M.; Sumerlin, B.; Sun, Y.; Tang, B.; Tang, C.;
294
Théato, P.; Tirelli, N.; Tsui, O.; Unterlass, M.; Vana, P.; Voit, B.; Vyazovkin, S.; Weder, C.; Wiesner, U.; Wong,
295
W.Y.; Wu, C.; Yagci, Y.; Yuan, J.; Zhang, G. The Next 100 Years of Polymer Science. Macromol. Chem. Phys. 296
2020,2020, 2000216.
297
c
2020 by the authors. Submitted to Micromachines for possible open access publication
298
under the terms and conditions of the Creative Commons Attribution (CC BY) license
299
(http://creativecommons.org/licenses/by/4.0/).