Department of Agriculture and Fisheries
CS7939 05/18
© State of Queensland, 2018.
The Queensland Government supports and encourages the dissemination and exchange of its information. The copyright in this publication is licensed under a Creative Commons Attribution 4.0 International (CC BY 4.0) licence.
Under this licence you are free, without having to seek our permission, to use this publication in accordance with the licence terms.
You must keep intact the copyright notice and attribute the State of Queensland as the source of the publication.
Note: Some content in this publication may have different licence terms as indicated. For more information on this licence, visit https://creativecommons.org/licenses/by/4.0/.
Department of Agriculture and Fisheries
* DAF, AgTrends, <https://www.daf.qld.gov.au/business-trade/agtrends>.
^ ABS 6291.0.55.003, Labour force, Australia, detailed, quarterly, Nov. 2017, <http://www.abs.gov.au/ausstats/[email protected]/
mf/6291.0.55.003>.
± Queensland Government Statistician, <
https://www.treasury.qld.gov.au/economy-and-budget/queensland-economy/statistics-and-indicators/>
§ ABS 7121.0, Agricultural commodities, Australia, 2015–16, <http://www.abs.gov.au/ausstats/[email protected]/mf/7121.0>.
Minister’s foreword
Since the very beginning of our state, agriculture has been part of the Queensland way of life and a vital part of our economy.
The total value of Queensland’s primary industry output is forecast to be $20 billion in 2017–18. Even though much of the state is drought-declared, this is a significant increase of 11% over the 5-year average.
This report provides a snapshot of Queensland’s agriculture and food industry sector—its performance, its place in the
orld, its relationship with the broader economy and society, and the issues it faces.
This snapshot identifies the outstanding opportunities available to the sector with the emergence of a food culture and an increasingly prosperous global market that values safe, ethical and sustainable produce. In pursuing these opportunities, the sector has two overriding strengths.
The first strength is its diversity. The resource base of the sector is extremely diverse, operating in a wide range of climates and on a wide range of soil types. Its pattern of production is diverse, with dozens of different food and fibre products produced commercially. The business structures and the people are diverse, with a broad set of relevant skills, attributes and knowledge. In diversity lies strength and resilience.
The second strength is that the agriculture and food sector in Queensland is very much part of the modern economy and society. It is innovative—trend productivity growth in the sector exceeds that in the broader economy. The sector is responsive to customers’ demands.
Behind all of this are decades of government support for the sector. Government support for research, development and extension underpins innovation in the sector. Biosecurity Queensland underpins the sector’s clean and green image—and its clean and green reality. Primary producers are assisted through the inevitable natural disasters. The sector has access to high-quality infrastructure and a high-quality education and training system. The direction of government policy in recent years has been to remove obstacles to innovation and to support innovation and growth.
This snapshot complements the Queensland Government’s strategies for the sector.
These are outlined in the Agriculture and food research, development and extension
10-year roadmap and action plan, the Queensland biosecurity strategy: our next five years 2017–2022 and the Queensland sustainable fisheries strategy 2017–2027.
The snapshot will be of interest to all those associated with Queensland’s agriculture and food sector. It will be particularly useful for those who are thinking of getting involved— potential investors, people thinking of a career in the sector, and policymakers in the public and private sectors. I commend it to you.
Honourable Mark Furner MP Minister for Agricultural Industry Development and Fisheries
Contents
Minister’s foreword iii
Introduction 1
The land 1
Our climate 3
What we produce 4
When we produce it 6
Our place in the world 7
Our businesses 10
Our people 11
Our opportunities 13
Support 16
Biosecurity 16
Food safety 16
Research, development and extension 16
Investment 16
Climate variability 16
Education and training 17
Regulation 17
A closer look 18
Land and natural resources 18
Implications of climate change 18
Water 19 Soils 23 Biosecurity 23
Agriculture and the environment 24
Regional communities and economies 24
Production costs and infrastructure 26
Costs 26
Prices paid and received 27
Productivity and innovation 34 Trends 34
Technological change 35
Entrepreneurship 36 Adjustment 36 Innovation 36 Investment 37
R&D support 38
Outlook 40 Summary 40
Meat products 40
Dairy 40 Horticulture 41 Sugar 41
Cotton and wool 41
Cereals and related products 42
Forestry and timber 42
Fisheries and seafood 42
Introduction
The agricultural, forestry, fishing and food industries are central to the Australian state of Queensland.
• They are central to our culture, lifestyle and history. Primary exports from Queensland
extend back centuries; the industries were the mainstay of early European settlement and were the basis for the formation of our main political parties.
• They are central to our economy. These industries produce around $20 billion in output
each year, over half of which is exported. They provide more than 17% of the state’s overseas exports of goods.
• They are central to our society. The industries directly employ more than 100 000 of us
(more than 4% of our workforce).
• They are central to our regions. Queensland is the most decentralised of Australia’s
mainland states. The industries are important to all regions, but are particularly important in Darling Downs – Maranoa, Outback Queensland and Wide Bay, where they provide more than 10% of direct employment.
• They are central to our environment. Queensland’s primary industries use 152 million
hectares of land (88% of our total land area).
• They are central to our place in the world. Queensland’s population of just under
5 million people (less than 0.1% of the world’s population) produce 0.4% of the world’s food supply and nearly 1% of the world’s agricultural exports, from 1% of the world’s total land area.
This snapshot of the industries is intended for anyone interested in Queensland’s agriculture and food sector. It is particularly targeted to those who may be thinking of contributing to the future of the sector—as investors, employees, suppliers, buyers, analysts or leaders. It draws on information from many sources including the Queensland Department of Agriculture and Fisheries (DAF). For more information, visit our website at www.daf.qld.gov.au.
The land
! ! ! ! ! ! ! ! ! ! ! ! ! ! ! ! ! ! ! ! ! ! ! ! ! Roma Weipa Bowen Gympie Mackay Cairns Nambour Emerald Biloela Kingaroy Cooktown Brisbane Toowoomba St George Longreach Burketown Mount Isa Gladstone Bundaberg Gold Coast Cunnamulla Townsville Goondiwindi Charleville Rockhampton 153°0'0"E 153°0'0"E 152°0'0"E 152°0'0"E 151°0'0"E 151°0'0"E 150°0'0"E 150°0'0"E 149°0'0"E 149°0'0"E 148°0'0"E 148°0'0"E 147°0'0"E 147°0'0"E 146°0'0"E 146°0'0"E 145°0'0"E 145°0'0"E 144°0'0"E 144°0'0"E 143°0'0"E 143°0'0"E 142°0'0"E 142°0'0"E 141°0'0"E 141°0'0"E 140°0'0"E 140°0'0"E 139°0'0"E 139°0'0"E 138°0'0"E 138°0'0"E 1 0 °0 '0 "S 1 0 °0 '0 "S 1 1 °0 '0 "S 1 1 °0 '0 "S 1 2 °0 '0 "S 1 2 °0 '0 "S 1 3 °0 '0 "S 1 3 °0 '0 "S 1 4 °0 '0 "S 1 4 °0 '0 "S 1 5 °0 '0 "S 1 5 °0 '0 "S 1 6 °0 '0 "S 1 6 °0 '0 "S 1 7 °0 '0 "S 1 7 °0 '0 "S 1 8 °0 '0 "S 1 8 °0 '0 "S 1 9 °0 '0 "S 1 9 °0 '0 "S 2 0 °0 '0 "S 2 0 °0 '0 "S 2 1 °0 '0 "S 2 1 °0 '0 "S 2 2 °0 '0 "S 2 2 °0 '0 "S 2 3 °0 '0 "S 2 3 °0 '0 "S 2 4 °0 '0 "S 2 4 °0 '0 "S 2 5 °0 '0 "S 2 5 °0 '0 "S 2 6 °0 '0 "S 2 6 °0 '0 "S 2 7 °0 '0 "S 2 7 °0 '0 "S 2 8 °0 '0 "S 2 8 °0 '0 "S 2 9 °0 '0 "S 2 9 °0 '0 "S Locality map Legend Sugar Cropping Irrigated cropping Grazing
Intensive animal production Annual horticulture
Perennial horticulture Water
Mining Nature conservation Other land uses Defence
Current forestry plantations
State Forests or Timber Reserves
Region boundaries
Queensland Current landuse Based on QLUMP data and other data sources
for forestry
±
0 50 100 200 300 400 km
1:6,600,000
Datum: GDA 94 Projection: Geographic Page size: A4
New South Wales South Australia N o rt h e rn T e rr it o ry
Data Sources under licence from : © Commonwealth of Australia (2017) © Geoscience Australia (2017) © The State of Queensland (2017) - Department of Natural Resources and Mines - Department of Agriculture and Fisheries - Department of Science, IT and Innovation
Figure 1 Current land use in Queensland
Source: DAF 2013, Queensland agricultural land audit, <https://www.daf.qld.gov.au/environment/ag-land-
Table 1 Land use in Queensland
Our climate
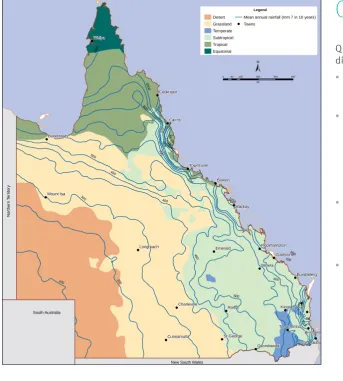
Queensland’s climate (Figure 2) is diverse, variable and changing.
• We have mostly warm to hot
temperatures, but some temperate areas in the south.
• Rainfall ranges from high in the
north (3200 millimetres annual average), to moderate
on the south coast
(1000 millimetres) and over the range (700 millimetres), to low in the west (less than 2 millimetres).
• Cyclones can cause damage on
the coast, but are a major source of rainfall for the dry inland areas, which are also prone to long periods of very dry conditions.
• Climate models suggest that global
warming is decreasing expected rainfall over most of Queensland. However, rainfall in some regions may be increasing. Climate variability is also increasing in the form of increased severity of major weather events.
Land use
Current land use Potential land use Area (ha) Percentage
of state Area (ha) Percentage of state
Broadacre cropping 3 547 778 2.06 10 921 561 6.34 Sugar cane 565 162 0.33 6 997 216 4.06 Perennial horticulture 87 829 0.05 12 827 225 7.45 Annual horticulture 47 166 0.03 21 848 591 12.68 Grazing 147 926 860 85.87 155 729 682 90.39 Sown pastures 16 041 166 9.31 15 627 696 9.07 Intensive livestock 37 856 0.02 26 930 082 15.63 Aquaculture 4 548 0.00 492 557 0.29 Other land use (non-agricultural
land use, may include some
forestry) 20 060 748 11.64
Total 172 277 977 100.00
Source: DAF 2013, Queensland agricultural land audit, <https://www.daf.qld.gov.au/
environment/ag-land-audit>.
Map 3.1 Climate
! ! ! ! ! ! ! ! ! ! ! ! ! ! ! ! ! ! ! ! ! ! ! ! ! 450 500 500 450 600 400 300 200 70 0 800 90 0 10 00 100 1500 130
0 11 00 1 8 00 12 00 2000
2 5 00 1250 1 00 0 90 0 Roma Weipa Bowen Mackay Cairns Emerald Biloela Kingaroy Cooktown Brisbane Toowoomba St George Longreach Burketown Mount Isa Gladstone Bundaberg Gold Coast Cunnamulla Townsville Goondiwindi Charleville Rockhampton Legend Desert Grassland Temperate Subtropical Tropical Equatorial
Mean annual rainfall (mm 7 in 10 years)
!Towns
New South Wales South Australia N or th er n T er ri tor y 600 700 800
±
0 50 100 200 300 400 km
Figure 2 Queensland’s climate
Source: DAF 2013, Queensland agricultural land audit, <
What we produce
Queensland’s agriculture and food sector is also highly diverse (Figure 3).
Cattle and calves
Other livestock disposals
Milk, eggs and wool
Fruit and nuts 27%
4%
3%
9%
Vegetables
6%
6%
Lifestyle horticulture
Sugar cane
6%
Cotton 4% Cereal grains
Fisheries
Forestry and logging
Food processing (first stage)
Fibre processing (first stage)
Fig 3
9% 2%
1%
18%
3%
Figure 3 Forecast Queensland agriculture and food production, 2017–18 Source: DAF, AgTrends, <https://www.daf.qld.gov.au/business-trade/agtrends>.
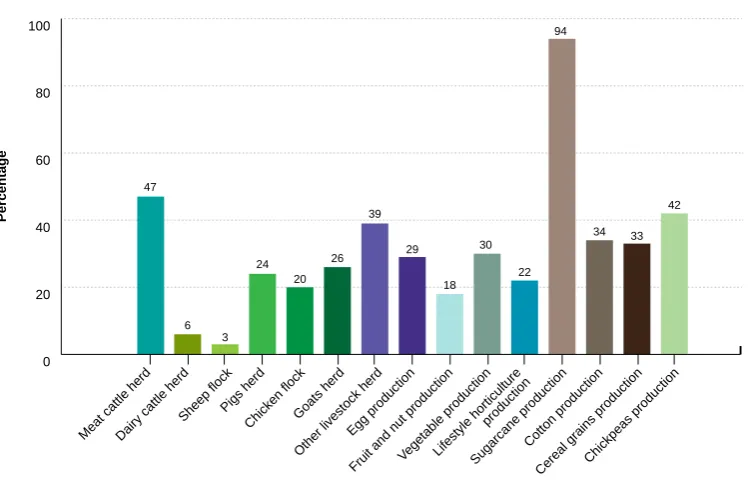
From 34% of Australia’s total farm area, Queensland grows 94% of the nation’s sugar cane, has 47% of the meat cattle herd, and produces 34% of the nation’s cotton, 33% of grains and 30% of vegetables (Figure 4).
Fig 4
0 20 40 60 80 100
Percentage
47
6 3
24 20
26 39
29
18 30
22 94
34 33
42
Meat cattle herdDairy cattle herd
Sheep flockPigs herdChicken flockGoats herd
Other livestock herd Egg production
Fruit and nut productionVegetable production Lifestyle horticulture
production
Sugarcane production Cotton production
Cereal grains productionChickpeas production
Figure 4 Queensland’s share of Australian total, 2015–16
Source: ABS 7121.0, Agricultural commodities, Australia, 2015–16, <http://www.abs.gov.au/ausstats/
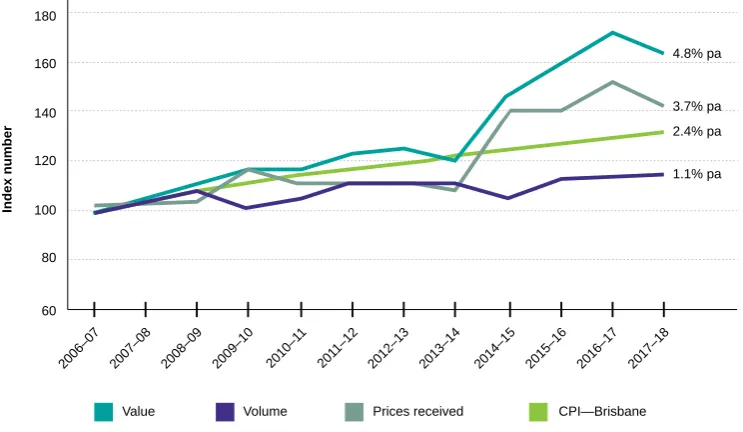
Growth in total agricultural volumes accelerated to 1.1% per year since 2006–07 (Figure 5), after little change in the previous decade. Prices received by producers have kept up with overall price movements.
There has been a significant shift in the composition of output, away from some traditional commodities such as sheep/wool, dairy, sugar and wheat, towards poultry products, fruit, cotton and cattle (Figure 6). These trends highlight the flexibility and market responsiveness of Queensland’s agriculture and food sector.
180
160
140
120
100
80
60
Value Volume Prices received CPI—Brisbane
7939 Fig 5
4.8% pa
3.7% pa
2.4% pa
1.1% pa
2006–07 2007–08 2008–09 2009–10 2010–1 1
201 1–12
2012–13 2013–14 2014–15 2015–16 2016–17 2017–18
Index number
Figure 5 Growth in value and volume of Queensland’s primary industries (2006– 07 = 100) Source: DAF, AgTrends, <https://www.daf.qld.gov.au/business-trade/agtrends>.
Fig 6
0 2 4 6 8 10
–10 –8 –6 –4 –2
–3
Wheat
1
Grain sorghum
–1
Sugar cane
3 Cotton 4
Fruit
–1
V
egetables
2
Beef
1
Pigs
Chicken meat
4
–6
Sheep and lambs
–4
Milk
–9
W
ool
9
Eggs
T
otal agriculture
1
A
verage annual growth rate, percentage
Figure 6 Trends in production volumes, 1996–97 to last 5 years
When we produce it
Seasons, and seasonal conditions, drive the timing of much agricultural production. Also, the amount of preparation needed (which depends on soil quality, the influence of preceding crops and other factors) affects production schedules.
The sugarcane harvest generally occurs from mid-August to late October, but can finish as late as December and begin as early as late June. Harvest starts in the north of the state and moves south as the year progresses and the fields dry out. Following harvest, the ratoon crop will receive fertiliser (approximately 2 weeks post-harvest) and be left to grow until the next harvest. Generally this cycle repeats for 5 years and then the field would be left fallow or planted with a rotation crop such as a legume before preparation and replanting to start the cycle again.
Vegetable production occurs year-round with winter production in the north (mainly the Bowen–Burdekin area) and summer/spring/autumn production from Central Queensland, down through Bundaberg and Lockyer to as far south as the Granite Belt. The main vegetable crops are sweetpotatoes, tomatoes, capsicums, zucchinis, melons, pumpkins, sweet corn and beans. Each of these has their own starting point, with most having at least two preferred planting times during the year. Due to shorter crop rotations, several crops can be grown in a year.
Avocadoes, being perennial crops, are grown year-round. They flower in late winter to spring, through August and September, and harvest from approximately March through to July, depending on the variety. Macadamias, also perennial crops, flower in spring, with harvest from February to July. Tropical fruits such as lychees, custard apples, bananas, longans and carambolas are perennial and so grow all year, with flowering and harvesting at different times.
For summer crops, such as sorghum and cotton, planting time varies depending on
planting rains and soil temperature early in the season. Quick-maturing hybrids of sorghum will be sown for rain-grown spring plantings. For the main summer planting, which occurs late December to mid-February, slow-maturing hybrids will be planted early and the quick-maturing hybrids sown later to improve yield reliability. Harvest will occur after 4–5 months. Winter crops such as wheat and barley are planted and harvested around April and October respectively—earlier than in southern states.
Our place in the world
In world terms, Queensland’s agriculture and food production is not large (Figure 7)1, so
our producers are price-takers on world markets. Most of their income is derived from the marketplace (Figure 8), so our producers need to be—and are—responsive to market trends
and opportunities. 7939 Fig 7
0 2 4 6 8 10 12
0.1
PopulationLand area
Agricultural land
Agricultural production Agricultural
exports
Avocado productionBanana production
Beef productionCattle numbers
Chickpea productionCotton productionMango production
Pineapple production Sorghum productionSugarcane production 1.2
3.1
0.4 0.9
0.6
0.2 1.6
0.9 2.7
1.2
0.1 0.4 12.5
1.5
Wheat production 0.1
Percentage
Figure 7 Queensland’s share of world production, 2014
Sources: FAO, ABS.
7939 Fig 8
0 10 20 30 40 50 60 70 80 90 100
99
New Zealand Australia
Brazil Canada
United States
China Japan Korea 97
91
81 79
57 51 99
91
European Union
Percentage
Figure 8 Percentage of farm income derived from the market, 2014
Markets are as diverse as everything else about the sector (Figures 9 and 10). More than half of Queensland’s agriculture and food output is exported overseas; around one-fifth is also ‘exported’ to other states of Australia, and around one-quarter is consumed within the
state.2 Queensland producers supply 93% of the agricultural, forestry and fishing products
used in the state (with overseas and interstate sources providing 1% and 6% respectively).3
United States
Fig 9
Queensland
24%
18%
Rest of AustraliaIndia
Japan
10%
9%
7%
5%
5%
5%
Republic of Korea Indonesia
Taiwan 2%
China
Singapore 2%
Hong Kong (SAR of China) 1%
Vietnam 2%
Bangladesh 1%
Pakistan 1%
New Zealand 1% Philippines 1% Malaysia 1%
United Arab Emirates 1%
Thailand 1%
Other 3%
Figure 9 Destinations of Queensland’s agriculture and food production, 2016–17 Note: Destinations over $100 million are shown.
Figure 10 Destinations of Queensland’s agriculture and food industry output, 2016–17 Note: Destinations over $100 million for each commodity group are shown. Sources: DAF,Queensland Government Statistician.
Fig 10
Live animal exports Total value $278 million
Indonesia Vietnam
Other
54% 36%
10%
Seafood Total value $384 million Hong Kong
22%
53% Australia
25%
Other
Grains and grain products Total value $2032 million Fruit and vegetables
Total value $3167 million India
29%
Cotton and wool Total value $1163 million
26%
18% 15%
13%
20% Australia
China India
Bangladesh Other
Sugar Total value $2320 million
China Australia
Indonesia
Japan Korea Malaysia
Other 3%
23% 7% 17% 6%
30%
13%
50%
16%
10%
8%
5%
Meat products
Total value $9322 millionAustralia
Japan
China
Korea Indonesia
1%
United States
Taiwan
2%
Philippines1%
Other
8%
Other
16%
84% Australia
Australia 74%
Australia
India Pakistan
China
Bangladesh Other
45%
7%
12%
7%
23%
Our businesses
In 2015–16, there were 16 200 farm businesses in Queensland.4 A further 2300 were
involved in forestry and timber manufacturing, 1425 in fisheries and 2240 in food
manufacturing.5
• A further 8000 businesses (mainly part-time and hobby operations) generate between
$5000 and $40 000 in agricultural output each year. Together, these generate around 1.3% of total agricultural output.
• Farm numbers have been declining at a steady rate of about 1.1% per year. As total land
area devoted to agriculture has changed little, average farm size has increased.
Many of these businesses are themselves diverse, producing multiple commodities:
• About 25% of farms conduct both cropping and grazing activities.6
• An ‘average’ broadacre crop farm produces 1.7 broadacre crops.
• An ‘average’ producer of orchard tree and nut products grows 1.6 different orchard tree
and nut products.
• An ‘average’ vegetable grower produces 1.6 different vegetable products.7
Most businesses involved in agriculture, forestry and fishing are small businesses—56% have no employees apart from the business operators, and 40% have fewer than 20
employees.8
Information on the performance of farm businesses is collated in the ABARES survey of the
9900 businesses in the dairy and broadacre cattle, sheep and grains industries.9 (Most
of these businesses—73%—are specialist beef producers.) Some key statistics from this survey are discussed in the following paragraphs.
In 2015–16, these firms had:
• average capital value of $5.5 million
• average debt of $639 000, implying average net equity of $4.9 million and an 87%
equity ratio
• average farm cash income of $188 000, representing business profit of $72 000 (with
income supplemented by additional off-farm income averaging $59 000)
• average return on capital of 2% excluding capital appreciation and 7% including capital
appreciation.
Behind these averages there is considerable variability and diversity.
An indication of variability is that, for example, 2015–16 was the first year with a healthy rate of return (above 1%) since 2006–07. Since 1989–90, annual returns (with capital appreciation) have averaged 2%, ranging from –8% (1991) to +12% (2007). Returns without capital appreciation have been more stable, averaging 1% and ranging from –1% (2002–03) to +2% (2000–01, 2001–02, 2015–16).
Examples of the farm sector’s diversity (for 2015–16) are:
• For broadacre farms, the rate of return including capital appreciation ranged from +3%
in the North Queensland coastal region to +13% in the Cape York and Gulf region, and from zero in the sheep industry to +9% in the wheat and sheep–beef industries.
• Among the broadacre industries, 48% of farms were worth less than $3 million,
42% were worth between $3 million and $10 million, and 12% were worth more than $10 million.
• 76% of broadacre farms had turnover of less than $500 000, 12% had turnover between
Of course, statistical averages are unlikely to be representative of the most productive, the most innovative, the most profitable, or the most investor-ready operations.
• 10% of farms have equity ratios below 70%, which might be an indicator of financial
stress.
• On the other hand, 41% have equity ratios of 100%—these enterprises are unlikely to be
growing their business, and are unlikely to be the most innovative firms. The same may also be true for many of the 31% of farms with equity ratios between 90% and 100%.
• The most innovative and credit-worthy growth operations are likely to be in the 20% of
farms with equity ratios between 70% and 90%.
Comparing the 12% of (larger) broadacre farms that have turnover exceeding $1 million with the 76% that have turnover less than $500 000, we find that the larger farms were:
• much more valuable ($18.3 million compared with $3.3 million in average total capital)
• much more indebted ($3.3 million compared with $246 000) with much lower equity
ratios (80% compared with 93%)
• much more profitable (rate of return including capital appreciation of 12% compared
with 5%)
• larger in area (55 200 hectares compared with 6900 hectares).
However, the mid-sized farms—the 12% with turnover between $500 000 and $1 million— had the highest cash income per hectare ($27 300 compared with $12 400 for smaller farms and $14 000 for larger farms). Mid-sized farms were between smaller and larger farms on the other indicators reported here.
Our people
In 2017, there were 103 600 people employed in agriculture, forestry, fishing, food
manufacturing and wood product manufacturing in Queensland.10
• This included 52 800 in agriculture, 3200 in fisheries, 8000 in forestry and wood
product manufacturing, and 39 700 in food manufacturing.
• A further 255 500 people were employed in food and beverage services, food retail
and grocery wholesaling operations, which are directly related to supplying food to the Queensland public.
• A further 75 000 jobs in other industries are involved in the supply of goods and
services to the sector.11
So it could be said that the total supply chain of the food and agribusiness sector, including both forward and backward links from the agriculture and food sector itself, provides 434 100 jobs in Queensland—18% of the total number of jobs in the state. Figures 11 to 14 show that those engaged in the sector, compared to the workforce as a whole:
• are less likely to be female (34% compared with 49%)
• are just as likely to be born overseas (25% compared with 26%)
• are just as likely as to be Aboriginal people or Torres Strait
Islanders (both 2%)
• are more likely to speak a language other than English at home (16% compared
with 12%)
• work longer hours (40% working more than 40 hours per week, compared with 27%)
• are less likely to be employees (69% compared with 84%), and are more likely to be
self-employed, employers or contributing family workers
• have lower levels of education (11% with degrees
compared with 27%) but comparable levels of trade qualifications (23% compared with 24%)
• have a diverse range of qualifications, for example
agriculture and related qualifications (6%), engineering and related qualifications (13%— many would be at trade level) and management qualifications (8%).
7939 Fig 11
0 10 20 40 60
All primary industries All industries
Female 34 49 Born overseas 25 26 Languages other than English at home 16 12 Aboriginal or Torres Strait Islander Work over 40 hours per
week 2 2 40 27 Voluntary work 21 21 Percentage
Figure 11 Workforce demographics, Queensland, 2016 Source: ABS, Census 2016, <http://abs.gov.au/census>.
7939 Fig 12
0 10 20 30 40 50 60 70 80 90 84 11 8 10 2 69 6 10
All primary industries All industries
Employee Self-employed Employer Family worker
Percentage
Figure 12 Employment status, Queensland, 2016 Source: ABS, Census 2016, <http://abs.gov.au/census>.
0 5 10 15 20 25 30 35
7939 Fig 13
All primary industries All industries
12 33 Managers 3 20 Professionals 15 10
Technicians and trades 1 11 Community and personal services 14 5 Clerical and administrative 4 10 Sales workers 7 9 Machinery operators and drivers 34 11 Labourers Percentage
Figure 13 Occupation, Queensland, 2016
A wide range of languages are spoken
at home. Some of the more significant are Mandarin (spoken at home by 2% of the sector’s workforce), and Vietnamese, Korean, Italian, Punjabi and Filipino (all 1%).
Many members of the workforce would
7939 Fig 14A
Primary industries All industries
0 5 10 15 20 25 30 35 40 45 50 5 2 Postgraduate degree 3 1 Graduate diploma/ certificate 9 19 Bachelor degree 11 8 Advanced diploma/ diploma 23 24
Certificate III & IV
35 49 Secondary - Years 10 and above 10 3 Secondary - Years 9 and below Percentage
7939 Fig 14B
Education
Society and culture Creative arts
Food, hospitality and personal services Not applicable 0 5 10 15 20 25 30 35 40 1 45 50 55 Natural and physical sciences Information technology Engineering and related technologies Architecture and building Agriculture, environmental and related Health 1 13 2 6 2 2 8 3 1 4 56 Management and commerce Percentage
Figure 14 Education qualifications, Queensland, 2016 Source: ABS, Census 2016, <http://abs.gov.au/census>.
Largely reflecting the occupational profile, employees in the sector are relatively low paid, with a median self-reported annual income (in the 2016 census) of $45 094, compared with the workforce average of $51 511.
Our opportunities
According to the CSIRO, five ‘megatrends’ are impacting the food and agriculture sector (Figure 15). All of these megatrends represent both challenges and opportunities.
Opportunities include:
• increased exports of protein-rich products (e.g. beef, seafood, some crops like
chickpeas)
• increased exports of a variety of horticultural products (including exotic fruits), using
the advantage of Queensland’s counter-seasonality to northern hemisphere producers
• value-adding to higher quality, more convenient and better packaged products across
all industries
• increased exports deriving from increasing recognition of Queensland’s clean and
green record and status.
Of course, reaping these opportunities will depend on meeting challenges, such as maintaining market access in an increasingly competitive international environment.
Choosy customers
Health on the mind
A less predictable
planet
One world
Smarter food chains 7939 Fig 15
A less predictable planet
• Limited amount and decreasing quality of natural resources
• Increasingly unstable and extreme weather events • Decreasing biodiversity
• Increasing virulence of microorganisms and parasites, and increased microbial resistance
• Increasing consumer demand for environmental and social credentials
Health on the mind • Ageing population • Rise in chronic illness • Increasing social awareness for
improved health and wellbeing • Rising importance of food safety • Increasing demand for food
products that target holistic (mind + body) health and wellness outcomes
Choosy customers
• Rising wealth and Asian middle class • Urbanisation
• Greater demand for convenience, out-of-home consumption, food-based experiences and customised offerings
• Increasing demand for provenance information and accurate vendor claims
• Greater consumer willingness to switch
Smarter food chains • Rising global food demand • Food security concerns • Rise of big data and data analysis • Increasing digital connectedness
and use of e-commerce solutions • Vertically integrated, decentralised,
non-linear and more agile value chains
One world
• Increasingly connected global value chains
• Greater exposure to foods and beverages from other regions and cultures
• Greater international competition • Increased biosecurity risks • Greater susceptibility to supply
shocks
Figure 15 The five megatrends impacting the food and agriculture sector
Source: Adapted, and reproduced with the permission of CSIRO, from CSIRO, Food and agribusiness: a roadmap for unlocking value-adding growth opportunities for Australia, July 2017, <https://www.
csiro.au/en/Do-business/Futures/Reports/Food-and-Agribusiness-Roadmap>.
Because of these opportunities, Deloitte describes agribusiness as ‘Australia’s forgotten hero’ and states that ‘Australia can be a long-term winner in this sector, particularly in
grains, beef and dairy, wine, oil seeds and emerging areas like aquaculture’.12
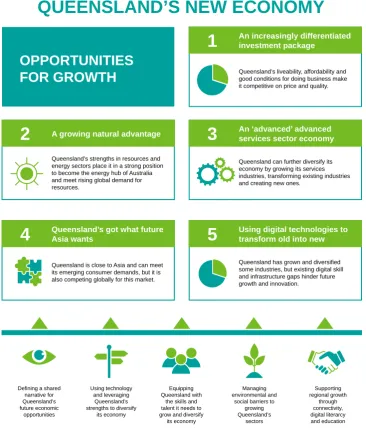
Queensland is better placed to meet the challenges, and take advantage of the opportunities, than most of its competitors (Figure 16). In agriculture and food, this is because of several factors:
• The sector is diverse. Diversification is always a good risk management strategy. It
• The sector has a market-facing environment. While well-supported by government (see
pages 16–17), Queensland’s agriculture and food industries do not rely on government for their wellbeing (see Figure 8, page 7). Rather, they rely on their success in the marketplace.
• The sector has a recognised clean and green status. Australia—and especially
Queensland—produces some of the highest quality foods in the world, and we are determined to maintain that status in the face of ongoing biosecurity threats and environmental challenges.
• The sector has extensive supporting infrastructure including:
— hard economic infrastructure such as roads, railways and ports
— soft infrastructure such as a supportive legal and regulatory environment
— smart infrastructure such as research, development and extension, and an
innovative culture more generally
— social infrastructure such as a supportive education and training system.
Defining a shared narrative for Queensland’s future economic
opportunities
Using technology and leveraging
Queensland’s strengths to diversify
its economy
Equipping Queensland with
the skills and talent it needs to grow and diversify
its economy
Managing environmental and
social barriers to growing Queensland’s
sectors
Supporting regional growth
through connectivity, digital literarcy and education
STRATEGIC FOUNDATIONS – ENABLING QUEENSLAND TO GROW
1
An increasingly differentiatedinvestment package
Queensland’s liveability, affordability and good conditions for doing business make it competitive on price and quality.
3
An ‘advanced’ advancedservices sector economy
Queensland can further diversify its economy by growing its services industries, transforming existing industries and creating new ones.
2
A growing natural advantageQueensland’s strengths in resources and energy sectors place it in a strong position to become the energy hub of Australia and meet rising global demand for resources.
5
Using digital technologies totransform old into new
Queensland has grown and diversified some industries, but existing digital skill and infrastructure gaps hinder future growth and innovation.
4
Queensland’s got what futureAsia wants
Queensland is close to Asia and can meet its emerging consumer demands, but it is also competing globally for this market.
OPPORTUNITIES
FOR GROWTH
QUEENSLAND’S NEW ECONOMY
7939_fig 16
Support
While Queensland’s agriculture and food sector faces the marketplace, it does so with the support of government at all levels. Nationally, 18% of agriculture, forestry and fishing
firms received direct government assistance in 2015–16, compared with 11% of all firms.13
Biosecurity
Australia, including Queensland, maintains very high biosecurity standards. Biosecurity is the responsibility of everybody—the Australian Government, the Queensland Government, local governments and landholders. World-leading arrangements are in place to prevent, detect, respond to and manage biosecurity incidents. The Queensland Government directly
spent $142 million on biosecurity in 2016–17.14
Food safety
Safe Food Production Queensland seeks to ensure that Queensland’s primary production and processing systems meet national food safety standards, that potential threats to the integrity of food supply are identified and dealt with decisively, and that consumers have confidence in food produced in Queensland. It administers food safety schemes for meat, dairy, eggs and seafood. The risks associated with horticulture are currently being considered.
Research, development and extension
The Queensland Government invests nearly $100 million per year in research, development and extension (RD&E) for the agriculture and food sector. This is more than a quarter of
all research and development (R&D) expenditure by Queensland Government agencies.15
A comparable amount ($95 million in 2014) is spent on R&D in the agricultural and
veterinary sciences in Queensland universities16, and some $126 million is spent
in Queensland annually on R&D by businesses involved in the sector, mainly food
processing.17
Investment
Trade and Investment Queensland seeks to attract and facilitate job-creating investment in the state. Specific programs, including the Primary Industry Productivity Enhancement Scheme of concessional loans administered by the Queensland Rural and Industry Development Authority, assist investment in agriculture and food.
Climate variability
Education and training
Agriculture and food businesses require a wide range of skills. Nationally, a slightly higher proportion of primary producers than other firms nominate skill shortages as a constraint
on business (12% compared with 11%).18
The sector in Queensland is supported by a strong network of education and training providers who offer a wide selection of courses ranging from short non-accredited training, through accredited training as part of the vocational education and training (VET) system, to degree and higher degree level as part of the higher education system.
In 2016–17, there were 13 540 publicly funded students undertaking accredited VET primary industry programs in Queensland. This is approximately 19% of the national total, slightly above Queensland’s 17.2% share of employment in agriculture, forestry and fishing. It also represents around 5.2% of all publicly funded students undertaking nationally recognised training in Queensland—also higher than the industries’ share of total employment in the state.
In 2016, 700 students completed university courses in agriculture and environmental studies in Queensland (383 at The University of Queensland, 132 at Griffith University, 82 at James Cook University, 46 at Central Queensland University, 35 at the University of South Queensland and 22 at Bond University). This was 17% of the national total of agriculture and environmental studies completions and 1.3% of all higher education
completions in Queensland.19
Regulation
Australian governments have removed many agriculture-specific regulations in recent decades. In the early 1980s, there were more than 60 statutory marketing boards
nationwide; today just 1 remains (not in Queensland).20 Over the same period, the volume
A closer look
Land and natural resources
Implications of climate change
Climate change is impacting Queensland and its agriculture and food sector. It brings a challenge to the sector in both adapting to, and helping to mitigate, the effects. Not all impacts are negative—increased concentrations of atmospheric carbon dioxide stimulate plant growth, and some regions may experience higher rainfall (Figure 17). However, on average, Queensland is expected to become drier—with annual precipitation falling by
2–3% by 2050—as well as warmer.21 Most seriously, extreme events such as droughts and
cyclones are predicted to increase in severity and impact, while climate change is expected to widen the range of many significant pests and diseases.
Projected Precipitation Change (%) at 2070
Summer Autumn
Winter Spring
Lower Emissions
Summer Autumn
Winter Spring
High Emissions
-30 to -20 -20 to -15 -15 to -10 -10 to -7 -7 to -4 -4 to -2 -2 to 2 2 to 4 4 to 7 7 to 10 10 to 15 15 to 20 20 to 30
Figure 17 The impact of climate change on rainfall—percentage change by 2070
Source: Queensland Government, Climate change in Queensland, <http://qgsp.maps.arcgis.com/apps/
MapJournal/index.html?appid=1f3c05235c6a44dcb1a6faebad4683fc>.
Queensland’s agriculture sector has much experience in facing climate variability.
This, plus support from the government (as outlined in Pathways to a climate resilient
7939 Fig 18
Land use, land-use change and forestry
Agriculture
1990 1991 1992 1993 1994 1995 1996 1997 1998 1999 2000 2001 2002 2003 2004 2005 2006 2007 2008 2009 2010 201
1
2012 2013 2014
100
80
60
40
20
0 Megatonnes of carbon dioxide
Figure 18 Queensland’s greenhouse gas emissions
Source: Queensland Government, Total annual greenhouse gas emissions, <https://www.ehp.qld.gov.au/
state-of-the-environment/finding/?id=3.4.0.1>.
Agriculture accounted for 14% of Queensland’s greenhouse gas emissions in 2014. This was mainly (82%) methane from ruminant animals, mainly cattle, and so varies over time in line with livestock numbers. A further 13% of Queensland’s total emissions were from activity related to land-use change (such as tree clearing), which declined significantly up to 2014 (Figure 18). Globally, food and agribusiness is estimated to contribute 30% of
global emissions.22
The focus of climate change mitigation policy has been on reducing tree clearing, with some emphasis on reducing livestock emissions through improved management practices. In an area the size of Queensland, there is also significant potential for the creation of carbon ‘sinks’ through re-afforestation and soil management, supported by ‘carbon markets’ able to direct investment into these activities.
Water
Queensland’s primary industries used some 2454 gigalitres of water in 2015–16—this was 62% of total water use in Queensland (Figure 19). The main user (41% of total state water consumption) is the ‘other’ crop industries, mainly sugar cane and cotton.
In 2015–16, 29% of all Queensland agricultural production was irrigated on 30% of farms (Figure 20). Most cotton and horticulture is irrigated, as is a significant proportion of sugar cane and dairy production.
In 2015–16, 29% of irrigation water was from groundwater sources and 23% from natural
waterways.23
7939 Fig 19
0
5 10 15 20 25 30 35 40
0
41
27
Lifestyle horticulture 3
Vegetables 4
Fruit and nuts 11
Sheep, beef, grain Other crops
1
Dairy cattle 0
Aquaculture 0
Forestry
Other industries 9
Household
Percentage
Figure 19 Industry share of total water use, Queensland, 2015–16
7939 Fig 20
Percentage irrigated Percentage of total irrigated and production
0 10 20 30 40 50 60 70 80 90
32 89
Fruit and nuts
11 86
Cotton 78
6
Lifestyle horticulture
21 74
Vegetables 64
20
Sugar cane
3 44
Dairy 6
1
Cereals
2 3
Meat cattle 29
Total
Percentage
Figure 20 Percentage of production irrigated, Queensland, 2015–16
Source: ABS 4610.0, Water account, Australia, 2015–16, <http://www.abs.gov.au/AUSSTATS/[email protected]/Loo
kup/4610.0Main+Features12015-16>.
Water resources in Queensland are regulated through water resource plans for 24 water
resource areas.24 SunWater is the main bulk water supplier in regional Queensland.
It operates 19 major dams, 66 weirs and barrages, 82 major pumping stations, 3155 kilometres of pipelines and channels, and 730 kilometres of irrigation drains
(Figure 22).25
SunWater operates on a commercial basis, with additional storage and irrigation infrastructure added on the basis of detailed business cases. As a result, water infrastructure developments are continuing. For example, the Lower Fitzroy River
Infrastructure Project will supply approximately 76 000 megalitres of additional water per year for urban, industry and agricultural use in Central Queensland; this is a 3% increase in
supply of (distributed) water in Queensland.26
In principle, water users are charged for all operating costs (including depreciation) for the supply of water. The Queensland Government does not require any return on its capital invested; water infrastructure is considered an important economic development service to the Queensland community. Many irrigators pay lower prices than this, supported by a community service obligation payment. These prices are phasing upwards to full cost recovery, but price paths have been frozen until 2019 to support transfer of some of SunWater’s irrigation channel schemes to local ownership.
While most current water supplies in the state are fully allocated, there is considerable
scope for expanding water supplies (Figure 21),27 both through bulk water infrastructure
7939 Fig 21
0 50 100 150 200 250 300 350
Far North Queensland
North
North West Central
Wide Bay Burnett
South East South West West
Percentage
27 50
300
72 121
13 4
175
56
Figure 21 Uncommitted and unallocated water share of 2015–16 consumption
Source: Queensland Government 2017, Queensland bulk water opportunities statement, <https://www. dews.qld.gov.au/__data/assets/pdf_file/0007/1266883/qld-bulk-water-opportunities-statement. pdf>.
ERNEST HENRY MINE
FOR DETAILS OF SCRIVENER DAM IN AUSTRALIAN CAPITAL TERRITORY, SEE INSET ‘B’
SunWater Potential Pipelines SunWater Weirs SunWater Dams
Major Rivers
SunWater Owned/Operated Pipelines SunWater Regulated Stream
SunWater Potential Weir Sites SunWater Potential Dam Sites SunWater Channel Systems SunWater Brisbane Office SunWater Regional Depots ETON
Dams operated by SunWater and owned by others
Geor
gi
na R
iv
er
NORTH REGION
NORTH REGION
SOUTH REGION
SUNWATER OPERATIONS AND INFRASTRUCTURE
updated January 2017Scale 1:2,750,000
INSET 'A'
WOOLEEBEE CREEK TO GLEBE WEIR PIPELINE
KENYA TO CHINCHIILLA WEIR PIPELINE TARONG PIPELINE STAG CREEK PIPELINE STANWELL PIPELINE BLACKWATER PIPELINE EUNGELLA WATER PIPELINE EUNGELLA WATER PIPELINE SOUTHERN EXTENSION EUNGELLA WATER PIPELINE EASTERN EXTENSION BURDEKIN MORANBAH PIPELINE NEWLANDS PIPELINE COLLINSVILLE PIPELINE AWOONGA-CALLIDE PIPELINE CLONCURRY PIPELINE NORTH WEST QLD PIPELINE Giru Weir
Bowen River Weir & Gattonvale Offstream Storage
Val Bird Weir Granite Creek Weir
Bruce Weir
Collins Weir Solanum Weir
Leafgold Weir Dulbil Weir
Clare Weir
Blue Valley Weir
Dumbleton Weir
Tartrus Weir Eden Bann Weir
Bingegang Weir
Bedford Weir
Selma Weir
Neville Hewitt Weir Stag Creek Weir
Callide Weir
Moura Weir
Youlambie Weir
Orange Creek Weir Gyranda Weir Glebe Weir Theodore Weir Jones Weir Monto Weir Bazley Weir Avis Weir Mulgildie Weir
John Goleby Weir Kirar Weir
Claude Wharton Weir Bucca
Weir Kolan Barrage
Ben Anderson Barrage
Mary River Barrage Tinana Barrage
Joe Sippel Weir Silverleaf Weir
Chinchilla Weir
Moolabah Weir
Buckinbah Weir Jack Taylor Weir
Allan Tannock Weir
Neil Turner Weir
Ben Dor Weir
Yarramalong Weir MelroseWeir Wando Weir Nangwee Weir Cecil Plains Weir
Lemon Tree Weir
Talgai Weir
Greenup Weir Whetstone Weir
Ned Churchward Weir Marian Weir Mirani Weir Gorge Weir Moura Offstream Dam Callide Dam Cania Dam Kroombit Dam Wuruma Dam Fred Haigh Dam Paradise Dam Boondooma Dam Bjelke-Petersen Dam
E J Beardmore Dam
Leslie Dam Coolmunda Dam Glenlyon Dam Fairbairn Dam Kinchant Dam Eungella Dam Teemburra Dam Peter Faust Dam
Burdekin Falls Dam Ross River Dam Tinaroo Falls Dam
Julius Dam COOKTOWN MOSSMAN MAREEBA CAIRNS ATHERTON INNISFAIL TULLY INGHAM TOWNSVILLE CHILLAGOE GEORGETOWN AYR CHARTERS TOWERS HUGHENDEN MORANBAH SARINA PROSERPINE COLLINSVILLE NEBO MACKAY ARAMAC MUTTABURRA LONGREACH BARCALDINE ISISFORD BLACKALL ALPHA TAMBO CLERMONT SPRINGSURE ROLLESTON BILOELA BLACKWATER EMERALD DUARINGA MARLBOROUGH ST LAWRENCE YEPPOON ROCKHAMPTON GLADSTONE AGNES WATERS MIRIAM VALE MONTO GIN GIN CLARE ETON BUNDABERG BOWEN THEODORE TAROOM EIDSVOLD MUNDUBBERA GAYNDAH BIGGENDEN
CHILDERS HERVEY BAY
MARYBOROUGH TIARO NAMBOUR CALOUNDRA CABOOLTURE KILCOY ESK DALBY TARA CHINCHILLA MILES YULEBA ROMA MITCHELL CHARLEVILLE WYANDRA CUNNAMULLA ADAVALE QUILPIE HUNGERFORD THARGOMINDAH HEBEL MUNGINDI GOONDIWINDI INGLEWOOD STANTHORPE WARWICK BOONAH BEAUDESERT IPSWICH GATTON TOOWOOMBA MILLMERRAN ST GEORGE SURAT WANDOAN GYMPIE KINGAROY NANANGO NOOSA MURGON
MOUNT ISA CLONCURRY
M olong o R iver M olon
go Riv er M ur ru m bid ge e R ive r CANBERRA QUEANBEYAN
Scale 1:1,000,000INSET 'B'
AUSTRALIAN CAPITAL TERRITORY
Scrivener Dam
SOUTH REGION
ROOKWOOD WEIR EDEN BANN WEIR RAISING
Figure 22 SunWater operations and infrastructure
Source: SunWater, Annual report 2015–16, <http://www.sunwater.com.au/__data/assets/pdf_
Soils
Soil is a precious resource, and Queensland’s agriculture depends upon it. The inherent characteristics of soil, along with the availability of water, largely determine the amount and quality of food and fibre that land can produce. Agricultural soils also provide the community with a suite of other benefits such as clean water, climate regulation
(e.g. through carbon sequestration) and biodiversity conservation. Soil is, however, largely non-renewable—a few centimetres may take hundreds or thousands of years to create— and it can be fragile. A generation’s worth of soil can be lost in a single intense rainfall event if left unprotected or unsupported by appropriate land management practices.
The capacity of soils to support agriculture and to provide other benefits to the community can be degraded by erosion, salinisation, and structure and fertility decline. These
processes occur naturally in different locations to varying levels; however, inappropriate land management greatly increases their extent and impact. Soil degradation is
widespread across Queensland, and is estimated to cost more than $2 billion per year in
lost agricultural income, infrastructure damage and reduced environmental services.28
In 2006–07, Queensland farmers reported spending a total of $121 million on land and soil conservation works.
Prime agricultural land is also lost to competing land uses such as urban development.
Biosecurity
Queensland is home to many species that have been either deliberately or accidentally
introduced since European settlement. Biosecurity Queensland29 lists 50 emergency plant
pests and diseases, 90 restricted plants (weeds), 19 restricted invasive animals, and 81 significant animal pests and diseases. Most weeds do not currently occupy their maximum distribution, and so have significant potential to spread (potentially exacerbated by climate change).
However, the Queensland community is determined to maintain the state’s clean and green status:
• The Queensland Government directly spent $142 million on biosecurity in 2016–17.30
• The Australian Government spent $715 million on managing biosecurity and imported
food risk in 2016–17. On a per capita basis, this is equivalent to $143 million in
Queensland.31
• Local governments spend around $25 million per year on pest and weed management.32
• In 2006–07 (latest data), 86% of agricultural businesses in Queensland conducted
weed control activities and 81% conducted pest animal control activities. The
expenditure for this was $451 million (equivalent to $572 million in 2016–17 prices).33
• The Biosecurity Act 2014 introduced the general biosecurity obligation. This applies
Agriculture and the environment
Accounting for 88% of the land area of Queensland, primary industries are a significant part of the state’s environment. The sector must consider issues such as climate change, biodiversity, habitats, and sediment and chemical run-off. This last is particularly
important to the 26% of agricultural landholdings within Great Barrier Reef catchments.34
In 2015–16, 3.4% of the land in agricultural landholdings was not used for agriculture, and 40% of this (1.7 million hectares) was set aside for conservation/protection purposes. As
part of this, 23% of farmers set land aside for conservation/protection purposes.35
In 2015–16, in Great Barrier Reef catchments:
• 29% of pastures, 55% of streambanks and 25% of gullies on grazing lands were
managed using best management practices
• 40% of sugarcane land was managed at best practice levels for sediments, 18% for
nutrients and 39% for pesticides
• 72% of horticulture land was managed at best practice levels for sediments, 24% for
nutrients and 45% for pesticides.
The target for 2018 is for 90% of lands to be managed using best practice systems.36
Regional communities and economies
Figures 23 and 24 show the wide distribution of agriculture and food industry employment. South East Queensland has the largest number of people employed in the sector (primarily food processing), followed by Darling Downs – Maranoa and Wide Bay.
0 5 10 15 20 25 30 35 40
Percentage
7939 Fig 23
Percentage of Queensland’s primary industries
Percentage of all industries for region
3 40
South East Queensland 14
25
Darling Downs – Maranoa
13 12
Wide Bay
8 6
Mackay–Isaac–Whitsunday
6 7
Central Queensland
13
Queensland Outback 8
Cairns 8
Townsville
6 6 5 6
Toowoomba 4
Figure 23 Employment in agriculture and the food industry by region, 2016
Source: ABS 6291.0.55.003, Labour force, Australia, detailed, quarterly, Nov. 2017, <http://www.abs.gov.
au/ausstats/[email protected]/mf/6291.0.55.003>.
Figures 23 and 24 also show the relative importance of industry employment (including agriculture, forestry, fishing, food processing and wood product manufacturing) to local communities. The sector is of most importance in Darling Downs – Maranoa, followed by Wide Bay and Queensland Outback.
Figure 24 shows this relative importance at community level, as defined by local
• The sector provides 25–40% or more of direct employment in a number of communities
in the north (e.g. Etheridge, which has the highest share in the state at 42%), the west (e.g. 30% in Goondiwindi), and Central Queensland (e.g. 36% in Barcaldine), and in some coastal communities (e.g. 35% in Burdekin). Overall, the sector provides more than 25% of jobs in 18 of the 78 local government areas in Queensland.
• The sector provides 10–25% of jobs in 21 other local government areas in all areas of
the state, including on the outskirts of South East Queensland (e.g. 25% in Lockyer Valley and 17% in Gympie) and in some major centres (e.g. 14% in Bundaberg).
• The sector has a significant presence in most communities, including the major cities
such as Brisbane, Gold Coast and Townsville (all 2%, largely food processing).
• In some remote communities there is little direct employment in the sector. (However,
this is most likely undercounting, as the census may not have collected data on work in many Indigenous community market gardens and Indigenous fishing activities.)
An estimated 3300 people who had been employed in agriculture, forestry or fisheries in the past 2 years were unemployed in 2016–17. Although this partly reflects the seasonal nature of much sectoral employment, it is a slightly higher unemployment rate (5.9%) than
the workforce as a whole (3.9%).38
Of course, the contribution of the sector to local communities goes well beyond economic considerations. Just one indicator of their social contribution is shown in Figure 11 (page 12), which shows that, despite working longer hours, 21% of people engaged in agriculture and food industries also undertake voluntary work—this is the same proportion as for the broader workforce.
Figure 24 Agriculture and food industry employment by local government area: number and percentage of all industries
Production costs and infrastructure
Costs
The average total cash costs for broadacre farms in Queensland was $322 812 in 2015–16, although total costs vary greatly between commodities (Figure 25) and farms. The composition of these costs is shown in Figure 26. (Sectors with higher levels of irrigation, particularly cotton and sugar cane, would have significantly higher electricity and water costs.) Note that many costs (such as purchases of livestock, fodder and seed)
flow to other farms.39
Farm cost–price indexes are only available on a national basis. On average over time, farm costs increase broadly in line with overall inflation. While prices received tend to fluctuate, they also tend to rise on average over time, but less strongly. This is because, globally, the demand for food and fibre does not keep pace with overall income growth. At the same time, productivity growth in the supply of food and fibre tends to match (or even exceed) that of other sectors and so rises at least as rapidly as overall income growth. This excess supply pressure compared with demand tends to depress real prices. To maintain income levels, farmers have to compensate for this declining ‘terms of trade’ with productivity growth. Unsurprisingly, primary producers nationally are more likely than other firms to
nominate input costs as a barrier to business (26% compared with 13%).40
7939 Fig 25
0 $100 000 $200 000 $300 000 $400 000 $500 000 $600 000 $700 000 $800 000 283 197 603 705 434 978 Beef Grains Dairy
Figure 25 Average farm cash costs, Queensland, 2015–16 Source: ABARES, AgSurf, <http://apps.daff.gov.au/agsurf/>.
7939 Fig 26
0 5 10 15 20 25 30 35 40 ChemicalsElectricityFertiliser Fodder Fuel Insurance Interest 23 Livestock costs 46 8 13 10 1 16
1 1 1 4 1 9 5 10 0 39 68 4 3 3
2 11 11
6 6 3
000
Contractors and wages
0 4 2 4 2 6 4 1 12 9 7
Rent and rates Water
Repairs and maintenance Seed
Handling and marketing
Freight Other 4 11 11 6 11 11 7 2
Beef Grains Dairy
Percentage
Figure 27 shows these trends in operation. However, the declining terms of trade has been ameliorated since the early 1990s. This reflects a combination of factors, including:
• the effect of the Uruguay Round of multilateral trade negotiations in placing limits on
price-depressing subsidies by major northern hemisphere countries
• improved macro-economic performance of the Australian economy generally, including
lower inflation and a more competitive exchange rate
• the commodity price boom from 2006 to 2012, which has yet to be fully reversed,
largely reflecting strong economic growth in populous Asian countries.
There was even a temporary increase in farmers’ terms of trade since 2012–13. However, ABARES forecasts suggest that supply will respond to these price signals and as a result
prices will decline slightly in coming years.41
7939 Fig 27
Percentage
0
1972–731974–751976–771978–791980–811982–831984–851986–871988–891990–911992–931994–951996–971998–992000–012002–032004–052006–072008–092010–1 1
2012–132014–152016–172018–192020–21
50 100 150 200 250
Consumer price index
Index of prices received
Index of prices paid
Farmers’ terms of trade
(forecast)
Figure 27 Indexes of farm prices received and paid and the consumer price index, Australia, 1997–98 = 100 Source: ABARES, Agricultural commodities and trade data, <http://www.agriculture.gov.au/abares/
research-topics/agricultural-commodities/agricultural-commodities-trade-data#2016>.
Prices paid and received
The 2014 State of Queensland agriculture report introduced a new measure of the ratio
between food prices paid by consumers and prices received by farmers. This was described as a measure of the supply chain efficiency, implying that it would reflect efficiency and competition in the post–farm gate supply chain. However, this is potentially misleading in that other factors (such as changes in the value added at various stages of the supply chain) could affect this ratio. An example of this is the wide variety of fresh milk products that have become available to consumers in recent years.
7939 Fig 28
80
2001–02
90 100 110 120 160
Ratio
CPI food group Brisbane
130 140 150
2002–032003–042004–052005–062006–072007–082008–092009–102010–1 1
2010–1 1
201 1–12
2012–132013–142014–152015–162016–17
Prices received Queensland farmers
???
Figure 28 Ratio of consumer food prices to prices received by farmers, 2001–02 = 100
Sources: DAF, AgTrends, <https://www.daf.qld.gov.au/business-trade/agtrends>;ABS 6401.0, Consumer price index, Australia, Sep. 2017, <http://www.abs.gov.au/ausstats/[email protected]/mf/6401.0>.
With only a quarter of Queensland’s agriculture and food production being consumed within the state, there are substantial compositional differences between the pattern of domestic food consumption and the pattern of Queensland production. Figure 29 shows the ratio at a more detailed level for fruit, vegetables, beef and milk.
60
2001–02
80 100 120 140
7939 Fig 29a
160 180 200
2002–032003–042004–052005–062006–072007–082008–092009–102010–1 1
201 1–12
2012–132013–142014–152015–162016–17
Ratio
CPI group—fruit
Prices received—fruit
80
2001–02
90 100 120 130
7939 Fig 29b
140 160 170
2002–032003–042004–052005–062006–072007–082008–092009–102010–1 1
201 1–12
2012–132013–142014–152015–162016–17
CPI group—milk
110 150
Ratio
Prices received—milk
???
60
2001–02
70 80 100 110
7939 Fig 29c
120 140 150
2002–032003–042004–052005–062006–072007–082008–092009–102010–1 1
201 1–12
2012–132013–142014–152015–162016–17
90 130 150
Ratio
Prices received—cattle
CPI group—beef and veal
50
2001–02
7939 Fig 29d
2002–032003–042004–052005–062006–072007–082008–092009–102010–1 1
201 1–12
2012–132013–142014–152015–162016–17
100 150 200 250
Ratio
CPI group—vegetables
Prices received—vegetables
Figure 29 Ratio of farm prices to consumer price, Queensland, 2001–02 = 100
Transport
Despite its large area, Queensland has a highly developed transport system (Figure 30).42
BRISBANE TOOWOOMBA-WELLCAMP ROMA MILES DALBY BOWEN EMERALD WINTON MACKAY CAIRNS EBENEZER LONGREACH CLONCURRY CAMOOWEAL MOUNT ISA GLADSTONE GOLD COAST BARCALDINE TOWNSVILLE GOONDIWINDI CHARLEVILLE ROCKHAMPTON BOULIA CHARTERS TOWERS CAPE FLATTERY WEIPA KARUMBA
Disclaimer: This information is only indicative of the transport system. It includes material available for illustrative
purposes and is not inclusive of all facilities. As the information is representative of the network it should not be relied upon to be accurate, up-to-date or complete. Users should exercise their own skill and care with respect to its use.
REFER INSET
Population of Queensland 2016
4.8+ Million
Expected 7 million by 2036
9670 km rail line 186,207 km network roads 20 ports 15 trading ports of a total 20 Ports
6 international airports 13 intermodal terminals BRISBANE TOOWOOMBA-WELLCAMP ROMA MILES DALBY BOWEN EMERALD WINTON MACKAY CAIRNS EBENEZER LONGREACH CLONCURRY CAMOOWEAL MOUNT ISA GLADSTONE GOLD COAST BARCALDINE TOWNSVILLE GOONDIWINDI CHARLEVILLE ROCKHAMPTON BOULIA CHARTERS TOWERS CAPE FLATTERY WEIPA KARUMBA TOOWOOMBA -WELLCAMP BROMELTON BRISBANE WARWICK MAROOCHYDORE EBENEZER GOLD COAST Legend Trading Port Major Airport
Key Intermodal Terminal
Town
KFR - Rail
KFR - Rail (North Coast Rail Line)
KFR - Rail (proposed InLand Rail)
KFR - Road
Cross border road connection
General freight movements
Disclaimer: This information is only indicative of the transport system. It includes material available for illustrative purposes and is not inclusive of all facilities. As the information is representative of the network it should not be relied upon to be accurate, up-to-date or complete. Users should exercise their own skill and care with respect to its use.
REFER INSET
INSET
Figure 30 Queensland’s strategic freight network
Source: Department of Transport and Main Roads, Moving freight, <https://www.tmr.qld.gov.au/
All levels of government continue to invest strongly to upgrade this network. Total investment of $8.7 billion is proposed for the primary road network in Queensland in the
4 years to 2019–20; this includes significant upgrades.43
7939 Fig 31
1990 1991 1992 1993 1994 1995 1996 1997 1998 1999 2000 2001 2002 2003 2004 2005 2006 2007 2008 2009 2010 201
1
2012 2013 2014 2015 2016
1 2 3 4 5 6
Percentage
Figure 31 Freight share of farm cash costs, Queensland Source: ABARES, AgSurf, <http://apps.daff.gov.au/agsurf/>.
Direct freight costs are around 4% of total farm cash costs in the Queensland broadacre and dairy industries (Figure 31), fluctuating (mainly as other costs fluctuate) around what
appears to be a rising trend in the most recent years.44
Many other transport costs are incurred off-farm in agriculture and food supply chains.
Road and rail costs to port average 9.8% of Australian farm gate prices.45 Broader studies
put the overall cost of post–farm gate transport at around 13% of farm gate prices.46
In 2015–16, trucks carried 80 megatonnes of food and live animals in Queensland. This was 22% of the national total, and 14% of the total tonnage carried by trucks in Queensland. Most (87%) of this tonnage was in articulated vehicles—well above the 47%
of all road freight carried by articulated vehicles in Queensland.47
Energy
Agriculture and food industries are significant energy consumers. In Australia as a whole in 2014–15, the agriculture, forestry and fishing industries used 4% of all the energy used by industry, at an energy intensity of almost 3000 gigajoules of energy per $1 million
of output—24% above the all-industry average (Figure 32).48 Whereas the all-industry
average has been declining, the energy intensity of the agricultural sector has been slightly trending upward, largely reflecting measures to improve water use efficiency, which in effect substituted energy for water inputs. According to the OECD, energy efficiency in Australian agriculture has declined, suggesting significant opportunities for efficiency
improvements.49
Total energy (fuel and electricity) costs have averaged a consistent 8% of the total cash
costs of Queensland broadacre and dairy farms.50
2002–03 2003–04 2004–05 2005–06 2006–07 2007–08 2008–09 2009–10 2010–1 1
201 1–12
2012–13 2013–14 2014–15
3000
2900
2800
2700
2600
2500
2400
2300
2200
2100
2000
Agriculture, forestry and fishing
All selected industries
Gigajoules per $1 million of output
7939 Fig 32
Figure 32 Energy intensity, Australia
Source: ABS 4655.0, Australian environmental-economic accounts, 2017, <http://www.abs.gov.au/
ausstats/[email protected]/mf/4655.0>.
Reflecting the small-business nature of the sector, and so the small size of individual consumption, agriculture, forestry and fisheries in Australia pay 81% more per unit of
electricity than the all-industry average, although 15% less