Environmental effects of vegetable
production on sensitive waterways
Dr Stephen Harper
The Department of Agriculture, Fisheries and
Forestry, Qld
VG09041
This report is published by Horticulture Australia Ltd to pass on information concerning horticultural research and development undertaken for the vegetables industry.
The research contained in this report was funded by Horticulture Australia Ltd with the financial support of the vegetables industry.
All expressions of opinion are not to be regarded as expressing the opinion of Horticulture Australia Ltd or any authority of the Australian Government.
The Company and the Australian Government accept no responsibility for any of the opinions or the accuracy of the information contained in this report and readers should rely upon their own enquiries in making decisions concerning their own interests.
ISBN 0 7341 3318 9
Published and distributed by: Horticulture Australia Ltd Level 7
179 Elizabeth Street Sydney NSW 2000 Telephone: (02) 8295 2300 Fax: (02) 8295 2399
© Copyright 2014
1
HAL project VG09041 - Final Report
Environmental effects of vegetable production on sensitive
waterways
Stephen Harper
et al.
2 HAL project VG09041
Project Leader – Stephen Harper
Principal Research Scientist - Horticulture and Forestry Science Department of Agriculture, Fisheries and Forestry
Phone 07 5466 2222 Mobile 0417 006 482 Email [email protected]
Project team members and collaborators
Robert Premier – Consulting Scientist - Global F.S. Pty Ltd - Victoria
Sarah Limpus – Horticulturist - Department of Agriculture, Fisheries and Forestry (Qld) Bowen.
Philip Moody - Science Leader - Department of Science, Information Technology, Innovation and the Arts (Qld)
John Bagshaw – Formerly Principal Extension Officer - Department of Agriculture, Fisheries and Forestry (Qld) - Bundaberg.
Luke Jackson - Formerly Experimentalist - Department of Agriculture, Fisheries and Forestry (Qld) - Gatton
Project Aim
The project aims to identify the potential for losses of nutrient (focussing on nitrogen) from vegetable farms and to develop knowledge on nutrient dynamics and optimisation of inputs and the effective engagement with the community on issues associated with sensitive waterways and to provide tools that will assist growers in addressing these.
Acknowledgement
This project has been co-funded by HAL using the vegetable industry levy and matched funds from the Australian Government. The Queensland Government has also co-funded the project through the Department of Agriculture, Fisheries and Forestry and the Department of Science, Information Technology, Innovation and the Arts.
Date of report – to be finalised
1
Table of contents
Table of contents 1
Media Summary 3
Technical Summary 4
1 Introduction 6
2 Literature review of nitrogen management in lettuce, broccoli, cabbage,
cauliflower and capsicum. 8
2.1. Introduction 8
2.2. Lettuce 8
2.3. Brassicas 17
2.4. Capsicum 31
3 Analysing the situation - community engagement and objective data. 35
3.1. Community Perceptions Survey of Waterway Issues 35
3.2. Context analysis of stakeholders in waterway management 41
3.3. Nutrient budgeting survey – obtaining objective data 42
4 Working with vegetable growers – Case studies to monitor farm nutrients 47
4.1. Lockyer Valley Grower case studies 47
4.2. Watsons Creek nutrient monitoring 58
4.3. Bowen nutrient monitoring 60
4.4. Case study summary 65
5 Research trials on vegetable nitrogen requirements and efficiency 66
5.1. Introduction 66
5.2. Experiment 1 - Vegetable crop responses to N rate 66
2 5.4. Experiment 3 - Vegetable crop response to timing of N application 84
5.5. General Discussion 86
6 Technology Transfer 87
7 Recommendations - Scientific and Industry 94
8 Acknowledgements 97
9 References 98
10 Appendices 103
Appendix 1 - Context analysis information for Lockyer Valley, Bundaberg
Bowen and Watsons Creek 103
Lockyer Valley Context analysis 104
Burnett-Mary (Bundaberg) region context analysis 109
Bowen-Gumlu District context analysis 112
Watsons Creek Context analysis 114
Appendix 2 – Nutrient budgeting survey data for key crops 117
Appendix 3 Detailed data from grower case studies 120
Appendix 4 - Effects of vegetable crop residues on soil nitrogen
availability 129
Appendix 5 - Vegetable system nutrient dynamics monitoring 133
Appendix 6 Clean Streams, Sustainable Vegetable Farms - A guide to
managing fertilisers for efficient use and for protecting sensitive waterways 137
Preamble 138
Introduction 138
Section 1: Community approach to waterway protection 139
Section 2: Keeping fertilisers on farm 140
3
Media Summary
This project aimed to develop processes that enable vegetable farmers to address environmental concerns, with respect to sensitive waterways, at a farm and community level. This has been achieved by identifying nutrient [nitrogen (N)] losses, validating nutrient application practices and developing tools to better manage nutrient application in vegetables and processes to engage with communities on issues associated with waterways. The activities were focussed in several vegetable growing regions that impact on sensitive waterways including Watsons Creek (Victoria), Lockyer Valley (Queensland) and Bowen (Queensland).
The project developed a process for engaging with the community on issues associated with waterway management. This included the identification of key collaborators, conducting surveys to identify community perceptions of the main contributors to waterway pollution and a method to resolve these issues.
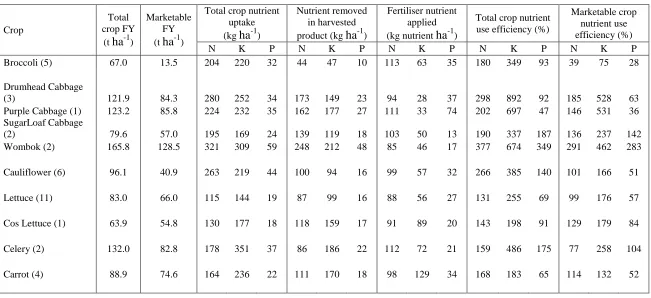
This was further underpinned by survey data, replicated research trials and vegetable grower case studies over three seasons. Nutrient budget surveys conducted in the Lockyer Valley highlighted growers there apply fertiliser at rates at or below crop total nutrient uptake meaning losses of N to the environment are low. For example in lettuce, N application was the same as removal in harvested products but for some brassica crops, application was below crop removal.
Further case studies were conducted in the key regions and this shows some variability in the extent to which nutrients are lost from the farming systems. A series of research trials were conducted that validated crop nutrient requirements for the key crops broccoli, cabbage, cauliflower and celery were greater than the standard grower application rates in the Lockyer Valley. However, for lettuce (Cos and Iceberg) the critical rate for lettuce growth was equivalent to the standard grower practice. Nutrient budgets at Watsons Creek highlighted that use of chicken manure can lead to over-application of N.
The project has developed several key publications and tools including
A good agricultural practice guideline for vegetable farmers that farm in sensitive waterways
The vegetable nutrient removal calculator (“Nutricalc”)
Fact sheet - Fertiliser use efficiency - Matching fertiliser inputs to vegetable crop removal
Fact Sheet - Optimising nitrogen fertiliser use efficiency in vegetables
4
Technical Summary
Agriculture is under increasing pressure to demonstrate that its practices do not present a major pollution risk to the environment. This is particularly the case for vegetable industries that are often located on or near sensitive waterways. The industry needs to demonstrate that it actively implements improved production practices to safeguard the environment particularly for the highly mobile nutrient nitrogen (N).
This project addressed the issue of nutrient management in vegetable production in a holistic manner by:-
Surveying community attitudes and developing a method for effectively engaging with communities
Reviewing nutrient use efficiency data for key vegetables
Assessing the opportunities for optimising nutrient application
Conducting case studies to evaluate fertiliser efficiency and identify the extent to which nutrients are lost
Developing science based knowledge and tools to underpin crop nutrient management strategies in vegetable production
The project operated in several key production areas including the Bowen/Burdekin and Lockyer Valley regions (Queensland) and Watsons Creek (Victoria) each of which are identified as impacting on waterways.
The project developed and evaluated a process on how to work with the community and to gain an insight of community understanding of issues related to sensitive waterways. Community attitude surveys about waterway pollution were conducted in each region as well as the Bundaberg region in Queensland. None of the regions surveyed identified agriculture (vegetable production) as the primary factor in impacting on waterway health though in Watsons Creek it rated more highly than in the Queensland surveys; the latter essentially did not identify vegetable production as a main contributor. In Watsons Creek a manual was developed by the Mornington Peninsula and Western Port Biosphere Reserve Foundation Ltd that provides a process for community engagement on issues of sensitive waterways that is suitable for vegetable growers all over Australia. Furthermore, the project has prepared a tailored good agricultural practice guide for vegetable farming near sensitive waterways and has assembled a detailed suite of reference information on vegetable crop nutrient requirements.
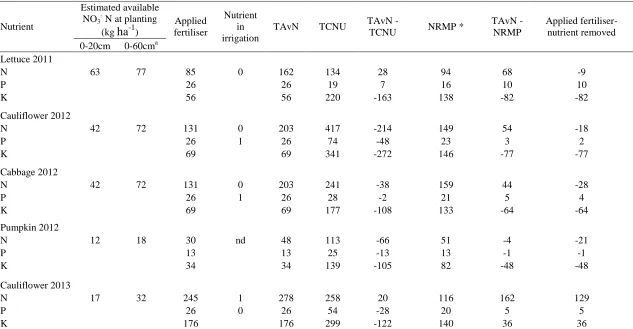
5 Valley vegetable farmers apply N at rates that would be considered marginal for optimal crop growth. This was particularly the case for cabbage and cauliflower where total crop N uptake was in the order of about 350 kg N ha-1 but application was only about 100-120 kg N ha-1. Further case studies of crop nutrient dynamics with two growers over 3 years confirmed negative nutrient budgets over a range of vegetables and showed that soil nitrate reserves to 1.0 m were strongly depleted.
In contrast, the study on lettuce in Watsons Creek found that excessive nutrient was applied to the soil before planting and there was scope to reduce the amount of fertiliser used. Subsequent to this survey, a grower substantially reduced the rate of manure input, which had greatly contributed to nutrient loading. Nutrients were measured in stream water samples from Watsons Creek (Victoria) in proximity to this vegetable grower but it was difficult to draw conclusions since the sample variability was high. The variability related to dynamic changes in nutrient levels depended on stream flow, which varied with wet and dry weather cycles.
A series of research station trials evaluated N effects on vegetables including;
Effect of rate of application from 0-280 kg N ha-1 on lettuce (Cos and iceberg), celery, broccoli, cabbage and cauliflower;
Timing of fertiliser application and formulation effects on vegetables;
Effect of density and N rate on broccoli production.
The data developed confirmed the nutrient budget survey findings that for the Lockyer Valley region the standard application rate of N across six key vegetable crops was below the optimal rate. This positive result indicates that the region carefully manages N and the systems are unlikely to lose N. However, at these standard application rates, N supply is marginal for crop growth and crop productivity could be reduced. Evidence of crop growth response to increasing N rate highlights this effect. Application of 200-300 kg N ha-1 combined with plant densities higher than industry practice (about 60-80,000 plants ha-1) gave high crop yield in broccoli.
For some crops the amount of N removed in harvested product is low in relation to applied N. These crops have a low harvest index where only 25-30% of the crop biomass is harvested (eg. sweetcorn, broccoli) and considerable amounts of nutrient are returned back to the soil as crop residues which is available for the subsequent crops. Hence the use of soil mineral nitrate in the pre-plant phase for the subsequent crop would be useful in developing a full nutrient management budget. This highlights that a whole of cropping approach is required to ensure N continues to be supplied at appropriate rates that take into consideration N extraction by various crops within the rotation. Vegetable crops may require extra N when grown after crops where extraction of N is high with low fertiliser input (e.g., low input grain crops). In contrast, where the N return rate in residues is high, such as in broccoli, the N inputs in a subsequent crop may be reduced depending on that crop’s demand.
6
1.
Introduction
The Australian vegetable industry is coming under increasing pressure to demonstrate that its production systems do not present a major pollution risk to the environment and where a risk is seen to exist, to demonstrate that they are actively implementing improved production practices to safeguard the environment. Of particular concern is the potential for off-site movement of nutrients, particularly nitrogen (N) into ‘sensitive waterways’. In Queensland this includes the catchments draining into the Great Barrier Reef (GBR) Marine Park (Bowen/Burdekin), the RAMSAR-listed Moreton Bay (Lockyer and Fassifern Valleys); and in Victoria, the Yaringa Marine National Park (Watsons Ck). Melbourne Water has identified vegetable growers at Watsons Creek as significant contributors to water quality and in South East Queensland the Lockyer Valley is also identified by SEQ Water as a major contributor to poor water quality. In Queensland, legislation was enacted to ensure that graziers and cane producers in coastal catchments associated with the GBR lagoon are having minimal environmental impact on the GBR. Hence the issue of GBR water quality is a key political concern and in Queensland about 60% of vegetable production is in the catchments that drain to the GBR and about 30-35% is in the catchments draining to Moreton Bay.
Protection of the environment and farm profitability are not mutually exclusive as research and technology for improving productivity in many cases also address environmental issues. For example, improving nutrient management and monitoring reduces input costs and off-site movement of nutrients. Similarly, limited availability of water in many vegetable production regions of Australia has led to improvements in water use efficiency through water scheduling and improved irrigation and fertigation systems.
There are however major challenges to growing quality vegetables in Australia. These include high summer rainfalls on fallowed land in the north as well as extended droughts alternating with flood events, salinisation of the soil profile due to water quality and quantity issues, and low soil organic carbon levels impacting on nutrient cycling, water-holding capacity and erodibility of the soil. Furthermore, horticultural production operates mostly in peri-urban regions where their potential environmental impact evokes extra sensitivity, and practices may be closely scrutinized by the community that shares the land and water resource.
7 (Moreton Bay Partnership 2006). Data from Harper (2009) show that soil nitrate levels in the Lockyer Valley are historically high at 25 mg kg-1 averaged across 750 samples over a 12 year period. A study by Basakran et al. (2001) found incidence of elevated nutrients in some samples analysed as part of a systematic assessment of the groundwater quality of Bowen aquifers. Similarly, elevated groundwater nitrate levels have been identified in association with intensively managed vegetable production systems in the Lockyer Valley (Wills et al.
1996). In Victoria, a recent survey of manure usage has shown that growers are not using scientific approaches to manure application, and usage rates per hectare vary by as much as 100% (Premier et al. 2004).
There is an urgent need to develop science-based data and tools to enable the vegetable industry to objectively assess and facilitate improvements in soil and nutrient management on a soil, site and crop-specific basis. Furthermore, vegetable growers as an industry must be able to substantiate that they follow responsible and sustainable management practices that minimize their impact on the environment.
To address these issues the vegetable industry in 2008 made a general call for project submissions to address the issue of environmental effects of vegetable production on ‘sensitive’ waterways. Three project applications were received from teams and the Vegetable Industry Advisory Committee organized a meeting in Brisbane from which a consortium of two teams [Queensland (Burdekin Burnett and Lockyer Valley regions) and Watsons Creek, Victoria] developed the final joint project.
8
2.
Literature review of nitrogen management in lettuce, broccoli,
cabbage, cauliflower and capsicum.
2.1.
Introduction
Worldwide, the use of nitrogen (N) fertilisers is under increased scrutiny (Breschini and Hartz 2002; AbuRayyan 2004). Vegetable crops are intensively produced and in conventional production systems require considerable inputs of fertiliser N. Nitrogen that is not converted into crop biomass is at risk of contaminating the environment (Broadley et al. 2003). The perception that high nitrate-containing crops, in particular lettuce and spinach, may be detrimental to human health (Reinink 1992) has led to the definition of maximum allowable nitrate levels by the Commission of European Communities (Broadley et al. 2003). In evaluating fertiliser responses by broccoli, increasing the price of N fertiliser largely does not affect the economics of N application to the crop (Bakker et al. 2009a). In support of this, the cost of N fertiliser in lettuce production at an application rate of 140 kg ha-1 represents less than 1% of total cost and though important, is small relative to other costs (Harper unpublished). Hence the drivers for adoption of improved nutrient management do not generally relate to cost of fertiliser product but rather environmental and human health factors.
Many strategies are available to more efficiently manage fertiliser inputs into vegetable crops including improved genetics of uptake (Reinink 1992), varietal selection for N use efficiency (Rather et al. 1999), understanding crop N uptake profiles (Sullivan et al. 1999), and use of diagnostics such as soil and tissue nitrate and total N (Huett and White 1992; Everaarts and DeMoel 1995; Breschini and Hartz 2002). Furthermore, other crop agronomic factors such as crop harvest index, irrigation, form of fertiliser, and plant density also affect nutrient use efficiency (Sanchez et al. 1994; Abu-Rayyan et al. 2004; Erley et al. 2010).
This literature review identifies nutrient removal rates for the key vegetable crops of lettuce, brassicas (cabbage, cauliflower and broccoli) and capsicum, strategies to better manage nutrient inputs, and issues associated with nutrient management in these crops.
2.2.
Lettuce
2.2.1. Lettuce growth
9 of maturity (Figure 2.2) and lettuce is essentially harvested at the end of the second rapid linear N uptake phase. Hence N uptake continues throughout the development of a lettuce crop.
Some published yield data for lettuce are presented in table 2.1. The maximum photosynthetic rate for lettuce occurs at a leaf N concentration of 3.6% and net photosynthetic rate ceases at an N concentration below 2% (Broadly et al. 2001). The partitioning of N to various plant parts also depends on N supply. Under low N supply, lettuce root systems contained about 13.6% of the plants N, but at a luxury N supply the root system contained a lower proportion of N (about 4-5.5%) (Holness et al. 2008). Soundy et al.
(2005) evaluated effects of N supply on leaf N content and root to shoot ratios in Iceberg lettuce (cv. South Bay) seedlings. At 28 days after sowing the root to shoot ratio decreased from about 1 at 0 mg N L-1 to about 0.1 to 0.2 at 120 mg N L-1. Excessive N application favoured shoot development at the expense of root system development.
Figure 2.1 Typical plant cumulative biomass and N uptake over time and rate of N uptake. (from Sullivan
10
Figure 2.2 Typical vegetable crop growth responses and maturity.
In support of this Broadley et al. (2003) grew lettuce plants (Lactuca sativa var. capitata cv Kennedy) hydroponically up to 74 days under treatments where N was supplied throughout (control) or N was removed at 35 days or 54 days. Shoot fresh and dry weights were substantially reduced when N was withheld at 35 and 54 days highlighting the direct relationship between N and lettuce growth.
Table 2.1 Lettuce crop fresh yields obtained from the literature.
Crop and Variety Yield (t ha-1) Reference Comments Lettuce – Romaine
cv. Lital
61-66 (Bozkurt et al. 2009) Irrigation optimal
Lettuce (Various types)
33.5-46.9 Breschini and Hartz 2002) Sampling from 15 farms 56-72,000 plants per ha
Lettuce (not specified)
24-38 (Thorup-Kristensen 2006) Marketable product yield
Lettuce - Butterhead Lettuce - Romaine Lettuce - Looseleaf
13.8 17.0 18.6
(Simonne et al. 2001) (Simonne et al. 2001) (Simonne et al. 2001) Lettuce Iceberg cv.
Salinas
93-100 McPharlin et al. 1995
2.2.2. Effects on Dry Matter
11 control plants over time but decreased in treatments where N supply was restricted. Similarly, the shoot to root ratio decreased in treatments where N supply was restricted. In contrast, Gunes et al. (1994) reported a narrow range of dry matter concentrations (DM%) in two lettuce cultivars, ranging from 2.77% -2.93% at 8 weeks. In most studies evaluating yield of lettuce, dry matter production is not reported.
2.2.3. N concentration
In the experiment of Broadley et al. (2003), the total N concentration in the control was between 4 and 5% over the duration of the experiment, whereas in the 35 and 54 day treatments total N was similar up to the point when N removal was imposed, but declined rapidly to less than 2% for the duration of the experiment. In all treatments, nitrate N decreased until midseason growth (from 2% to about 0.2% nitrate-N per unit dry weight) and then increased only in the control to a maximum of about 1.5 % nitrate-N per unit dry matter). The relationship between organic N or total N and growth rate was a better indicator for growth than was the nitrate relationship (Broadley et al. 2003).
Broadley et al. (2000) determined the N concentration in lettuce plants 62 days after planting was about 5.8% in well-supplied plants and only 2.2% in nitrogen-limited plants where N was withheld at 47 days after sowing. In contrast, Soundy et al. (2005) determined leaf tissue N concentration in 4 week old seedlings was relatively stable at about 2.4%.
2.2.4. Rates of application and responses
Worldwide, the identified optimal and recommended application rates for N in lettuce vary considerably (Walworth et al. 1992; Simonne et al. 2001). A wide range of N application rates is recorded in the literature (Table 2.2).
Walworth et al. (1992) determined that maximum lettuce (cv. Salinas) head weights were obtained at between 56 and 112 kg N ha-1, plateaued at 112 kg N ha-1 and did not increase with further N rate increase to 280 kg N ha-1. Optimising the N application rate reduced the time to maturity by about 1-2 days compared with other higher N treatments.
Stone (2000) evaluated the effects of 0, 30, 60, 120 and 180 kg N ha-1 on lettuce cv Saladin (an iceberg type) over two seasons. A treatment with N as 20 kg ha-1 liquid urea was also evaluated. The pre-plant soil nitrate N was equivalent to 67 kg ha-1 in 0-30 cm in year 1 and 41 kg ha-1 in year 2. Lettuce dry matter yield increased from 11.6 to 12.2 tonnes per ha from 0-30 kg N ha-1 but then declined linearly with an N rate increase to 180 kg N ha-1 (a yield of 9.5 tonne ha-1). Lettuce total fresh yield increased linearly from 39 tonne ha-1 at 0 kg N ha-1 to a yield of 45 tonne ha-1 at 120 kg N ha-1. In the subsequent year’s trial, lettuce marketable yield (total yield not reported) increased linearly from 5 tonne ha-1 at 0 kg N ha-1 to 20 tonne ha-1 at 80 kg N ha-1.
12
Table 2.2 Nitrogen application rates (kg ha-1) for lettuce, obtained from literature.
Crop and Variety N Rate (kg ha-1)
Reference comments
Lettuce – Iceberg cv. Salinas
230-344 (McPharlin et al.
1995) Lettuce Iceberg cv
Salinas
56-112 (Walworth et al.
1992) Lettuce - Butterhead
Romaine and looseleaf
126 (Simonne et al.
2001)
Lettuce - Romaine 224-370 (Thompson and Doerge 1995 Lettuce – Romaine
cv. Green Romaine
140 (Holness et al.
2008) Lettuce Iceberg cv
Saladin
80-120 (Stone 2000) (optimal rate trialled)
Lettuce – Various 178 - 380 Breschini and Hartz 2002
Survey of 15 grower across various cultivars
Thompson and Doerge (1995) showed that maximum marketable yield (60 tonne ha-1) for romaine lettuce was obtained at an N rate of 200 kg ha-1, but at this rate only 120 kg N ha-1 could be accounted for in lettuce biomass, giving a low N use efficiency of 60%.
The N uptake for above ground parts of romaine lettuce and iceberg lettuce were 107 kg N ha-1 and 130 kg N ha-1 respectively (Breschini and Hartz 2002). Ludwig (2001) cites N removal in lettuce at 0.24 kg N per 100 kg fresh weight. On a 50 tonne ha-1 crop, this gives an N removal in harvested product of about 120 kg N ha-1 and interestingly for potassium, the reported figure is 250 kg ha-1.
2.2.5. N forms
Considerable research has evaluated the release rates of mineral N from cover crops including legumes and cereals and specifically in relation to lettuce nutrition (Wyland et al.
1995; Thorup-Kristensen 2006; Holness et al. 2008).
Holness et al. (2008) applied N at 26, 52 and 78 kg ha-1 as a rye and clover cover crop amendment combined with 70, 140 and 210 kg N ha-1 to lettuce as ammonium nitrate in a glasshouse pot study. The cover crop did not improve yield but contributed 15% of the crop’s N requirement. Despite this, they showed that the rate of mineralisation of N from crop residues was not sufficient to meet the N requirements for high demand crops including lettuce and broccoli.
13 as mineral N from the green manures. The total N contained in the above ground plant product was 64-101 kg ha-1 for cabbage, 64-89 kg ha-1 for onion and 45-72 kg ha-1 for lettuce.
Wyland et al. (1995) evaluated the uptake of N from a cover-cropped field and found that only about 28% of the 15N, labelled in the cover crop, was recovered in the lettuce crop indicating mineralisation of organic matter did not sufficiently meet lettuce crop N requirements.
Research into the effects on lettuce growth of various mineral N fertiliser forms is limited. Stone (2000) found that lettuce yield under a 30 kg ha-1 N as urea-ammonium-nitrate treatment was the same as in a treatment with about 80 kg N ha-1 as broadcast ammonium nitrate. Shoot dry weight at 4 weeks was also significantly higher in the urea-ammonium-nitrate treatment, injected below the seedling at transplant at 30 kg N ha-1, compared with a broadcast application of ammonium nitrate at 30 kg N ha-1. The application of small rates of starter N fertiliser below the seedling increased N fertiliser recovery.
Abu-Rayyan et al. (2004) conducted a trial to evaluate the optimum planting density, N form and irrigation in lettuce, aiming to lower nitrate content and environmental impact. They evaluated three fertiliser forms: calcium nitrate, ammonium sulphate and urea, which were applied at 3 times to a rate of 100 kg N ha-1. The highest dry matter yield was recorded with ammonium sulphate, then calcium nitrate, then urea (plant yields of 44, 36, 26 g plant-1 respectively). However, the experiment was not balanced for sulphur and calcium inputs and part of this fertiliser form effect could have been attributed to a specific mineral nutrient response. The highest NUE was recorded for ammonium sulphate, perhaps suggesting there may have been a sulphur limitation.
Notwithstanding, the nitrate content varied with N fertiliser form. The highest nitrate N concentration was recorded with calcium nitrate (198.5 mg N kg-1 inner leaf and 710 outer leaf mg N kg-1), then (ammonium sulphate 52 mg N kg-1 inner leaf and 417 outer leaf mg N kg-1) and then urea (66 mg N kg-1 inner leaf and 519.5 outer leaf mg N kg-1). In support of this, Gunes et al. (1994) compared the effect of different solution N constituency on nitrate content of nutrient film technique (NFT) grown lettuce. The use of a predominantly nitrate based solution (94%) resulted in much higher plant nitrate concentrations than did an ammonium-based solution (with 74% nitrate) or a proteinate-based solution (with 74% nitrate). Lettuce from the high nitrate treatment had 0.44% nitrate on a fresh weight basis whilst the other 2 treatments had 0.37% and 0.36% for the ammonium-N and proteinate-N treatments, respectively.
2.2.6. Lettuce nutritional diagnostics
Considerable research has been conducted to develop diagnostic criteria for lettuce nutrition and particularly N (eg. Huett and White 1992, Breschini and Hartz 2002, Broadley et al.
2003).
2.2.6.1. Soil nitrate
pre-14 sidedress soil nitrate as an index for N sidedress requirements for iceberg and romaine lettuce. Prior to sidedress, a composite soil sample to 30 cm was taken and nitrate-N determined. If the soil nitrate N was greater than 20 mg kg-1 no N was applied and if it was below this threshold, N was applied at an amount to increase it to 20 mg N kg-1. Across the 15 cooperating growers, the averaged total rate of N application was 257 kg N ha-1 including 1-3 sidedressings of 194 kg ha-1. Using the pre-sidedress soil nitrate criterion, total N application was reduced by 43% and the sidedressing by 57%. Importantly, total yield was unaffected and net N uptake was similar for the grower’s standard practice and the criterion-based practice. At harvest, the pre-sidedress soil nitrate plots had on average 8 mg kg-1 less nitrate-N in the top 90 cm, indicating much lower N leaching risk. Despite the large difference in fertiliser application (178-380 kg ha-1), the nitrate in midrib did not vary considerably, averaging about 7.7 g NO3--N kg-1 (dry weight basis) and well above the
sufficiency level of 6 g NO3--N kg-1 suggested by Lorenz and Tyler 1983. In 2 fields, midrib
nitrate was well below this at 3.1 and 3.4 g NO3--N kg-1 but yield was not affected and total
leaf N was above the sufficiency critical value of 3.0%. The use of midrib nitrate was not correlated with total N and total N in heads at harvest was above the sufficient level of 2.5% set by Lorenz and Tyler (1983).
2.2.6.2.Plant nitrate
Despite a large difference in fertiliser application (178-380 kg ha-1) to lettuce across 15 sites, the nitrate in midrib did not vary considerably, averaging about 7.7 g NO3--N kg-1 (Breschini
and Hartz 2002). This value was well above the sufficiency level of 6 g NO3--N kg-1
suggested as a critical value by Lorenz and Tyler (1983). In support of this sufficiency level, Fontes et al. (1997) found that maximum plant dry weight was determined at leaf nitrate concentration of 6.0 g NO3--N kg-1 (dry weight basis). However Breschini and Hartz (2002)
found that the midrib nitrate was well below this critical value at 3.1 and 3.4 NO3--N kg-1 but
yield was not affected. The use of midrib nitrate was not correlated with total N and was not a reliable diagnostic tool for lettuce N status.
Stone (2000) showed lettuce nitrate-N increased linearly from about 0.5 NO3--N kg-1 (dry
matter basis) to about 5 NO3--N kg-1 with increasing N applications from 0 up to 240 kg N
ha-1, irrespective of the form in which N was applied. Though other research shows that nitrate N concentration varies considerably with form of N applied (Gunes et al. 1994), Abu-Rayyan et al. (2004) showed that nitrate-N concentration varied considerably with form of applied N fertiliser and the maturity of leaf. The total leaf N concentration (on a dry matter basis) is a far more reliable diagnostic tool for N sufficiency in lettuce (Breschini and Hartz 2002).
2.2.6.3.Total plant N
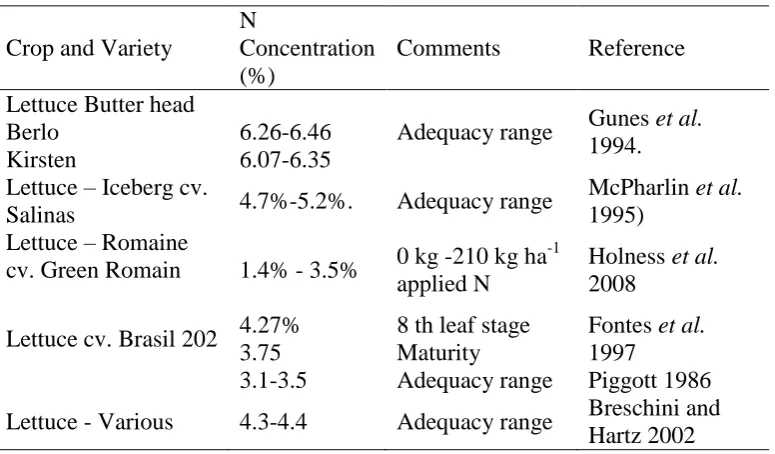
Concentrations for total N in lettuce obtained from the literature are presented in Table 2.3. Gunes et al. (1994) reported total N concentration in two Romaine lettuce cvs at 8 weeks varied from 6.07-6.46%.
15 the order of 2.6%. The reported lettuce total N concentrations also vary considerably with plant age (Table 2.4, Huett and White 1992). Since the volume of non-photosynthetic biomass of plant tissue increases proportionally over time the relative plant growth and plant N concentration effectively decrease over time since the non-photosynthetic tissue contains less N (Broadley et al. 2003). Consistent with this, the heart tissue of lettuce contains less N than does the outer leaf tissue.
Table 2.3 Nitrogen concentrations in dry lettuce tissue (%) obtained from literature.
Crop and Variety
N
Concentration (%)
Comments Reference
Lettuce Butter head Berlo
Kirsten
6.26-6.46 6.07-6.35
Adequacy range Gunes et al. 1994.
Lettuce – Iceberg cv.
Salinas 4.7%-5.2%. Adequacy range
McPharlin et al.
1995) Lettuce – Romaine
cv. Green Romain 1.4% - 3.5% 0 kg -210 kg ha
-1
applied N
Holness et al.
2008
Lettuce cv. Brasil 202 4.27% 3.75
8 th leaf stage Maturity
Fontes et al.
1997
3.1-3.5 Adequacy range Piggott 1986
Lettuce - Various 4.3-4.4 Adequacy range Breschini and Hartz 2002
Huett and White (1992) conducted a comprehensive study of N nutrition in lettuce and evaluated the effects of a range of N solution concentrations (30-500 mg N L-1) in potted sand culture. The data from this study are presented in Table 2.4. Petiole sap N concentration increased over the 8 week growing period and the critical sap nitrate value in the youngest fully expanded leaf was about 1.0 g nitrate-N L-1 at 4-5 weeks. In the deficient plants it was about 0.5 g L-1. Nitrogen at the highest rate resulted in greatly increased nitrate N (2.4 g L-1) compared with about 1.2 g L-1 in the optimal N treatment. Plant total N increased with increasing N rate but decreased in all index leaves over time. The critical total N concentration was about 5% at 3 weeks, 4.8% at 4 weeks and 4.4% at 5 weeks. In contrast in deficient plants total N declined from 4% at 3 weeks to about 3% at 5 weeks. In marginally supplied plants total N concentration was 4.5% at 3 weeks and about 3.7% at 5 weeks. In bulked samples the total N in adequately supplied plants was greater than 4% at 3 weeks and 3.3% at 5 weeks. The results indicated that critical total N values could be used to differentiate between deficient and adequately N-supplied lettuce but total N could not differentiate toxicity from adequacy.
16 excessive application.
Table 2.4 Lettuce leaf tissue N concentrations critical for growth at 90% maximum yield at 1 and 2 weekly intervals after transplanting. YFOL, youngest fully opened leaf; YFEL, youngest fully expanded leaf; OL, oldest green leaf [from Huett and White (1992)].
Plant part Weeks after transplanting
1 2 3 5 7 8
Nitrate-N concentration in petiole sap (g/L)
YFOL 0.50 0.30 0.43 0.57 0.87 0.97
YFEL 0.50 0.30 0.50 0.80 0.95 0.90
OL 0.40 0.70 1.60 1.20 0.90 1.00
Total N concentration in leaves (%)
YFOL 5.03 5.45 5.60 4.25 3.90 3.83
YFEL 5.03 5.30 4.90 4.25 4.05 4.00
OL 4.15 3.90 3.30 3.00 3.18 3.23
Bulked leaf 3.9 4.38 3.33 4.15 3.65 3.78
The total N content in lettuce varies depending on the source and rate. At harvest, the total N content in lettuce was about 1.19% for calcium nitrate, 1.47% for ammonium sulphate and 1.14% for urea whilst in a nil applied N treatment, the N content was only 0.47% (Abu-Rayyan et al. 2004).
2.2.7. Strategies for reducing N application in lettuce
N efficiency can be achieved by growing N efficient genotypes and optimising N supply to meet crop requirements. Genetic variability has been demonstrated for N uptake in lettuce germplasm (Reinink 1992). Breschini and Hartz, (2002) evaluated the use of pre-sidedress soil nitrate testing as a basis for N application and showed that, using the criteria, nitrogen accumulation in total above ground biomass was 5-6 kg ha-1 higher and total N application 110 kg N ha-1 less than that in the growers standard fertiliser practice.
Thorup-Kristensen (2006) evaluated the rooting depth of 4 vegetables in an organic production system. The rooting depths of key vegetables were: lettuce (0.6 m), onion and carrot (0.3 m) and cabbage 1.1 m. They suggested that NUE could be improved by matching crop root system development to soil N to depth. Using a mini-rhizotron and mini video camera they determined that the rate of root development was fastest for cabbage and lettuce (1.19 and 1.25 mm day oC-1) compared with onion and carrot. This, combined with root system development, could be used to tailor vegetable production to optimise N recovery.
2.2.8. Lettuce quality and N
There is an understanding that over-application of N reduces quality in lettuce (Cuppett et al.
17 amount of nitrate in the harvested products. Nitrate-based fertilisers tend to result in higher nitrate levels than alternative, mostly ammonium-based forms (AbuRayyan 2004). Breschini and Hartz (2002) found that lettuce storage quality, visual quality, decay and discolouration were not affected by N rate.
2.3.
Brassicas
2.3.1. Brassica growth
Both the growth and N uptake of brassicas follow a typical sigmoidal response (Sanchez et al. 1994). Broccoli head yield increases curvilinearly with increasing N rate to a maximum of about 400 kg ha-1 (Toivonen et al. 1994). Similarly, a quadratic relationship between N rate and DM yield was shown where dry matter production levelled off with increasing N rate (Everaarts and Booij 2000).
However, despite this response, net dry matter production is more greatly affected by seasonal variability in growing conditions. For example, Erdem et al. (2010) showed that broccoli cv Jade yield was considerably higher in a spring crop (11.02 t ha-1) compared with an autumn crop (4.55 t ha-1) at the same rates of N application. The net accumulation of dry matter also varies considerably within a season and across N treatments. Within season N accumulation in broccoli cvs Decatholon and Captain varied considerably from 1-16 kg N ha-1 d-1 (Bakker et al. 2009b). Despite there being these levels of variability, there was no effect of N on crop maturity in brassicas (broccoli) (Zebarth et al. 1995). Similarly, cauliflower curd maturity across cvs was not affected by N application rate but average curd weight was (Rather et al. 1999).
2.3.2. Effects of N on Brassica yield and dry matter
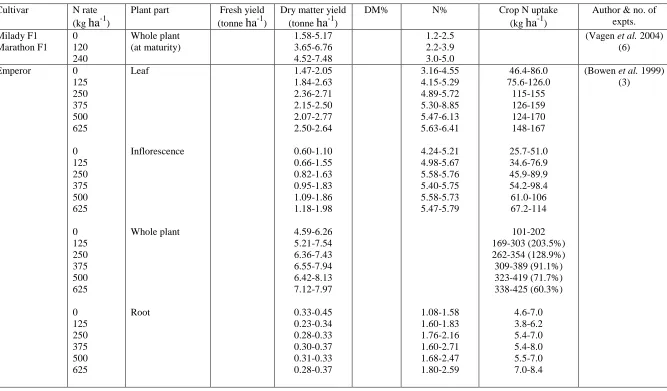
Within the literature, the effect of N on yield of broccoli, cabbage and cauliflower is substantial (Toivonen et al. 1994; Csizinszky 1996; Batal et al. 1997; Everaarts and De Moel 1998; Bowen et al. 1999; Alt et al. 2000; Everaarts and Booij 2000; Vagen et al. 2004; Yoldas et al. 2008; Erley et al. 2010). Data taken from the literature for broccoli, cabbage and cauliflower, including rate of N application, fresh and dry matter yield, dry matter content (DM%), N concentration (N%), Crop N uptake (kg ha-1), references, cultivars and plant parts are presented in Tables 2.7, 2.8 and 2.9.
In two seasons, dry matter yield of cauliflower cv. Fremont was 2.50 and 2.80 tonne ha-1 in a 0 N treatment but increased substantially in the higher N treatment (450 kg ha-1) where the dry matter yield was 7.0 and 4.0 tonne ha-1 (Alt et al. 2000).
18 increasing N application (Csizinszky 1996; Everaarts and de Willigen 1999). In a series of experiments, head dry matter content (Broccoli cv Emperor) was consistently highest in the 0N treatments (10.4-12.2%) compared with that at N rates of 212-372 kg ha-1 where the DM% was 8.6-10.7% (Everaarts and de Willigen 1999). The effect of increasing N rate on reducing DM% was consistent across all plant parts (curd, leaf and stem) in broccoli (Csizinszky 1996). Furthermore, brassica dry matter content decreased linearly with tissue N concentration (Everaarts and Booij 2000). In contrast to other studies, McKeown et al. (2010) found cabbage DM% increased with increasing N rate to 400 kg ha-1 but the data were not specified.
2.3.3. N forms and methods of application
The form of applied N also affects the N concentration of brassica plant tissue (Liu and Shelp 1993; Atanasova 2008). Varying nitrate to ammonium concentrations resulted in considerable differences in N concentration in broccoli (Liu and Shelp 1993). Furthermore, broccoli plants fed solely with ammonium were stunted and maximum biomass yield was recorded at a nitrate to ammonium ratio of 75-25 (Liu and Shelp 1993). Across treatments, the total N% in mature leaves decreased with increasing nitrate from 7.55 to 3.0%, in young leaves it declined from 7.2 to 5.5% and in the florets it decreased from 7.0% to 6.0%.
Atanasova (2008) compared the effects of two N fertilisers (calcium nitrate and ammonium nitrate) on N concentration in white cabbage cv Balken. Under both forms of N, N concentration increased with increasing rate. However, under the highest N treatment (1000 kg N ha-1) the N concentration in the calcium nitrate treatment (3.96%) was considerably higher than that in the ammonium nitrate treatment (3.0%), which was in contrast to the results for Broccoli of Liu and Shelp (1993).
Irrigation water can contain considerable amounts of nitrate-N and Bakker et al. (2009b) reported 27 kg ha-1 N was contained in irrigation water.
Various research projects have evaluated effects of split application, banded and broadcast N fertiliser application in brassica crops (Everaarts and DeMoel 1995; Everaarts et al. 1996; Everaarts and de Willigen 1999; Everaarts and Booij 2000). Across many trials no consistent benefit in fertiliser efficiency was determined between banded and broadcast application and N uptake across treatments was similar. Furthermore, split application also did not infer increased yield or fertiliser use efficiency (Everaarts and de Willigen 1999).
Holness et al. (2008) evaluated the role of cover-crops in supplementing broccoli N requirement. They applied N at 26, 52 and 78 kg ha-1 as rye and clover cover crop in pots with additional treatments of 112, 224 and 336 kg N as ammonium nitrate. The cover-crop did not improve yield and contributed only 17% N for broccoli. They concluded that the rate of mineralisation of N from crop residues was not sufficient to meet the N requirements for broccoli- a high demand crop.
2.3.4. Rates of application and responses
19 2009b). The recommended rate of N application for cauliflower in the Netherlands is 225 kg N minus the residual soil nitrate to 60 cm (Everaarts 2000). Despite this, within the literature, broccoli biomass production increases to N rates in the order of 300-400 kg ha-1(Toivonen et al. 1994; Zebarth et al. 1995; Bakker et al. 2009a).
Over 3 separate experiments, broccoli (cv Emperor) head weight increased with increasing N rate generally to about 375 kg ha-1 (Toivonen et al. 1994). Bakker et al. (2009a) evaluated the effects of N at 0, 50, 100, 150, 200, 300, 400 kg ha-1 on marketable yield of broccoli cv Decatholon and Captain across 2 years. Yield was about 6 t ha-1 in the 0 kg ha-1 treatment and increased with increasing N to about 14-16 t ha-1 at about 200 kg ha-1. They determined that the most economic rates were about 298-309 kg ha-1. Maximum yield of broccoli cv Emperor across three seasons was at 375 kg N ha-1 and ranged from 13-19 t ha-1 fresh weight (Zebarth
et al. 1995). Total number of broccoli heads harvested was not affected by N application up
to 196 kg ha-1 but average head weight increased with increasing N (Everaarts 1994).
Visual symptoms of N deficiency in cabbage were observed at N rates below 300 kg ha-1 (Zebarth et al. 1991). Above ground DM yield in white cabbage cv Heckla at final harvest varied from 11.0-14.6 t ha-1 and increased progressively across N treatments of 0-250 kg N ha-1 and N uptake by the whole plant ranged from 165-296 kg ha-1 in the 250 kg ha-1 treatment (Ekbladh et al. 2007). Total plant N uptake was 270 kg ha-1 in the 250 ha-1 N treat and 140 kg ha-1 N in the 0 ha-1 N treatment. McKeown et al. (2010) evaluated the effects of N at 0, 59, 200, 341 and 400 kg ha-1 on Brassica oleracea capitata cv. Huran and found marketable yield increased with increasing rate of N application with maximum yield recorded at 333 kg ha-1 N (based on regression analysis). Yield in the 0 kg ha-1 N treatment was 30 t ha-1 and 100 t ha-1 at 400 kg ha-1.
2.3.5. Brassica Diagnostics
2.3.5.1.Soil nitrate
Soil nitrate is a useful tool in evaluating brassica crop N requirements (Everaarts and DeMoel 1995; Alt et al. 2000). Good correlation between yield and N availability (mineral N in the 0-60 cm at planting) was determined in Dutch cauliflower production (Everaarts and DeMoel 1995). On this basis the optimum application rate is recommended as 225 kg ha-1 N less the mineral N content in the 0-60 cm soil zone. This highlights the significance of pre-plant mineral N soil test values as a tool for optimising N application rates. However, the estimated crop requirement rate of 225 kg ha-1 is on the low end of literature data on brassica crop N requirement (Tables 2.7, 2.8 and 2.9). However, the within season mineralisation of N may contribute substantial amounts of N depending on soil temperature and the size of the soil organic matter pool. In support of this, Bakker et al. (2009b) found that during the season N supplied from soil to a broccoli crop was estimated to be in the order of about 130 kg N ha-1.
20 The N recovery from soil by brassica crops is very high (Erley et al. 2010) and total residual nitrate content was about 40 kg ha-1 at 0-90 cm after harvesting a cabbage crop. The majority of N in Ccauliflower is taken up from the 0-30 cm soil zone (Everaarts 2000).
2.3.5.2.Plant nitrate
The application of N fertiliser increases brassica tissue (leaf and curd) nitrate-N concentrations (Zebarth et al. 1995; Alt et al. 2000; Belec et al. 2001; Šturm et al. 2010).
With the application of 200 kg ha-1 N, nitrate concentration of cabbage (Šturm et al. 2010) increased substantially and the concentration of nitrate in leaves of cabbage varied considerably depending on the position of leaf (inner , middle and outer ) (Table 2.5). In unfertilised plants, the nitrate concentration between leaf parts was not significantly different and was lower than in fertilised treatments. In the treatments that received fertiliser, outer leaves had considerably higher nitrate concentrations than the middle and inner leaves; the latter which had the lowest concentrations. In contrast to this finding, cabbage head nitrate N was close to 0 mg kg-1 up to 200 kg ha-1 applied N and from this rate increased linearly to 83 and 41 mg kg-1 nitrate-N FW at 500 kg ha-1 applied N in 1987 and 1988 (Zebarth et al. 1991). Even at the considerably higher N rate in the study of Zebarth, the nitrate concentrations were considerably lower than that recorded by Šturm et al. (2010) in their 0 kg ha-1 N treatment, highlighting considerable variability in nitrate concentrations.
Table 2.5 Nitrate content in different leaves of cabbage at final harvest from Šturm et al. (2010).
Nitrogen rate (kg N ha-1)
NO3- (mg kg-1 Fresh Weight)a
inner middle outer
0 344 228 324
200 544-775 753-1305 1,222-1,686
a
For conversion to nitrate-N multiply by 0.266
In a similar way, high variability in broccoli head nitrate concentration is recorded. The nitrate concentration in broccoli cv Emperor heads increased substantially with increasing N rate (Zebarth et al. 1995). Across 3 seasons the nitrate concentration in broccoli heads ranged from about 80 to 140 mg kg-1 FW at N application rates of 375-625 kg ha-1 (Zebarth et al.
1995). In the 0 N treatment the nitrate concentration varied from about 4 to 20 mg kg-1 fresh weight. Bakker et al. (2009a) found that broccoli head nitrate concentration increased linearly from 0-15 mg nitrate-N kg-1 (dry weight) in a 0 kg ha-1 N treatment to 463-1,539 mg nitrate-N kg-1 in a 400 kg N ha-1 treatment; however the values varied considerably across years. Allowing for an average of 11% dry matter content in broccoli curd (Harper unpublished) these values in equivalent fresh weight terms are approximately 0-1.6 mg nitrate-N kg-1 in the 0 kg ha-1 N treatment and 51-169 mg nitrate-N kg-1 in the 400 kg ha-1 treatment. High year-to-year variability in broccoli nitrate N was recorded, suggesting that environmental factors play a major role in accumulation of nitrate in plant tissue.
21 tissue was consistently related to N rates but environmental factors precluded its use for developing an absolute threshold for nitrate sufficiency in the sap. In contrast to this finding and other findings on brassica total N concentration, Alt et al. (2000) found the leaf nitrate concentration increased with growth over time in cauliflower cv. Fremont whilst total N content declined.
2.3.5.3.Brassica tissue total N concentration
Irrespective of N treatment the N concentration of brassica plant tissue decreases from early growth through to maturity, but the decrease in N concentration tends to be greatest in treatments where no N is applied (Vagen et al. 2004; Ekbladh et al. 2007).
Within the literature, data on the N content of plant tissue varies considerably across deficient and adequate rates of application in brassicas (Tables 2.7, 2.8 and 2.9). Importantly, in various studies N concentrations that are deficient in some studies were shown as adequate in others. For example, Vagen et al. (2004) showed N concentration in broccoli at 240 kg N ha-1 was 3.0-5.0% whilst in an N deficient treatment (0 kg N ha-1 applied) Bowen et al. (1999) found similar plant tissue N concentrations which ranged from 3.16-4.55%. This highlights that considerable seasonal variability or genetic uptake differences more greatly influence brassica tissue N concentration than N application rate alone. Notwithstanding, Vagen et al.
(2004) determined a critical N deficiency concentration for biomass yield of about 2% for broccoli.
The N content in the young leaf of cauliflower cv. Fremont (Alt et al. 2000) was 4.8% in a 0 N treatment and increased to 6.0% in the 150, 300 and 450 kg N ha-1 treatments. At 300 and 450 kg N ha-1, leaf N content declined during growth and nitrate-N increased, but leaf N content remained the same in the 0 N treatment. In all treatments, the N concentration decreased with growth over time but tissue N concentration was highest in the 450 kg N ha-1 treatment (4.2 %) and progressively decreased with decreasing N rate; 3.7% in the 300 kg N ha-1, 2.0% in the 150 kg N ha-1 and 1.9% in the 0 kg N ha-1 treatments. Despite the application of 150 kg N ha-1, the difference in N concentration between the 0 and 150 kg N ha-1 treatments was not substantial.
The concentration of N within the plant varies considerably, with the outer leaves having a higher N concentration than the middle or inner leaves in cabbage (Šturm et al. 2010) (Table 2.6).
Table 2.6 Total nitrogen content (%) on a dry matter basis in different
leaves of cabbage at final harvest from Šturm et al. 2010.
Nitrogen rate (kg N ha-1)
Total N (%)
inner middle outer
0 1.62 1.30 1.93
22
2.3.6. Brassica Root system N
White cabbage has a large and evenly distributed root system that can reach a depth of 2-2.5 m (Erley et al. 2010) and consistently reaches 1.1 m (Thorup-Kristensen 2006), giving cabbage a strong ability to absorb N from across the soil profile.
Bowen et al. (1999) evaluated root system growth in broccoli and found that dry matter production in the roots was variable and not significantly affected by N treatment. Broccoli root system growth was not affected by N application rates from 0-625 kg ha-1 (Bowen et al.
1999). The net root dry matter production varied from only 0.30 to 0.37 t ha-1. The root system as a percentage of total plant dry matter was 6.8% in the 0 N treatment and lower in the other treatments where N was well supplied (4.4 to 4.8%). At optimal/luxury N rates, about 5.1 to 7.5 kg N ha-1 was taken up in the root system representing about 1.4-2.6% of the plant’s total N uptake. Hence root systems operate effectively with relatively small amounts of N partitioned to their growth. In contrast to this finding, Abdul-baki et al. (1997) determined root systems in broccoli contain about 14% of the plant’s total N uptake. The brassica root tissue N concentration is in the range of 1.76-2.5% when N is adequate (Alt et al. 2000; Bowen et al. 1999). At low rates of N (0 and 112 kg N ha-1 ) the root system contained about 9.4% of the plant’s N but at the higher rate of 336 kg N ha-1
, the root contained a lower proportion of N at about 7% (Holness et al. 2008).
2.3.7. Better management of brassica nutrient inputs
Knowledge of whole crop N uptake and harvest indices is essential in developing nutrient budgets for brassica crops where N application is matched to whole crop requirement so as to minimise potential losses to the environment.
The extraction of N by brassica crops is high. In cauliflower crops not receiving N about 150-200 kg ha-1 N was taken up in a relatively low yielding crop (Everaarts et al. 1996). Under N application at 200 kg ha-1 crop, N uptake was 300 kg ha-1. At harvest (for broccoli) the soil mineral N in the 0-30 cm zone for a 0 N treatment was equivalent to only 4-9 kg ha-1 and in a high N treatment (196 kg ha-1 applied N) soil mineral N ranged from 14-68 kg ha-1 (Everaarts and de Willigen 1999). At the high N rate (196 kg ha-1) the loss of N (unaccounted for N) ranged from 8-52 kg ha-1 but the loss mechanisms were not related to leaching and it was suggested that immobilisation and N contained in roots accounted for this loss since losses of this magnitude are unlikely to be due to volatilisation (Everaarts and de Willigen 1999).
The efficiency of brassica crop N uptake is demonstrated by results that show crop N uptake often exceeds that of applied N (Bakker et al. 2009b). Bakker et al. (2009b) showed that more than 300 kg N ha-1 was accumulated at only 200 kg ha-1 N application and about 400 kg ha-1 accumulated at 400 kg ha-1 N application in broccoli cv Decatholon and Captain.
23 In Australia, the harvest index for various vegetable crops is: broccoli ≈20%, cabbage ≈65-70%, wombok (Chinese cabbage) ≈75%, cauliflower ≈40-50%, lettuce ≈ 75-85% and celery ≈ 60-65% (Harper unpublished). The significance of harvest index is that though the whole crop requirement for N in brassicas can be high (200-400 kg ha-1), a substantial amount of this N is returned to the system as crop residues. In broccoli essentially about 80-85% of the N in the crop is returned to the soil. This N becomes available for subsequent crops and hence, after rotations with crops of low harvest index, soil mineral N testing is useful for determining subsequent crop N requirements. This essentially forms the basis for Dutch recommendations for determining cauliflower nutrient requirements where the optimum application rate is recommended as 225 kg ha-1 N (presumably whole crop requirement) less the mineral N content in the 0-60 cm soil zone (Everaarts and DeMoel 1995). The figure for crop uptake can be modified for different crop species. In crops with a high harvest index such as cabbage, relatively smaller amounts of N are returned to the soil system and hence soil mineral N will be lower for subsequent crops.
The harvest index in broccoli increased with increasing N rate (Vagen et al. 2007) which the authors ascribed to the extra N having a greater effect on head yield than on the total plant yield. In contrast to this, Bakker et al. (2009b) found in two Broccoli cvs (Decathlon and Captain) that N use efficiency, on a marketable head basis, decreased substantially with increasing N because of the low proportion of the crop as a harvested product. Zebarth et al.
(1995) also found that whole crop fertiliser recovery in broccoli decreased with increasing rate of N application, but was variable across seasons from about 30% to about 70%.
The N harvest index is defined as the proportion of applied fertiliser N contained in the harvested product. Under adequate N, the N harvest index for cabbage ranges from 37-66% with an average of 56.9 (Erley et al. 2010), indicating that some 43.1% of applied fertiliser is lost from the system or returned to the system in the form of brassica crop residues. Consistent with this, Everaarts and Booij (2000) noted the N harvest index was 54-60% in cabbage. The N harvest index for broccoli is in the range of 27-30% (Everaarts and de Willigen 1999) which is somewhat higher than the harvest index defined by Everaarts (1994), whilst that of cauliflower is similar to that for cabbage at 46-52% (Everaarts et al. 1996).
Fertilised broccoli crops return in the order of 120-155 kg ha-1 of N as crop residues though in nil N treatments only 31-63 kg ha-1 is returned (Everaarts and de Willigen 1999). In cabbage experiments, about 58 kg N ha-1 (45-75 kg N ha-1) was returned in residues in a 0 N treatment and about 142 kg N ha-1 (125-168 kg N ha-1) was returned in treatments receiving about 300-350 kg ha-1 applied N (Everaarts and Booij 2000).
At 200 kg applied N ha-1 broccoli extracted essentially all available N from the soil (Bakker
et al. 2009b) and hence there was little risk of loss during the growing season. However, since soil and crop residues can be high in brassica production systems (96-330 kg ha-1) (Bakker et al. 2009b) mineralisation of N from these residues can represent a risk for loss during a fallow period.
24 cabbage production. Efficient irrigation management is critical in ensuring that N losses are reduced.
2.3.8. Genotypic differences in brassica N uptake
Reductions in N application rates to cabbage can be achieved by precise prediction of N demand, including the time course for crop growth and N uptake and the breeding of N efficient genotypes (Erley et al. 2010). Genotypic differences and genetics of N uptake have been assessed in various vegetable crops. For brassicas, some limited research has investigated genotypic differences in response to N levels. Rather et al. (1999) evaluated the efficiency of N utilisation and yield over a range of cauliflower cultivars (cvs Marine, Lindurian, and Linford). These cultivars were grown under N limiting conditions and adequate N. Irrespective of the N treatment cv. Marine grew best and was identified as having either a root system with higher N uptake capacity or had greater internal utilisation of N. Linford was classified as an N inefficient cultivar.
Erley et al. (2010) evaluated the effects of no added N and 300 kg N ha-1over 8 white cabbage cultivars. The cultivars grown at 300 kg N ha-1 tended to mature 5-7 days earlier than the same cultivars in the 0 applied N treatment. Head fresh weight varied considerably across seasons for the cultivars in the 0 applied N treatment (62.0 tonne ha-1 to 95.8 tonne ha-1) and in the 300 kg N ha-1 treatment (91.5 to 131 tonne ha-1). Nitrogen uptake varied across cultivars and in the 0 applied N treatment was 77 kg N ha-1 in the early cultivar, 131-178 kg N ha-1 in the midseason cultivar and 213-232 kg N ha-1 in the late season cultivar. In the 300 kg N ha-1 treatment, crop N uptake was 149 kg N ha-1 in the early cultivar, 199-323 kg N ha-1 in midseason cultivars and 368-395 kg N ha-1 in the late season cultivars. The specific N rates required to maximise yield are likely to vary across cultivars (Batal et al.
1997).
2.3.9. Brassica quality and N
The quality of brassica crops is affected by N application and manifested in a range of attributes including uptake of other minerals (Csizinszky 1996; Yoldas et al. 2008), hollow stem (Belec et al. 2001), amino acid profiles (Liu and Shelp 1993; Atanasova 2008), head rot in broccoli (Everaarts 1994) and head shape and quality (Bakker et al. 2009b)
Increasing N rate increased the uptake of K, Ca, Mg, Fe and Zn and the highest rate of removed nutrients was observed at 300 kg applied N ha-1 (Yoldas et al. 2008). Increasing the N rate (from 98 to 294 kg N ha-1) increased the uptake of other minerals (P, Zn and Fe) in cauliflower curd and Mn concentration in the leaf (Csizinszky 1996).
Hollow stem in broccoli cv Arcadia increased with increasing N application rate (0, 50, 100, and 150 kg N ha-1) (Belec et al. 2001). However, yield also increased with increasing N rate suggesting that rate of growth was a key factor in expression of hollow stem. Bakker et al.
(2009a) also found that hollow stem increased with increasing rate of N application.
25 ammonium concentration whilst other amino acids were largely unaffected.
Cabbage fertilised with ammonium nitrate at various rates increased total amino acids and essential amino acids from about 50 mg kg-1 DW in the nil applied N treatment to about 140 mg kg-1 DW in the 1000 kg N ha-1 treatment, and particularly aspartate, proline and alanine (Atanasova 2008).
Everaarts (1994) found that head rot in broccoli cv Emperor increased from between 2 to 6 times with increasing N to 196 kg N ha-1. The incidence was 39% in the nil applied N treatment, 72% in the 49 kg N ha-1 treatment and > 88% at an N rate greater than 98 kg ha-1. In contrast, Zebarth et al. (1995) found that soft rot infection in broccoli cv Emperor was not correlated with rate of N application. Bakker et al. (2009a) found that head rot was only weakly related to N rate and it is likely other factors influence the expression of the disorder.
26
Table 2.7 Data taken from the literature for broccoli including rate of N application, fresh and dry matter yields, dry matter content (DM%), N concentration
(N%), crop N uptake (kg ha-1), the reference, cultivars and plant parts studied. Blank sections indicate no available data.
Cultivar N rate (kg ha-1)
Plant part Fresh yield (tonne ha-1)
Dry matter yield (tonne ha-1)
DM% N% Crop N uptake
(kg ha-1)
Author & no. of expts. Milady F1 Marathon F1 0 120 240 Whole plant (at maturity) 1.58-5.17 3.65-6.76 4.52-7.48 1.2-2.5 2.2-3.9 3.0-5.0
(Vagen et al. 2004) (6)
Emperor 0 125 250 375 500 625 0 125 250 375 500 625 0 125 250 375 500 625 0 125 250 375 500 625 Leaf Inflorescence Whole plant Root 1.47-2.05 1.84-2.63 2.36-2.71 2.15-2.50 2.07-2.77 2.50-2.64 0.60-1.10 0.66-1.55 0.82-1.63 0.95-1.83 1.09-1.86 1.18-1.98 4.59-6.26 5.21-7.54 6.36-7.43 6.55-7.94 6.42-8.13 7.12-7.97 0.33-0.45 0.23-0.34 0.28-0.33 0.30-0.37 0.31-0.33 0.28-0.37 3.16-4.55 4.15-5.29 4.89-5.72 5.30-8.85 5.47-6.13 5.63-6.41 4.24-5.21 4.98-5.67 5.58-5.76 5.40-5.75 5.58-5.73 5.47-5.79 1.08-1.58 1.60-1.83 1.76-2.16 1.60-2.71 1.68-2.47 1.80-2.59 46.4-86.0 75.6-126.0 115-155 126-159 124-170 148-167 25.7-51.0 34.6-76.9 45.9-89.9 54.2-98.4 61.0-106 67.2-114 101-202 169-303 (203.5%) 262-354 (128.9%) 309-389 (91.1%) 323-419 (71.7%) 338-425 (60.3%) 4.6-7.0 3.8-6.2 5.4-7.0 5.4-8.0 5.5-7.0 7.0-8.4
27
Emperor 0 49 98 147 196 0 49 98 147 196 0 49 98 147 196 Inflorescence Leaf blade Stem 6.2 7.4 7.9 8.8 9.4 0.59 0.70 0.70 0.76 0.77 9.5 9.4 8.8 8.6 8.2 13.9 12.9 11.7 11.5 11.0 11.8 11.5 9.8 9.4 8.9 (Everaarts 1994)
JadeF1 0
150 200 250 0 150 200 250 Inflorescence Leaf 7.2 10.5 10.0 10.0 7.3 7.5 7.6 7.2 6.5 7.6 7.8 8.4 5.7 6.3 6.6 6.4 2.1 2.8 2.9 3.0
(Erdem et al. 2010)
Marathon 0 150 300 450 600
Main heads 10.6 14.3 13.9 13.3 12.1 3.06 3.62 4.09 5.08 4.82
83.1 (all Heads) 118.9 141.6 150.6 134.6
(Yoldas et al. 2008)
0 140 280
Head 4.05
7.80 8.65
28
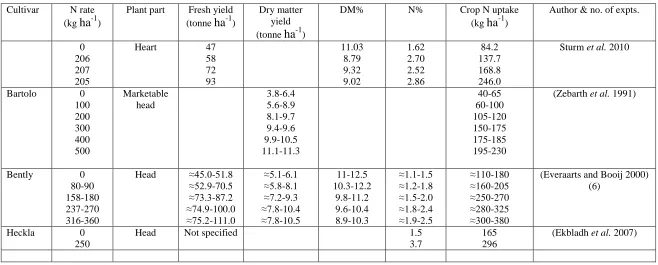
Table 2.8 Data taken from the literature for cabbage including rate of N application, fresh and dry matter yields, dry matter content (DM%), N concentration
(N%), crop N uptake (kg ha-1), the reference, cultivars and plant parts studied. Blank sections indicate no available data.
Cultivar N rate (kg ha-1)
Plant part Fresh yield (tonne ha-1)
Dry matter yield (tonne ha-1)
DM% N% Crop N uptake (kg ha-1)
Author & no. of expts.
0 206 207 205
Heart 47
58 72 93 11.03 8.79 9.32 9.02 1.62 2.70 2.52 2.86 84.2 137.7 168.8 246.0
Sturm et al. 2010
Bartolo 0 100 200 300 400 500 Marketable head 3.8-6.4 5.6-8.9 8.1-9.7 9.4-9.6 9.9-10.5 11.1-11.3 40-65 60-100 105-120 150-175 175-185 195-230
(Zebarth et al. 1991)
Bently 0 80-90 158-180 237-270 316-360
Head ≈45.0-51.8 ≈52.9-70.5 ≈73.3-87.2 ≈74.9-100.0 ≈75.2-111.0 ≈5.1-6.1 ≈5.8-8.1 ≈7.2-9.3 ≈7.8-10.4 ≈7.8-10.5 11-12.5 10.3-12.2 9.8-11.2 9.6-10.4 8.9-10.3 ≈1.1-1.5 ≈1.2-1.8 ≈1.5-2.0 ≈1.8-2.4 ≈1.9-2.5 ≈110-180 ≈160-205 ≈250-270 ≈280-325 ≈300-380
(Everaarts and Booij 2000) (6)
Heckla 0 250
Head Not specified 1.5
3.7
165 296
29
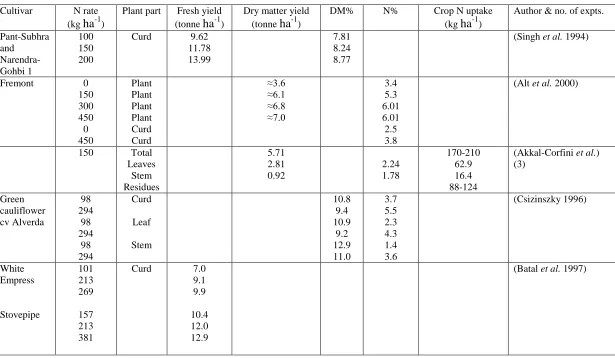
Table 2.9 Data taken from the literature for cauliflower including rate of N application, fresh and dry matter yields, dry matter content (DM%), N
concentration (N%), crop N uptake (kg ha-1), the reference, cultivars and plant parts studied. Blank sections indicate no available data.
Cultivar N rate (kg ha-1)
Plant part Fresh yield (tonne ha-1)
Dry matter yield (tonne ha-1)
DM% N% Crop N uptake (kg ha-1)
Author & no. of expts.
Pant-Subhra and Narendra-Gohbi 1 100 150 200
Curd 9.62 11.78 13.99
7.81 8.24 8.77
(Singh et al. 1994)
Fremont 0
150 300 450 0 450 Plant Plant Plant Plant Curd Curd ≈3.6 ≈6.1 ≈6.8 ≈7.0 3.4 5.3 6.01 6.01 2.5 3.8
(Alt et al. 2000)
150 Total Leaves Stem Residues 5.71 2.81 0.92 2.24 1.78 170-210 62.9 16.4 88-124
(Akkal-Corfini et al.) (3) Green cauliflower cv Alverda 98 294 98 294 98 294 Curd Leaf Stem 10.8 9.4 10.9 9.2 12.9 11.0 3.7 5.5 2.3 4.3 1.4 3.6 (Csizinszky 1996) White Empress Stovepipe 101 213 269 157 213 381
Curd 7.0 9.1 9.9
10.4 12.0 12.9
30
Marine Lindurian Linford
Marine Lindurian Linford
0 (mean soil
nitrate 70 kg ha-1) 250 (Added
fertiliser plus soil nitrate)
Whole plant
≈4.1-6.2 ≈4.2-6.0 ≈3.0-5.7
≈5.8-8.9 ≈4.5-9.1 ≈4.5-6.7
>2.4 >2.4 >2.4
3.2-4.2 3.2-4.2 3.2-4.2
2.4.
Capsicum
2.4.1. Capsicum growth and nitrogen requirements
Capsicum dry matter accumulation rates from a number of studies are similar, with approximately half the mass accumulated in leaves and stems and the remainder as fruit. Scholberg et al. (2009) found the roots accumulate 11% of the total dry matter; shoots and stems 42%; and fruit, 47%. Hegde (1987) found, not including roots, stems and leaves account for 45 to 50% of total plant dry matter, with 50 to 55% accumulated in fruit. Bowen and Frey (2002) concluded a slightly higher rate of 60% attributed to fruit.
Locascio et al. (1985) found capsicum grown under plastic mulch utilises less than 10 kg N ha-1 during the first 4-5 weeks after transplanting. This is confirmed by Hegde (1987) where dry matter accumulation is slow in the first 45 days after transplanting (DAT) of capsicum cv. California Wonder under field conditions. After this, growth increases linearly to 105 DAT, with the