http://www.sciencepublishinggroup.com/j/jim doi: 10.11648/j.jim.20190804.11
ISSN: 2328-7713 (Print); ISSN: 2328-7721 (Online)
Influence of Private Equity Penetration on Capital Market
Development in Sub-Sahara Countries
Mongwa Nkam Fonkam, Akume Daniel Akume, Molem Christopher Sama
Department of Banking and Finance, Faculty of Social and Management Sciences, University of Buea, Buea, Cameroon
Email address:
To cite this article:
Mongwa Nkam Fonkam, Akume Daniel Akume, Molem Christopher Sama. Influence of Private Equity Penetration on Capital Market Development in Sub-Sahara Countries. Journal of Investment and Management. Vol. 8, No. 4, 2019, pp. 67-75.
doi: 10.11648/j.jim.20190804.11
Received: October 14, 2019; Accepted: October 31, 2019; Published: November 6, 2019
Abstract:
Any country that recognises the importance of private equity investments may be forced to have a developed capital market as private equity investors use capital markets for Merger and Acquisition transactions and exit routes from portfolio companies after the holding period. Therefore, this paper seeks to assess the extent to which private equity penetration influences capital market development in Cameroon, Nigeria, Ghana, Kenya and South Africa. Secondary data was collected from private equity and venture capital data bases, World Bank development indicators, regional private equity venture capital associations and on country specific stock market websites. The Two-Stage Least Squares Instrumental Variables, Panel Corrected Standard Errors and Feasible Generalised Least Squares estimation techniques were used due to the potential problems of endogeneity and spherical errors of serial correlation, heteroskedasticity, cross sectional dependence and multicollinearity. The results show that the signs of the variables from the Panel Corrected Standard Errors and Feasible Generalised Least Squares estimation techniques are consistent with those of the Two-Stage Least Squares Instrumental Variables, though the magnitudes of the coefficients are different. In terms of the variables that are significant, the same set of variables (stock market liquidity, banking sector development and GDP per capita) is significant in all the specifications while foreign direct investment and private equity penetration (variable of interest) are insignificant in all the specifications. Based on the findings, we recommend the governments of these countries to set listing requirements based on businesses sizes, continue to improve macroeconomic environments and improve on the regulations on microcredit banks.Keywords:
Private Equity Penetration, Capital Market Development, SSA1. Introduction
In this modern era, there is no country that does not wish to have a developed capital market. However, capital market development is a multi-dimensional process of improvement in the quantity, quality and efficiency of stock market services. Developed capital markets are known to attract investors in to a country. Private equity (PE) and venture capital investors use capital market information to value their investments and as exit routes from their portfolio companies after the holding periods. By private equity will include venture capital since they are investments in unquoted companies in all stages in a company’s lifecycle [1]. Private equity penetration is the amount of deal flow to a particular country based on some attractive or attractive actors [2].
Capital markets in Sub-Saharan African (SSA) countries
are less developed compared to those in developed countries; making these countries not attractive to private equity investors. These have caused governments to seek to develop their capital markets and meet up with the standards in development countries. Therefore, governments that seek to attract more private equity investors also endeavour to have developed capital markets. Therefore, through the quest to increase private equity penetration, many governments may be forced to develop their capital markets.
2013, 2014, 2015, 2016 and 2017 respectively [3]. This shows that the number of exit routes through initial public offerings and capital markets compared to other exit channels by private equity firms such as trade buyers, PE and other financial buyers, management buyouts or private sales represent the lowest share of recorded exits. These figures show that their capital markets are not fully developed to meet the needs and aspirations of PE investors.
The five countries (Nigeria, Ghana, Kenya, Cameroon and South Africa) were selected because they are the best PE attractors in their respective sub-regions from 2013 to 2018; and with varying developments of capital markets. In terms of private equity deal flow or penetration to West Africa, there were 282 number of PE deals with Nigeria having 54% and Ghana with 22%. Out of the US $10.8 billion value of reported deals, Nigeria had 73% and Ghana 20%. In East Africa, out of the 194 reported PE deals, Kenya alone had 58%. Of the U.S $2.4 billion value of reported PE deals, Kenya equally had a lion share of 59%. In Southern Africa, there were 295 number of PE deals and South Africa alone had 66%. Out of the U.S $ 3.5 billion value of reported deals, South African equally grabbed 70% share [3]. In Cameroon, PE activity is timid and only one Merger and Acquisition deal had been completed through the Douala Stock Exchange [3].
In terms of capital market development, Cameroon has the younger capital market in Africa as it was launched in 2002 with just 3 listed companies, no exit on it by a private equity firm and a market capitalisation of U.S $5.1 million [4]. The Nairobi Securities Exchange comprises approximately 66 listed companies with a daily trading volume of approximately USD 10 million and a total market capitalisation of approximately USD 23 billion in 2018 [5]. There are currently 42 listed companies on the Ghana Stock Exchange and with a daily trading volume of U.S $1,7 billion and a total market capitalisation of U.S $21 million [6]. There are currently 169 listed companies on the Nigeria stock exchange with a total market capitalisation of U.S $31520 million [7]. Listed on the Johannesburg Stock Exchange are 374 companies with a market capitalisation of U.S $ 7,844 million [8].
Several studies have used private equity/venture capital as a dependent variables and stock market capitalisation which is a proxy for capital market development as an independent variable. Among these are studies of Kelly (2012), Cherif & Gazdar (2011), Félix et al. (2013), Bernoth, K., & Colavecchio (2014), Andrianaivo & Yartey (2010), Aduda et al. (2012) [9-14]. On the other hand, some studies on the determinants of capital market development in Africa are Acquah-Sam (2016), Azeez and Obalade (2018), Kipkorir and Tarus (2012), Ho (2017), Owiredu et al. (2016) and Zhou et al. (2015) [15-20]. Apart from being one of the first studies to use private equity to model capital market development in Africa, this study equally differs from others as private equity is used as an independent variable instead of a dependent variable.
Less development capital markets have few listed
companies, low market capitalisation, low liquidity, information asymmetry and market imperfections. This poses a problem to investors since the market cannot efficiently allocate capital to productive sectors. This has put governments under pressure in their quest to make their capital market more sophisticated and liquid. Recognising the importance of stock market on financial development and economic growth, international institutions such as a World Bank and African Development Bank have recommended stock market liberalisation programs to developing countries. Despite these recommendations, capital markets in these countries continue to suffer from underdevelopment problems and do not seem to meet the aspirations of investors.
This poses a problem as current policies have failed to provide concrete suggestions and solutions, therefore presenting significant policy gaps. As a result, capital markets are not being seen to portray what they actually seem to portray. The problem might be identifying and understanding the factors that hinder the development of capital markets so that tailored policies could be a solution. However, the impact of any factor varies from country to country as they have different sizes and characteristics. Based on the aforementioned problems, this paper seeks to fill the policy gaps by providing results that will contribute to the development of capital markets in these countries. Therefore, the objective of this paper is to assess the extent to which private equity penetration influences capital market development in Cameroon, Nigeria, Ghana, Kenya and South Africa.
2. Theoretical and Literature Review
The first theory is the Financial Intermediation Theory or the Financial Intermediary’s Theory, put forth by Schumpeter (1911) and later supported by Bencivenga and Smith (1991) [21, 22]. The conventional view of the theory states that the development of intermediaries tends to lead the development of the financial markets; the development of the financial sector leads to the development of the economy. Private equity and venture capital is a specialised form of financial intermediation. This is because private equity funds act as financial intermediaries that assemble funds from limited partnerships to invest in portfolio companies in some countries or regions based on some risk-return analysis of the macroeconomic and institutional environments. The second is the Calderon-Rossell Model which explains the behavioral structural theory of stock market development which considered economic growth and stock market liquidity as the main determinants of stock market development [23]. According to this theory, stock market development is a function of income level and stock market liquidity as the baseline.
the period 2000-2009 and found that banking sector development and stock market liquidity were important determinants of the Nairobi Stock Market [17]. In a similar study on Cameroon, Zhou et al. (2015) found stock market liquidity, financial openness represented by foreign direct investment flows and banking sector development were important while GDP per Capita had a negative and insignificant determinants of Douala stock exchange development [20]. In a related study on Ghana, Owiredu et al. (2016) found stock market liquidity and financial intermediary’s growth to have a statistical significance while GDP per capita proved not to have any significant impact [19]. In another study on Ghana, Acquah-Sam (2016) found that capital market development in Ghana was positive and insignificantly influenced by foreign direct investment [15].
In a similar study on South Africa, Ho (2017) found out that banking sector development was positive whereas trade openness had negative long-run impact on stock market development [18]. On Nigeria, Azeez and Obalade (2018) found out that in both the short run and long run, key macroeconomic determinants of stock market development are banking sector development, stock market liquidity and foreign direct investment [16]. In another study on the MENA countries, Cherif and Gazdar (2010) found that income level, saving rate, stock market liquidity, and interest rate influence capital market development [24]. Yet in a related study on 42 emerging countries, Yartey (2010) found gross domestic investments, income level, foreign direct investment, banking sector development and stock market liquidity were important determinants of stock market development [25]. In a similar study on 6 South Asian countries during the period 1980-2008, Nguyen and Hanh (2012) found banking sector development and stock market liquidity to have a positive impact on stock market development [26].
Furthermore, testing the validity of the Calderon-Rossell Model in Brazil, India, Indonesia, South Africa and Turkey from 2003-2013, Sezgin and Atakan (2015) found stock turnover, bank loans granted to private sector were positive and significant determinants of capital market development [27]. In a similar study on new EU countries, Olgić and Kusanović (2016) found that GDP per capita, stock market liquidity had a significant impact on capital market development [28]. In a similar study on Brazil, Nyasha (2018) found out that trade openness, banking sector development and exchange rate were important determinants of capital market development. Contrary to the results of some previous studies, stock market liquidity was found to have a negative and significant influence both in the long run and in the short run [29].
3. Methodology
3.1. Sources of Data
Secondary data from 2002 to 2017 was collected from CapitalIQ, Preqin, Burgis, Mergermarket, World Bank
indicators, each country’s capital market, unpublished and published scholarly works, government agencies and private equity and venture capital association monthly and annual reports (African Venture Capital Association (AVCA), East Africa Venture Capital Association (EAVCA) and South Africa Venture Capital Association (SAVCA)).
3.2. Model Specification
We used Two-Stage Least Squares, Instrumental Variables (2SLS, IV), Panel Corrected Standard Errors (PCSE) and Feasible Generalised Least Squares (FGLS) estimation techniques. The traditional panel data estimators–Fixed Effects (FE) model, Random Effects (RE) model and Ordinary Least Squares (OLS) are used by assuming consistency. These estimators are ineffective to deal with some problems of endogeneity and spherical errors (cross sectional dependence, serial correlation and heteroskedasticity) in panel data entries. The 2SLS, IV estimation technique was used because of potential endogenous regressors. The PCSE and the FGLS advanced estimation techniques were used because of spherical errors after testing [30, 31]. The PCSE estimator provides accurate standard error estimations with little loss in efficiency than the FGLS. Though the FGLS produces serious underestimated and inaccurate coefficient standard errors, it has an efficiency advantage over the PCSE when the number of time periods (T) is at least twice the number of cross-sectional units [32]. In this study, T (16) is trice the N (5).
The variables used in the models were market capitalisation (proxy for capital market development), private equity penetration, banking sector development, stock market liquidity, GDP per capita and foreign direct investments. We modified the Calderon-Rossell Theory by introducing private equity penetration (PEP) as one of the independent variables. Other variables used were according to the studies of Acquah-Sam (2016), Azeez and Obalade (2018), Kipkorir and Tarus (2012), Ho (2017), Owiredu et al. (2016) and Zhou et al. (2015) [15-20]. Mathematically, private equity as a function of market capitalisation is expressed as;
(
)
MCAP = f PEP + Xt (1)
Where Xt is a set of control variables ((banking sector development (BSD), stock market liquidity (SML), GDP per capital (GDPPC) and Foreign Direct Investments (FDI)). Including the control variables in equation 1, gives equation 2 below,
(
)
MCAP = f PEP BSD SML GDPPC FDI, , , , (2)
The variables will be expressed in natural logarithm (ln) in order to stablilise the variances in the series. The panel structure of the regression model is shown in equation 3 and 4 below.
0 1 2 3 4 5
lnMCAPit= β +βlnPEPit+βlnBSDit+ βlnSMLit+ βlnGDPPCit+βlnFDIit+ uit+εit (3) The regression model for the PCSE and FGLS is written as
0 1 2 3 4 5
lnMCAPit = β + βlnPEPit+ β lnBSDit+ β lnSMLit+ β lnGDPPCit+ β FDIit+ Uit (4) Where, β0 is a constant, β1, β2, β3, β4, and β5 are
coefficients of the independent variables, i is the individual country, t is the year, εis the errors term, MCAP is market capitalisation. PEP is Private Equity Penetration, BSD is Banking Sector Development, SML is Stock Market Liquidity, and GDPPC is Gross Domestic Product per capita, FDI is Foreign Direct Investments. We expect the coefficients of β1, β2, β1, β3, β4, and β5 to be greater than zero or positive Stock market capitalisation; is the market value of outstanding shares of listed home companies. It indicates the
size of capital markets and measures as a percentage of market value of outstanding shares to GDP. It is used as proxy of capital market development.
Private Equity Penetration (PEP): It is the level of private equity deals flow to a country as a proportion of its lagged GDP. Given the lag between economic development and possibility of investment, we take GDP of previous year. According to Cabejsek and Pedrettei (2013) private equity penetration can be measured using lagged GDP.
1
t
T o ta l P r iv a te e u ity c a p ita l in v e s te d in c o u n tr y i a t tim e t P E P
G D P−
= (5)
Banking Sector Development; is any process or procedure that improves the quality, quantity, efficiency and effectiveness of banking services. It is measure as the total monetary value of credit provided by domestic financial institutions to the private sector as a percentage of GDP.
Stock Market Liquidity; is a measure of transacted securities with respect to the size of the capital market. It can be proxied by using either the market value of traded securities as a percentage of GDP or stocks turnover ratios as a ratio of market capitalisation
Foreign Direct Investments; is the net inflows of investment to acquire a lasting management interest in an established enterprise operating in an economy other than that of the investor. It is measured by using private capital flows as percent of GDP.
GDP per capita; is a ratio of a country’s gross domestic product to its total population.
4. Empirical Results and Discussions
The analyses began with the Panel Instrumental Variable (IV) based on the fact that endogeneity may exist between stock market capitalisation and private equity penetration. Thus, a simple Fixed or Random Effect estimation would have produced biased results, if this is true. The estimation was conducted using the XTIVREG2 command in STATA 13. The XTIVREG2 implements IV/GMM estimation of the fixed-effects and first-differences panel data models with possible endogenous regressors. This command is robust in this situation because of heteroskedasticity and serial correlation within the panels.
4.1. Pre-estimation Test Results
In order to ensure that there is no violation of panel data study that could produce unbiased coefficient estimates pre-diagnostic tests such as, stationarity, multicollinearity, serial correlation, heteroskedasticity, cointergration, endogeneity,
and identification tests were conducted prior to our regression results. The results are presented below.
4.1.1. Stationarity Results of Panels
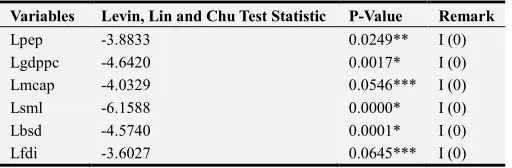
The results of the Levin-Lin-Chu test of unit root are presented in Table 1 below.
Table 1. Panel unit root results: Levin, Lin, and Chu test.
Variables Levin, Lin and Chu Test Statistic P-Value Remark
Lpep -3.8833 0.0249** I (0)
Lgdppc -4.6420 0.0017* I (0)
Lmcap -4.0329 0.0546*** I (0)
Lsml -6.1588 0.0000* I (0)
Lbsd -4.5740 0.0001* I (0)
Lfdi -3.6027 0.0645*** I (0)
Note: * significant at 1%, ** significant at 5%, ***significant at 10%.
Table 1 above show the results the Stationarity Test result for the variables in the models using the Levin, Lin and Chu test. The null hypothesis is that all panels have unit root and the alternative is that panels do not have unit root. From the Levin, Lin and Chu statistics and the P-values, it is evident that all the panels are stationary, though at different level of significance.
4.1.2. Correlation and Multicollinearity Results
This shows the direction and strength of the relationship between the variables used in this study.
Table 2. Correlation Matrix.
lmcap Lsml Lbsd Lfdi Lgdppc Lpep
Lmcap 1
Lsml 0.8563 1
Lbsd 0.8421 0.8489 1
Lfdi 0.4688 0.5283 0.6228 1
Lgdppc 0.8182 0.7647 0.893 0.5338 1
The correlation results on table 3 above show that, there exit a positive relationship between stock market capitalisation and private equity penetration. This implies that an increase in private equity penetration is associated with an increase in capital market development. Similarly, a decrease in private equity penetration will result to a decrease in capital market development. The correlation between stock market capitalisation and the other variables (stock market liquidity, banking sector development, foreign direct investments and GDP per capita) is positive. This indicates that and increase capital market development is associated with an increase in these variables and vice versa. It is observed that a positive relationship exist between the independent variables. The strength of the relationship between the independent variables can potential explain the presence of multicollinearity. As observed, there is a potential problem between stock market liquidity and banking sector development and between banking sector development and GDP per capita, with correlation values greater than 0.8. In order to further investigate the presence of multicollinearity, the VIF test results are presented in Table 4 below.
Table 3. Variance Inflation Factor.
Variable VIF 1/VIF
Lbsd 10.51 0.095174
Lgdppc 5.19 0.192762
Lsml 3.83 0.261152
Lpep 2.64 0.378172
Lfdi 1.97 0.378172
Mean VIF 4.83.
From the results in table 3 above, it is observed that the highest VIF occurs for banking sector development with a coefficient of 10.51, followed by GDP per capita with a coefficient of 5.19. On average the VIF coefficient is 4.83, which indicates that multicollinearity is not an issue in the model specified for capital market development. Various recommendations for acceptable levels of VIF have been published in the literature. Perhaps most commonly, a value of 10 has been recommended as the maximum level of VIF [33].
4.1.3. Results for Autocorrelation
The autocorrelation test result for the stock market capitalisation and private equity penetration results is presented on Table 4 below.
Table 4. Autocorrelation Test Results.
Dependent Variable Wooldridge Wald
F-Statistics P-Value F-Statistics P-Value
Stock market Capitalisation 0.119 0.7477 560.76 0.000
From table 5 above, the P-value of the Wooldridge test is insignificant, meaning that there is no autocorrelation of order one. However, the P-value of the Wald test is significant at 1 percent significance level, indicating the presence of AR (1). Therefore, it is difficult to conclude with certainty, the presence of AR (1) in the model since the Wooldridge and Wald results are not consistent with each
other. Consequently, the estimation has been performed taken into consideration this inconsistency.
4.1.4. Results of Cross-sectional Independence
The test results using the fixed effect and random effect analyses is presented table 5 below.
Table 5. Results of cross sectional independence.
RE FE
Test statistics P-Value Test statistics P-Value
Pesaran 8.273 0.0000 8.618 0.0000
Friedman 53.771 0.0000 53.488 0.0000
Average absolute value of the off-diagonal elements 0.654 0.681
The test results for the Pesaran and Friedman using the fixed effect and random effect analyses for the stock market capitalisation are presented table 6 above. The Pesaran and Friedman test, strongly reject the null hypothesis of no cross-sectional dependence. The average absolute correlation of the residuals is 0.654 and 0.681 for the random effect and fixed effect, respectively, which is a very high value. Hence, there is enough evidence suggesting the presence of cross-sectional dependence under both the fixed effect and random effect specifications.
4.1.5. Heteroskedasticity Test
The results using Breusch-Pagan test of heteroskedasticity is presented in table 6 below.
Table 6. Breusch-Pagan test of heteroskedasticity.
Stock market capitalisation F-statistics = 5.44 Prob. F (6, 69) 0.0001
The results of the Breusch-Pagan test of heteroskedasticity as presented in table 7 above show that the p-value is significant at 1 percent significance. Hence, we fail to accept the null hypothesis that their error terms are homoskedastic and accept the alternative hypothesis that it is heteroskedastic; confirming the existence of heteroskedasticity.
4.1.6. Results of Model Identification
Table 7. Anderson Canon Correlation LM statistic and Sargan-Hansen Identification Test Results.
Stock market capitalisation or Equation 3
Test Statistics P-Value
Anderson canon. corr. LM statistic 18.786 0.0003
Sargan statistic 0.207 0.9016
The p-value of the Anderson canon correlation LM statistic is less than the 5 percent significance level thus we reject the null hypothesis that the models are underidentified and conclude that the models are not underidentified. Similarly, the P-value of the Sargan Statistic is insignificant at 5 percent significance level. Therefore, we cannot reject the null hypothesis that the over-identifying restrictions are not valid
but conclude that they restrictions are valid. This means that the model is not unidentified and the instruments used in the estimation are valid.
4.1.7. Results of Endogeneity Test
The results of endogeneity in table 8 are based on the Sargan-Hansen.
Table 8. Results of Sargan-Hansen endogeneity Test.
Stock market capitalisation Sargan statistic=0.547 Chi-sq (1) P-val = 0.4596
The null hypothesis of this test is that stock market capitalisation is endogenous and the alternative is that private equity penetration is exogenous as the P-value is insignificant, we accept the alternative that private equity penetration is exogenous and conclude that there is no endogeneity issue in this study.
4.2. Regression Results
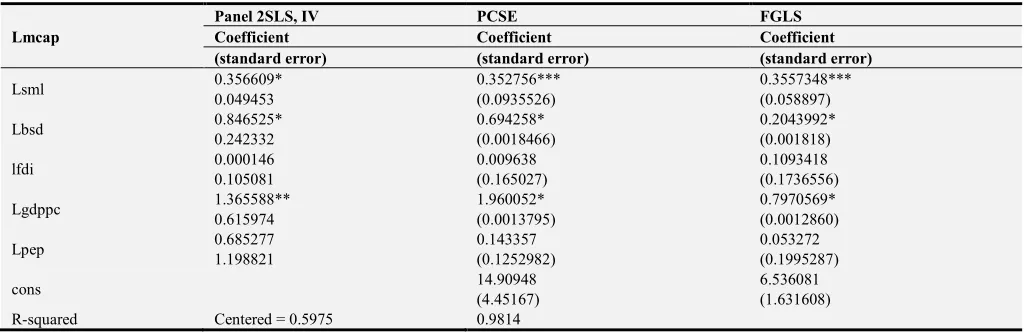
Table 9 below shows the regression results using the using the panel Two Stage Least Squares Instrumental Variable
(2SLS IV), Panel Corrected Standard Errors (PCSE) and Feasible Generalised Least Squares (FGLS) estimation techniques. Columns 1, 2 3 show the regression results of the Two Stage Least Squares Instrumental Variable (2SLS IV), Panel Corrected Standard Errors (PCSE) and Feasible Generalised Least Squares (FGLS) estimation techniques respectively. The results taking in to consideration the presence of autocorrelation of order one, that is, AR (1), are estimated using both the PCSE and the FGLS estimation techniques.
Table 9. Panel 2SLS IV, PCSE and FGLS Estimation Results.
Lmcap
Panel 2SLS, IV PCSE FGLS
Coefficient Coefficient Coefficient
(standard error) (standard error) (standard error)
Lsml 0.356609* 0.352756*** 0.3557348***
0.049453 (0.0935526) (0.058897)
Lbsd 0.846525* 0.694258* 0.2043992*
0.242332 (0.0018466) (0.001818)
lfdi 0.000146 0.009638 0.1093418
0.105081 (0.165027) (0.1736556)
Lgdppc 1.365588** 1.960052* 0.7970569*
0.615974 (0.0013795) (0.0012860)
Lpep 0.685277 0.143357 0.053272
1.198821 (0.1252982) (0.1995287)
cons 14.90948 6.536081
(4.45167) (1.631608)
R-squared Centered = 0.5975 0.9814
F (5, 70) = 21.37. Number of obs = 80.
1% level of significance, **5% level of significance, *** 10% level of significance.
The results show that the coefficient of private equity penetration is positive using the three estimators. This means an increase in private equity penetration will lead to an increase in stock market capitalisaton. In quantitative terms using the 2SLS IV, a 1 percent increase private equity penetration will lead to a 0.68527 percent increase in capital market development. This positive effect is however statistically insignificant at all levels of significance. This finding is according to the a priori expectation. The result using the PCSE and FGLS indicate that a 1 percent increase
However, capital markets provide private equity investors with valuation data and exit routes from their portfolio companies after the holding periods; and should have the ability to influence capital market development. The results of other included variables are presented in the paragraphs that follow.
The coefficient of stock market liquidity is positive using the three estimation techniques. This means that an increase in stock market liquidity will lead to an increase in capital market development. Specifical to the 2SLS IV, a 1 percent increase in stock market liquidity will lead to a 0.3566 percent increase in capital market development. This effect is statistically significant at the 1 percent level of significance. Using the PCSE and FGLS estimators, a 1percent increase in stock market liquidity will lead to a 0.3527 percent increase in capital market development from the PCSE model and 0.3557 percent for the FGLS model. This effect is statistically significant at 10 percent level of significance. These results are consistent with a priori expectations, supported by the financial intermediation theory, Calderon-Rossell Model and the empirical findings of Kipkorir and Tarus (2012), Zhou et al. (2015), Owiredu et al. (2016), Azeez and Obalade (2018), Cherif and Gazdar (2010), Yartey (2010), Nguyen and Hanh (2012), Sezgin and Atakan (2015) and Olgić and Kusanović (2016).[10, 13, 16-17, 19-20, 26-28] This indicates that stock market liquidity is an important variable that influences capital market development in the selected countries. From our results, we can posit that with liquid stock markets, investors can change their portfolios at high speed and at a low cost in these countries. However, this finding is inconsistent with the findings of Nyasha (2018) who found a negative insignificant effect of stock market liquidity on capital market development in Brazil [29].
The coefficient of banking sector development is also positive for all the three specifications. This means that an improvement in banking sector development will lead to an increase in capital market development. Specific to the 2SLS estimator, a 1 percent increase in banking sector development will lead to a 0.846525 percent increase in capital market development. This result is statistically significant at the 1 percent level of significance. Specific to the PCSE and FGLS estimators, a 1 percent increase in banking sector development will lead to a 0.694258 percent increase in capital market development from the PCSE model and 0.2043992 percent for the FGLS model. This result is statistically significant at 10 percent level of significance for PCSE and 5 percent for FGLS. This indicates that banking sector development is an important variable that determines capital market development in the selected countries. This finding is consistent with the theoretical expectation, theory of financial intermediation and the empirical findings of Owiredu et al. (2016), Ho (2017), Kipkorir and Tarus (2012), Zhou et al. (2015), Azeez and Obalade (2018), Yartey (2010), Nguyen and Hanh (2012), Sezgin and Atakan (2015), Nyasha (2018) [16-20, 13, 26, 27, 29]. This results is inconsistent with the findings of Zhou et al. (2015) [20], who found
banking sector development to have an insignificant negative effect on capital market development in Cameroon. From our finding, we can posit that banking credit for productive purposes increases productivity, savings and capital market activities.
From the three estimation techniques, GDP per capita has a positive effect on capital market development as the coefficient is positive. This means an increase in GDP per capita will lead to an increase in capital market development. In quantitative terms using the 2SLS IV estimator, a 1 percent increase in GDP per capita will lead to a 1.36558 percent increase in capital market development. This result is statistically significant at the 5 percent level of significance. Using the PCSE and FGLS estimators, in quantitative terms, a 1 percent increase in GDP per capita will lead to a 1.960052 percent increase in capital market development for the PCSE model and a 0.7970569 percent for the FGLS model. This result is statistically significant at the 1 percent level of significance for both models, indicating that GDP per capita to a large extent is an important variable that determines capital market development in the selected countries. This result is consistent with the Calderon-Rossell Theory and empirical findings of Owiredu et al. (2016) and Olgić and Kusanović (2016) [19, 28]. Our finding contracts that of Owiredu et al. (2016) and Zhou et al. (2015) who found GDP per capita to have an insignificant negative impact on the development of the Ghana and Cameroon stock markets respectively [19-20]. Our finding indicates that GDP per capita is an important variable that determines capital market development in the selected countries. From this finding, we can argue that when an individual’s real national income increases his purchasing power and demand for capital market services increases.
direct investment to be a significant driver of capital market development. From our finding, foreign direct investment is not an important determinant for capital market development in the selected African countries [20, 18, 16, 13, 29]. We attribute this finding to the difficult and unattractive business environments to foreign investors to these countries.
From Table 9 above, our PEP model is well fitted as shown by F-test. The coefficient of determination R-square of the PCSE and FGLS model shows that about 98 percent of variations in capital market development is explained by stock market liquidity, banking sector development, private equity penetration, foreign direct investments and GDP per capita from 2002 to 2017. Only 2 percent of the variables were not included in the study. This is an indication that the capital market development model has a good fit.
5. Conclusions
From the findings, it can be concluded that the extent to which private equity penetration (variable of interest) influences capital market development in the selected countries is small. Therefore, private equity penetration should not be considered as a key driver of capital market development in the selected countries. The significant extent to which stock market liquidity, banking sector development and GDP per capita are instrumental in improving capital market development in these countries means that they should equally be considered as key variables when discussing capital market development determinants. The extent, to which foreign direct investments influence capital market development in the selected countries is insignificant, thus should not be considered important when discussing the drivers of capital market development in the selected countries.
6. Recommendations
Based on the findings and in order to improve stock market liquidity, we recommend the governments of these countries to set listing requirements based on businesses sizes. This is in order to give every business the opportunity to participate in stock market activities. A rigorous education and marketing campaign on the advantages of listing should follow including the diaspora. On the improvement of GDP per capital, we recommend these governments to that they have favourable macroeconomic environments that will increase productivity. On banking sector development, we suggest that these governments should formulate policies that will increase the development of micro-credit institutions as they carter for the needs of a majority of their populations that commercial banks. This will increase credit accessibility to the rural folk. In addition, interest rates should be reasonable enough in order to make bank credit attractive.
References
[1] British Venture Capital Association (2012). Report on Investment Activity. Retrieved from https://www.bvca.co.uk/.../Industry%20activity%20reportsAut umn.pdf.
[2] Cabejsek, O. & Pedretti, M. (2013). Underdevelopment in the BRIC countries-Opportunities or Obstacle for Private Equity? Unpublished Masters Thesis, Stockholm School of Business, University of Stockholm.
[3] Africa Private Equity and Venture Capital Association (March, 2019). Annual Private Equity Data Tracker. Retrieved from https://www.avca-africa.org/research-publications/data-reports/2018-annual-african-private-equity-data-tracker. [4] Douala Stock Exchange (2018). Towards intergration of
CEMAC common capital market. Retrieved from Www.dsx.org/report_2018.
[5] Nairobi Securities Exchange (2018). Market snapshot. Retrieved from https://www.nse.co.ke/market-statistics/market-snapshot.html.
[6] Ghana Stock Exchange (August, 2018). Market Report. Retrieved from https://gse.com.gh/market-reports.
[7] Nigeria Stock Exchange (2018). Listed Securities Listed
Companies. Retrieved from
https://www.nse.com.ng›issuers›listed-securities›listed-companies.
[8] Johannesburg Stock Exchange (2018). Market Statistics. Retrieved from https://www.jse.co.za/services/market-data/market-statistics.
[9] Kelly, R. (2012). Drivers of private equity investment activity: are buyout and venture investors really so different? Venture Capital, 14 (4), 309-330.
[10] Cherif, M., & Gazdar, K. (2011). What drives venture capital investments in Europe? New results from a panel data analysis. Journal of Applied Business and Economics, 12 (3), 122-139. [11] Félix, E. G. S., Pires, C. P., & Gulamhussen, M. A. (2013).
The determinants of venture capital in Europe—Evidence across countries. Journal of Financial Services Research, 44 (3), 259-279.
[12] Bernoth, K., & Colavecchio, R. (2014). The macroeconomic determinants of private equity investment: a European comparison. Applied Economics, 46 (11), 1170-1183.
[13] Andrianaivo, M., & Yartey, C. A. (2010). Understanding the growth of African financial markets. African Development Review, 22 (3), 394-418.
[14] Aduda, J., Masila, J. M., & Onsongo, E. N. (2012). The determinants of stock market development: The case for the Nairobi Stock Exchange. International Journal of Humanities and Social Science, 2 (9), 214-230.
[15] Acquah-Sam, E. (2016). Determinants of capital market development in Ghana. European Scientific Journal, ESJ, 12 (1), 251.
[17] Kipkorir, K. J., & Tarus, D. K. (2012). Macroeconomic determinants of stock market development in emerging markets: evidence from Kenya. Journal of Banking and Finance 234 (67), 232-245.
[18] Ho, S. Y. (2017). The macroeconomic determinants of stock market development: Evidence from South Africa. Journal of Banking and Finance 123 (45), 65-76.
[19] Owiredu, A., Oppong, M., & Asomaning, S. A. (2016). Macroeconomic determinants of stock market development in Ghana. International Finance and Banking, 3 (2), 33-48. [20] Zhou, J., Zhao, H., Belinga, T., & Gahe, Z. S. Y. (2015).
Macroeconomic determinants of stock market development in Cameroon. International Journal of Scientific and Research Publications, 5 (1), 1-11.
[21] Schumpeter, J. A. (1911). The theory of economic development. Reprinted 1969. New York: Oxford University Press.
[22] Bencivenga, V. R., & Smith, B. D. (1991). Financial intermediation and endogenous growth. The review of economic studies, 58 (2), 195-209.
[23] Calderon-Rossell, R. J. (1991, June). The determinants of stock market growth. In Pacific Basin Capital Markets Research Proceeding of the Second Annual Pacific Basin Finance Conference. Vol. 2, 4-6.
[24] Cherif, M., & Gazdar, K. (2010). Macroeconomic and institutional determinants of stock market development in MENA region: new results from a panel data analysis. International Journal of Banking and Finance, 7 (1), 139-159.
[25] Yartey, C. A. (2010). The institutional and macroeconomic determinants of stock market development in emerging economies. Applied Financial Economics, 20 (21), 1615-1625. [26] Nguyen, P. D., & Hanh, V. T. H. (2012). Determinants of stock market development in Southeast Asian countries. Journal of Economics and Development, 44 (1), 101-112.
[27] Sezgin, F., & Atakan, T. (2015). The role of the Calderon-Rossell Model on determining the developments of equity capital markets: A study of fragile five countries. İstanbul Üniversitesi İşletme Fakültesi Dergisi, 44 (1), 2-11.
[28] Olgić Draženović, B., & Kusanović, T. (2016). Determinants of capital market in the new member EU countries. Economic research-Ekonomska istraživanja, 29 (1), 758-769.
[29] Nyasha, S. (2018). Determinants of the Brazilian stock market development. The Journal of Developing Areas, 54 (1), 23-25. [30] Beck, N., & Katz, J. N. (1995). What to do (and not to do)
with time-series cross-section data. American political science review, 89 (3), 634-647.
[31] Parks, R. W. (1967). Efficient estimation of a system of regression equations when disturbances are both serially and contemporaneously correlated. Journal of the American Statistical Association, 62 (318), 500-509.
[32] Reed, W. R., & Ye, H. (2011). Which panel data estimator should I use? Applied economics, 43 (8), 985-1000.