Farm-to-school programs’ local foods
activity in Southern Arizona: Local foods
toolkit applications and lessons
Dari Duval,
a* Ashley K. Bickel,
band George B. Frisvold
cUniversity of Arizona Cooperative Extension
Submitted April 3, 2018 / Revised June 25 and July 19, 2018 / Accepted July 24, 2018 / Published online December 15, 2018
Citation: Duval, D., Bickel, A. K., & Frisvold, G. B. (2019). Farm-to-school programs’ local foods activity in Southern Arizona: Local foods toolkit applications and lessons. Journal of Agriculture, Food Systems, and Community Development, 8(Suppl. 3), 53–72. https://doi.org/10.5304/jafscd.2019.08C.001
Copyright © 2019 by the Authors. Published by the Lyson Center for Civic Agriculture and Food Systems. Open access under CC BY license.
Abstract
This analysis applies principles and methods from the U.S. Department of Agriculture (USDA) Local Foods Toolkit to demonstrate the moderating influence of countervailing effects on the economic impacts of local food purchases through farm-to-school programs in Southern Arizona using USDA Farm to School Census data. The analysis applies and expands upon recommendations in the Toolkit, introducing the concept of export
substitution and exploring how water resource constraints create tradeoffs for farms through crop-shifting and cropping rotations. The analysis reveals that for fruit and vegetable exporting regions, export substitution can be a major countervailing effect. Furthermore, the analysis examines the usefulness of the Farm to School Census as a secondary data source for estimating the economic impacts of local food activities, allowing us to make recommendations for how the Census could be expanded and supplemented for regional economic applications.
Keywords
Farm to School, Local Foods, Economic Impact Analysis, IMPLAN, Farm to School Census, Local Foods Toolkit, Import Substitution, Export Substitution, Procurement
a * Corresponding author: Dari Duval, Economic Impact Analyst, Department of Agricultural & Resource Economics,
University of Arizona Cooperative Extension; 308 McClelland Park; 650 N. Park Ave., P.O. Box 210078; Tucson, AZ 85721-0078 USA; duval@email.arizona.edu
b Ashley K. Bickel, Economic Impact Analyst, Department of Agricultural & Resource Economics, University of Arizona Cooperative Extension; ashley.bickel@arizona.edu
c George B. Frisvold, Professor and Extension Specialist, Department of Agricultural & Resource Economics, University of Arizona Cooperative Extension;
frisvold@ag.arizona.edu
Funding Disclosure
This research was funded in part by the University of Arizona, Eller School of Management, Economics and Business Research Center, Making Action Possible (MAP) Dashboard.
Special JAFSCD Issue
Economics of Local Food Systems: Utilization of USDA AMS Toolkit Principles
Introduction
The Agricultural Marketing Service of the U.S. Department of Agriculture (USDA, AMS) sup-ported the development and publication of an economic impact assessment “Toolkit” (Thilmany McFadden et al., 2016) to assist researchers and community groups in evaluating the economic outcomes of local food initiatives. The Toolkit provides a review of key economic concepts, guidance on conducting analyses, and empirical examples from previous studies. The Toolkit is organized into seven modules that cover engage-ment with community partners and project plan-ning, the use of secondary data, and the collection and use of primary data, as well as both basic and more sophisticated applications of economic input-output models relying on IMPLAN modeling software and data.
Aims and Scope
This study applies AMS Toolkit methods to assess the potential economic impacts of farm-to-school1
(FTS) procurement of local foods in four Southern Arizona counties (Cochise, Pima, Santa Cruz, and Yuma) using USDA Farm to School Census data. It highlights and expands on issues considered in two Toolkit modules: (2) using secondary data and (6) addressing opportunity costs (specifically, accounting for supply-side resource constraints and demand-side countervailing effects).
Impact estimates of FTS local food procure-ment depend crucially on how one defines a counterfactual––what would have happened had the purchase of locally produced food not occurred. Our analysis applies and expands on Toolkit methods in two novel ways to develop counter-factual scenarios. First, we explicitly examine the implications of water resource constraints (often an important consideration in arid Western states). The Toolkit discusses in depth the implications of land constraints as well as applications for
1 Farm to school programs are a three-pronged strategy working in kindergarten through twelfth grade (K-12) schools to (1) provide nutrition education, (2) develop school garden programs, and (3) encourage procurement of local foods by school foodservice departments (National Farm to School Network, n.d.). This third strategy, procurement, is the focus of our analysis.
2 The FTS Census was first administered by the USDA for the 2011–12 school year (with results published in in 2013). The second FTS Census was conducted for 2013–14 (with results published in 2015) to provide data for assessment of program growth and outcomes. A third FTS Census based on the 2017–18 school year is planned for release in 2019.
measuring land requirements for the production of local foods (e.g. Swenson, 2010; 2013); however, the Toolkit only mentions water constraints in passing. Second, we consider the effect of local food pro-curement causing export substitution rather than import substitution. The Toolkit identifies import substitution––replacing commodities imported from outside the region with commodities produced within the region––as “a key justification for local foods initiatives as it is a strategy that has the poten-tial to both retain dollars within a region, and create a multiplier effect from new production” (p. 111). Yet such import substitution may not occur if the region is a major net exporter of certain food prod-ucts. In this case, local procurement substitutes local consumption for consumption outside of the region (export substitution). This study is the first, to our knowledge, to explicitly account for export substitution effects in local food procurement.
The Toolkit also provides recommendations for the use of secondary and primary data. Accord-ing to the Local Foods Toolkit, national-level data is usually not well suited to local analyses. Accuracy can be a concern and the data may not provide information that appropriately addresses the ques-tion at hand. Fortunately, for analyses focusing on local food in schools, the USDA conducts the Farm to School (FTS) Census, a nationwide survey that collects information from school food authori-ties (SFAs) regarding current and anticipated school participation in farm-to-schoolactivities, procurement practices, products commonly pur-chased locally, and barriers to participation in farm-to-school activities, among other data (USDA, n.d.; USDA, 2015).2 The FTS Census is one of the most
foods by school foodservice departments (Christen-sen, Jablonski, Stephens, & Joshi, 2017; Bauman & Thilmany McFadden, 2017; Becot et al., 2017; Gunter 2011; Haynes, 2009; Kane, Kruse, Ratcliffe, Sobell, & Tessman, 2010; Kluson, 2012; Pesch, 2014; Roche, Becot, Kolodinsky, & Conner, 2016; Tuck, Haynes, King, & Pesch, 2010), few to our knowledge have made use of data available through the Farm to School Census. Moreover, the FTS Census is not mentioned as a secondary data source in the 2017 updated version of the Toolkit, even though the 2015 FTS Census (collecting data from the 2013–14 school year) was a large, national survey with 12,585 schools and school districts responding out of a national list frame of 18,104 schools and school districts (a 70% response rate).
Although the FTS Census is among the most comprehensive, accessible, low-cost, and consist-ently reported data sources on local food procure-ment by schools, it requires suppleprocure-mentation and cross-verification with other state and federal data to be used to carry out economic assessments. Our study examines the usefulness of the FTS Census as a secondary data source for estimating the eco-nomic impacts of local food activities, allowing us to make recommendations for how the FTS Census could be expanded and supplemented by other data to reliably assess the economic impact of a school’s procurement decision.
This article is structured as follows. The first section describes the main Toolkit concepts
explored in this analysis. Second, we characterize the Southern Arizona study area along with data avail-able on the region through the FTS Census. We then develop multiple counterfactual scenarios that measure how gross impacts of local procurement are limited by supply-side resource constraints, demand-side countervailing effects, and export substitution effects, followed by a comparison of results. Finally, we conclude by discussing various implications and recommendations for practitioners making use of FTS Census data for local food eco-nomic impact assessments, as well as key considera-tions in general for local food efforts in regions strong in the production of specialty crops.
Applying AMS Toolkit Concepts
The economic impacts of local procurement occur
primarily through “import substitution”––the act of replacing commodities imported from outside the region with commodities produced within the region (Thilmany McFadden et al., 2016). This means that a greater share of consumers’ spending stays within the local economy. There are, how-ever, a variety of factors that complicate and mod-erate this effect. The AMS Toolkit emphasizes two major considerations in assessing the economic impacts of local food procurement: the “no oppor-tunity cost of spending” and “no resource con-straints” assumptions (Thilmany McFadden et al., 2016).
The “no opportunity cost of spending” assumption applies to the local buyers of food products. When a consumer chooses to purchase locally sourced food over food imported from outside the region, there are actors in the local economy that lose out, such as wholesalers and retailers (depending upon the channel through which the consumer purchases that food). Assessing the net effects of that local purchase requires con-sidering the negative impacts that may occur when a consumer’s spending pattern shifts. In the case of FTS programs, schools are not necessarily purchas-ing more food overall as a result of participatpurchas-ing in farm-to-school activities. Rather, they may be shifting some of their food budget toward locally procured items versus items imported from outside the region. Any shift in the marketing channel must be considered, whether that be buying directly from producers, buying from an intermediary such as a food hub (an aggregator of local food products for marketing), or buying through a traditional food service distributor. Low and Vogel (2011) find that intermediated marketing channels for local foods represented between 50% and 66% of the value of local food sales in 2008 at the national level. For the West Coast (i.e., California, Oregon, and Washington), that figure rises to 85%. When these shifts are considered, the regional economic impacts of FTS are moderated through “countervailing effects”––that is, reduced economic activity in the local wholesale and retail sectors (Becot et al., 2017).
channeled through intermediaries, information can be lost between the agricultural producer and the final consumer. Because intermediated marketing channels for local foods represent a significant proportion of the value of local food sales, the role of collecting data from intermediaries is an impor-tant one to consider. While the FTS Census pro-vides information on the purchasing practices of SFAs, it does not provide information on the responses of local producers or intermediaries to the opportunity to sell to schools. Thus, additional information would be needed to supplement the Farm to School Census in order to reliably assess the economic impact of a school’s procurement decision.
The second moderating effect is borne out of the “no resource constraints” assumption. The assump-tion of “no resource constraints” is that land, water, and other natural resources are in abundance, and agricultural production will increase to fulfill increased local demand for locally produced foods. While the Toolkit mentions water constraints, it devotes far more attention to land constraints; it states, “While there may be other supply side resource con-straints, such as access to water, properly offsetting land demands is usually the most important factor to consider” (p. 87). However, it does caution, “In an era of unpredictable water availability, maximizing local production in certain parts of the country may not be realistic or optimal” (p. 90). The role of water constraints is especially pertinent in Arizona and other parts of the arid West. Several studies have measured the extent and effects of water quantity constraints in Western production systems (Fleck, 2013; Kanazawa, 1993; Moore & Dinar, 1995; Weinberg, 1997). Water constraints are particularly relevant in Southern Arizona, where many parts of the region are part of Active Management Areas (AMAs) or Irrigation Non-Expansion Areas (INAs) through the Groundwater Management Act. In such areas, the expansion of irrigated agriculture is not permitted (Jacobs & Holway, 2004). Water use in the Yuma, Arizona, area is strictly monitored and limited to meet the United States’ treaty commitments for delivery of Colorado River water to Mexico (Frisvold, Sanchez, Gollehon, Megdal, & Brown, 2018). Therefore, major increases in the production of food at the local level would
likely be achieved through reduced local production of other crops. While shifting from lower-value crops, such as cotton or alfalfa, to higher-value vegetable crops could generate some net positive effects to the economy, one must still account for the lost production of lower-valued crops.
In addition to these two countervailing effects, export substitution would have a different effect on local economies than would import substitution. If a region is a major producer and net exporter of specific commodities, it is already likely to procure that product locally, regardless of local food efforts. While technically this still counts as a local food, it only affects from whom local agricultural producers receive revenues, not the total revenues they earn, inputs they purchase, or workers they hire.
Countervailing effects can occur anywhere along the value chain, from the farm to the inter-mediary, to the final consumer. Independently, actions of one food-chain actor can produce a positive effect, while at the same time the actions of another can produce a negligible or negative effect. Figure 1 demonstrates the different actions food-chain actors can take in response to the demand for local foods. It also demonstrates the anticipated economic impact of those independent actions. Further, it illustrates various data gaps and the data needed to supplement the Farm to School Census in order to reliably assess the economic impact of a school’s procurement decision. As seen in Figure 1, an increase in school food spending alone would be expected to generate a positive economic impact (+) to the region, as would the expansion of a food wholesale business or an increase in agricultural production. Shifting busi-ness from one product or customer to another is not anticipated to generate any economic impact (no impact) in isolation, unless another food-chain actor, at the same time, acts in a way that generates a positive or negative impact. Export substitution is an example of this effect. Shifting crop produc-tion alone produces countervailing effects (+/–), with an increase in sales of one crop and a decrease in sales of another. Depending on the crops shifted, this could have positive, negative, or even negligible effects in isolation.
from increases in local food purchases by farm-to-school programs, drawing from the potentially countervailing effects pictured in Figure 1.
As illustrated in Equation 1, the choices of any one actor along the food supply chain could counteract seemingly positive impacts due to the choices of another. Furthermore, multiplier effects of changes in the food supply (whether positive or negative) can also contribute to the net economic
3 One consideration not examined in this analysis is any potential price premium paid by institutional buyers for local foods. Existing literature (Burnett, Kuethe, & Price, 2011; Low et al., 2015; Low, et al., 2011; Valpiani, Wilde, Rogers, & Stewart, 2016) find evidence of higher consumer willingness to pay for local foods; however, little information exists on willingness to pay at an institutional level for wholesale quantities of local produce. This analysis does not consider price premiums for produce marketed as “local” purchased by institutional buyers and assumes that schools work to maximize the purchasing power of their foodservice budgets.
impacts of a change in demand. For that reason, we propose that analyses need to incorporate information on the responses of food-chain actors to changes in the demand3 for local foods. This
analysis explores potential scenarios in which the action of one food-chain actor could influence the regional economic outcomes of farm-to-school procurement.
Equation 1. Net Change in Local Economic Activity Due to Farm-to-School Local Foods Purchases
𝑁𝑒𝑡 ∆ 𝐿𝑜𝑐𝑎𝑙 𝑆𝑎𝑙𝑒𝑠 = [∆ 𝐴𝑔 𝑃𝑟𝑜𝑑𝑢𝑐𝑡𝑖𝑜𝑛] + [∆ 𝑊ℎ𝑜𝑙𝑒𝑠𝑎𝑙𝑒] + [𝑀𝑢𝑙𝑡𝑖𝑝𝑙𝑖𝑒𝑟 𝐸𝑓𝑓𝑒𝑐𝑡𝑠]
= [∆ 𝐿𝑜𝑐𝑎𝑙 𝐹𝑜𝑜𝑑 𝐶𝑟𝑜𝑝 𝑃𝑟𝑜𝑑𝑢𝑐𝑡𝑖𝑜𝑛 + ∆ 𝐶𝑟𝑜𝑝𝑠 𝑆ℎ𝑖𝑓𝑡𝑒𝑑 𝑂𝑢𝑡 𝑜𝑓 𝑃𝑟𝑜𝑑𝑢𝑐𝑡𝑖𝑜𝑛 + ∆ 𝑅𝑜𝑡𝑎𝑡𝑖𝑜𝑛𝑎𝑙 𝐶𝑟𝑜𝑝𝑠]
+ [∆ 𝐼𝑛𝑡𝑒𝑟𝑚𝑒𝑑𝑖𝑎𝑟𝑦 𝑆𝑎𝑙𝑒𝑠 + ∆ 𝑇𝑟𝑎𝑑𝑖𝑡𝑖𝑜𝑛𝑎𝑙 𝑊ℎ𝑜𝑙𝑒𝑠𝑎𝑙𝑒 𝑆𝑎𝑙𝑒𝑠] + [ 𝑀𝑢𝑙𝑡𝑖𝑝𝑙𝑖𝑒𝑟 𝐸𝑓𝑓𝑒𝑐𝑡𝑠]
Southern Arizona Study Area and Farm-to-School Data
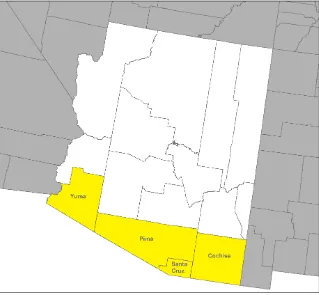
Our analysis focuses on schools and school districts in four Southern Arizona
counties (Cochise, Pima, Santa Cruz, and Yuma) (Figure 2).
Arizona is a leading pro-ducer of many agricultural commodities, ranking as the second-largest producing state for lettuce, spinach, broccoli, and cauliflower in 2014 (Bickel, Duval, & Frisvold, 2017). Not surprisingly, these are some of the most com-mon purchases of local food by schools in Arizona. Yuma County is one of the largest producers of leafy green vegetables in the nation; in fact, “during the winter months, from the first week of December 2014 to the first
week of March 2015, 82% of the nation’s lettuce was shipped from Arizona, primarily Yuma County” (Kerna, Duval, & Frisvold, 2017). Arizona produces around a quarter of the national
production of cantaloupe and honeydew melons. It is also a leading producer of other commodities, such as durum wheat and pecans. Whereas in most parts of the country fruit and vegetable production is not feasible during certain times of the year when school is in session, Arizona’s production of fruits and vegetables peaks in winter months. Thus, opportunities exist for the in-state procurement of fruits, vegetables, and other foods.
Across the four most recent years in which the Census of Agriculture has taken place (1997, 2002, 2007, 2012), harvested cropland in Southern Ari-zona has been relatively stable, fluctuating between about 260,000 and 290,000 acres (105,218 and 117,359 hectares). Yuma County accounts for about two-thirds or more of this harvested acreage; Cochise County accounts for a fifth to a fourth; Pima County accounts for about a tenth; and Santa Cruz County accounts for less than one hundredth
(USDA, 1999; 2004; 2009; 2014). Particularly in Yuma County, there has been a long-term trend of producers moving from lower-value crops such as alfalfa and cotton and adopting vegetable-small grain rotations, which have higher returns per acre-foot of water (Frisvold, 2015). While this rotation may not be suitable to all parts of Southern Ari-zona, it does illustrate the possibility that crop-shifting toward the production of vegetable and grain crops for local consumption potentially could produce positive regional economic impacts. This analysis considers crop-shifting among the scenar-ios modeled for assessing the economic impacts of local foods.
Of the 467 school districts in Arizona, 57% completed the 2015 Farm to School Census. For the four Arizona counties selected for this analysis (Figure 1), there were 44 respondents to the FTS Census, not all of which reported farm-to-school activities. Institutions responding to the FTS Cen-sus accounted for 61% of students in the region as a whole, with coverage ranging from a low of 38% for Santa Cruz County to a high of 87% for Yuma
County (Table 1). Of the 44 Southern Arizona SFAs that responded to the 2015 Farm to School Census, 11 reported conducting farm-to-school activities, and 10 had useable census responses.
One important consideration for farm-to-school programs is what constitutes “local” food. While there is no official definition, most Southern Arizona SFAs (seven out of 10) considered food produced within Arizona to be local (Table 2). Two SFAs considered food produced within the same city or county to be local, and one considered food produced within a 200-mile (322-km) radius to be local. Nationally, 24.6% of Farm to School Census respondents consider food produced within the same state to be local, followed by 20.4% that consider food produced within the same city or county to be local. More than 16% of respondents considered food produced within a 50-mile (80-km) radius as local, another 16% considered from within a 100-mile (161-km) radius as local, and the remaining 23% of respondents considered all other geographic definitions of local. Again, this contrasts with the two most common
4 All currency is in US$.
U.S. consumer definitions of local: originating from within a 50-mile radius (over 70%) when measured in terms of distance, and originating from within the same county when meas-ured by political
boundaries (over 40%) (Onozaka, Nurse, & Thilmany McFadden, 2010). Thilmany McFadden et al. (2016) include project scoping with-in the first module of the Local Foods Toolkit, which includes defining the geographic bounds of the study region. Since not all farm-to-school efforts are coordinated at a regional or state level, but rather occur at a school or school district level, definitions of local may vary even within the same region. As can be seen in Table 2, since seven out of 10 SFAs consider local to be in-state, a regional analysis may count some purchases from outside the region as local. For the two respondents who consider local to be from within the same city or county, such an analysis may undercount local food activity.
Total food expenditures by the 10 Southern Arizona SFAs that reported participating in farm-to-school activities totaled $3,653,300,4 with
responses ranging from $12,000 to $1.3 million, and with an average of $365,330 (Table 3). Expenditures on local foods, including fluid milk, ranged from $0 to $550,000 (0% to 100% of total costs), averaging $113,050 (27% of total costs). Excluding fluid milk, local food expenditures ranged from $0 to $450,000 (0% to 54% of total costs), and averaged $70,550 (10% of total costs). Respondents who reported spending $0 on local
Table 1. Southern Arizona Farm to School (FTS) Census Respondents by County
County Respondents Universe % of Students in County Covered by FTS Census
Pima 17 96 55%
Cochise 14 29 64%
Santa Cruz 4 11 38%
Yuma 9 15 87%
TOTAL 44 151 61%
Sources: 2015 Farm to School Census (USDA, 2016a); National Center for Education Statistics (NCES), 2014.
Table 2. Southern Arizona School Food Authorities’ (SFAs’) Geographic Definition of “Local”
Definition of Local Respondents
Produced within the state 7
Same city or county 2
Produced within a 200-mile radius 1 Other possible survey responses (produced within a 100-mile radius,
within 50 miles, within a day’s drive, within the region, other) 0
foods indicated that their schools engaged in farm-to-school activities through nutrition education or school gardens, but did not procure local foods as part of their programs.
Fluid milk is commonly sourced locally be-cause it is highly perishable (Goldenberg, Meter, & Thompson, 2017). In assessing local food activity, sales of fluid milk were most likely a pre-existing local food purchase and must be accounted for in estimating the net effects of programs to promote the new use of local foods. In Arizona, it is typical for milk to come from large dairies in Pinal and Maricopa counties that border the study area to the north; this area produced 91% of Arizona’s fluid milk in 2012 (USDA, 2014). By most definitions, this would be considered locally procured (A. Schimke, personal communication). Of the eight SFAs reporting local food purchases greater than $0, milk purchased locally ranged from 0% of local food purchases to 100% of local food purchases. Considering the local nature of milk supplies, it is unclear that this activity can be attributed to local food efforts. It is also likely that many SFAs that did not report local food activity make what could be considered as local purchases of milk, but do not track whether they are purchasing from in-state vendors.
Local food purchases occur in one of two
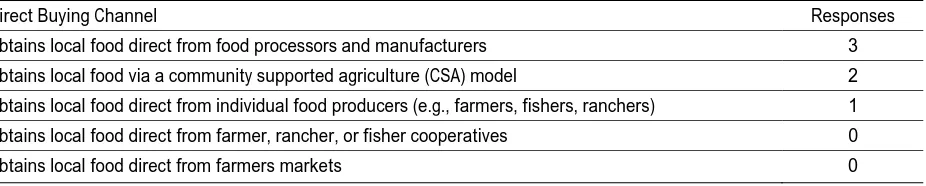
ways. Purchases are made either directly from the producer or the manufacturer, or they are made through an intermediary buying channel such as a distributor, food hub, or program that aggregates local produce. Four out of ten Southern Arizona SFAs reporting farm-to-school activity used direct-buying channels, with some respondents using more than one (Table 4). The most common direct-buying channel was direct purchases from producers and manufacturers, with three SFAs. Two SFAs made purchases through a community supported agriculture (CSA) model.
Southern Arizona SFAs who report purchasing local foods for farm-to-school activities most com-monly do so through intermediaries rather than directly from producers. Some schools purchase from intermediaries as well as directly from produc-ers. Nine out of ten SFAs who indicated engaging in farm-to-school activities reported purchasing local foods through intermediary channels, with some respondents using more than one channel. The most commonly used type of intermediary is a food distrib-utor, with six respondent SFAs, followed by federal school food and nutrition programs such as USDA foods (five respondents), and the Department of Defense Fresh Produce Program (four respond-ents) (Table 5).
An important driver of farm-to-school
Table 3. Total Food Expenditures and Local Food Expenditures Reported by Southern Arizona School Food Authorities (SFAs) (all currency in US$)
Category Average Minimum Maximum
Total food expenditures $365,330 $12,000 $1,300,000 Food expenditure (local foods), including milk $113,050 $0 $550,000 Percent of food cost that was local, including fluid milk 26.6% 0% 100% Food expenditure (local foods), not including milk $70,550 $0 $450,000 Percent of food cost that was local, not including fluid milk 9.9% 0% 53.6%
Table 4. Southern Arizona School Food Authorities’ (SFAs’) Local Food Direct-Buying Practices
Direct Buying Channel Responses
procurement is the USDA Food and Nutrition Service Department of Defense Fresh Produce Program. This program funds the procurement of fresh produce for schools, with local procurement options identified as Arizona-grown. The DoD Fresh Produce Program provides up to 20% of entitlement funds to schools for the procurement of fresh produce, including local foods that are iden-tified in their catalogue as such. According to the Arizona Department of Education, in the 2013 school year, statewide DoD program participants spent 11% of their program funding, or $501,000,
on items designated as locally grown. Total DoD program spending for the four Southern Arizona counties for the 2013– 2014 school year was roughly $903,000, of which $82,000 (9%) was local pro-curement. While only spending on fluid milk is reported separately from other local food purchases in Farm to School Census data, data on local food spending by commodity is available from the DoD Fresh Produce Program. Top fresh pro-duce items purchased statewide in the 2013 school year were lettuce (41%), celery (39%), broccoli (15%), cauliflower (5%), and vegetable soup mix (5%) (Arizona Department of Education & Arizona Grown, 2014).
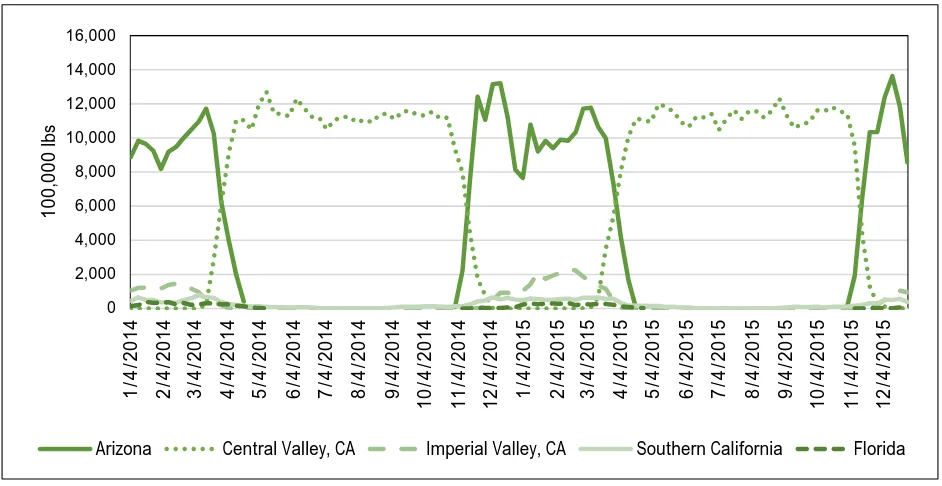
For Arizona, local sources of lettuce are virtually the only source of lettuce during winter months. Arizona supplies over 80% of the nation’s lettuce between December and March, and that figure can reach as high as over 90% in individual weeks (Kerna et al., 2017). Throughout the course of the year, U.S. lettuce production shifts almost exclusively between Arizona and California’s Central Valley (Figure 3).
Table 5. Southern Arizona School Food Authorities’ (SFAs’) Local Food Intermediary Buying Practices
Intermediary Buying Channel: Obtains local food from… Responses
…distributors 6
…USDA foods 5
…DoD Fresh Produce Program vendors 4 …food buying cooperative 1
…food hub 0
…foodservice management companies 0 …State Farm to School program office 0 …other intermediary source 0
Figure 3. Weekly Lettuce Movements by Production Region, 2014–2015
Note: 1 lb.= 0.45 kg
Source: Kerna, Duval, & Frisvold (2017). 0
2,000 4,000 6,000 8,000 10,000 12,000 14,000 16,000
1/4/2014 2/4/2014 3/4/2014 4/4/2014 5/4/2014 6/4/2014 7/4/2014 8/4/2014 9/4/2014 10/4/2014 11/4/2014 12/4/2014 1/4/2015 2/4/2015 3/4/2015 4/4/2015 5/4/2015 6/4/2015 7/4/2015 8/4/2015 9/4/2015 10/4/2015 11/4/2015 12/4/2015
100,000 lbs
This brings to light an important point for regions that are highly specialized net exporters (out of the local region) of specific commodities. The lack of non-local options and the limited feasibility of local production of certain crops should be considered in assessing the net impacts of local foods initiatives. Figure 4 overlays Ari-zona’s lettuce shipments for the 2014-2015 grow-ing season with the academic year for Tucson Unified School District. While there are times of the academic year when lettuce would be sourced from California, at least half of the school year falls during the time when Arizona is producing the bulk of the country’s lettuce supply.
This raises two challenges for evaluating the economic impacts of farm-to-school procurement. For winter months, the procurement of lettuce would not represent import substitution––replac-ing imported lettuce with local production. Rather, it could represent export substitution––consuming lettuce locally rather than shipping it to consumers outside the region. Unlike import substitution, export substitution would not necessarily bring any additional sales revenue to the local economy. A
critical empirical question then is, does the local procurement of lettuce through farm-to-school activities increase on-farm production or on-farm marketing? In other words, in the absence of farm-to-school activities, would FTS-procured lettuce not have been produced, or would it have other-wise been exported out of the local area? Only in the former case would this have a positive produc-tion expansion effect on the local economy, where-as changing where the goods are marketed simply represents export substitution.
Another challenge is that, for local lettuce pro-curement to have an import substitution effect, Arizona’s season would need to be lengthened. This would force Arizona to compete with Cali-fornia’s Central Valley at a time when Arizona’s lettuce production faces less favorable weather and greater water requirements. Similar issues would also apply to broccoli and cauliflower, where win-ter production far exceeds per capita state con-sumption in the winter months. Lettuce, broccoli, and cauliflower are major expenditure items in Arizona farm-to-school procurement (Arizona Department of Education, 2013); thus
export-Figure 4. Arizona Weekly Lettuce Shipments and Academic Year
Note: 1 lb.= 0.45 kg
Sources: USDA AMS Specialty Crop Shipment Data & Tucson Unified School District academic calendar. 0
2,000 4,000 6,000 8,000 10,000 12,000 14,000
10,000 lbs
substitution effects need to be considered in economic impact analyses.
Methods
Given the data gaps inherent in the Farm to School Census, this analysis considers a series of scenarios that demonstrate countervailing effects that may be experienced in Southern Arizona. This analysis also considers the influence of certain assumptions about food-chain actor responses to changes in the demand for local food products.
This analysis draws on scenarios developed using data from the FTS Census presented in the previous sections, the 2013 NASS Annual Statistics Bulletin for Arizona (USDA NASS, 2013), and recommendations presented by Thilmany McFad-den et al. (2016) in the Local Foods Toolkit. The economic impacts of net changes in local spending within the four-county Southern Arizona region are modeled using IMPLAN 3.1 (IMPLAN, 2014), an input-output model commonly used to estimate regional economic impacts. Agricultural production is modeled in IMPLAN using analysis-by-parts and customized industry spending patterns developed using data from the 2012 Census of Agriculture to capture agricultural production practices specific to the state of Arizona.5
Economic impacts consist of three compo-nents: direct effects, indirect multiplier effects, and induced multiplier effects (Miller & Blair, 2009). Direct effects measure the initial direct change in the economy in question––e.g., a net increase in spending on local food, whether that be through an increase in consumption or an increase in spending as a result of a higher willingness to pay for local foods. Indirect multiplier effects measure business-to-business transactions, such as when agricultural producers purchase inputs to production within the local economy, generating additional rounds of spending in the local economy. Those supplier businesses also require inputs to production, and so on. Any purchase sourced from outside the region is referred to as a “leakage” and represents the money escaping from the local economy. With each round of purchases, money leaks from the economy, and subsequent rounds of transactions
5 In Arizona, nearly all agriculture is irrigated, whereas nationwide there is a greater variety in production practices.
dissipate in their magnitude. Industries have dif-ferent buyer-supplier relationships within the local economy and, therefore, have different indirect multiplier effects. Induced multiplier effects repre-sent the effects of individuals employed in the affected industries spending their earnings on household purchases such as rent, mortgage, groceries, or entertainment. As industries employ more people or pay higher wages, they have higher induced multiplier effects. Economic impacts via indirect and induced multiplier effects might occur when a school switches some of its purchases from conventional to local produce purchased through a food hub or directly from a producer. This shifts local economic activity away from wholesale and toward agricultural production and/or local intermediaries.
While the FTS Census provides information on the purchasing practices of SFAs, it does not provide information on their purchasing practices prior to engaging in farm-to-school activities. Nei-ther does it provide information on the responses of local producers or intermediaries to the oppor-tunity to sell to schools. This analysis, as a result, will look at the different scenarios in which farm-to-school programs could have non-zero economic impacts on the regional economy. An increase in local agricultural production of produce could occur in two ways: (1) through an increase in the scale of production, or (2) through crop-shifting from lower-value crops to higher-value crops. Additionally, we introduce further assumptions that account for export substitution. These factors will first be modeled separately, then in conjunc-tion, and then compared with the baseline scenario of an increase in agricultural production of produce without accounting for constraints or counter-vailing effects.
• Case 1: A simple increase in local agricul-tural production of produce (no
constraints)
to import substitution)
• Case 3: An increase in local agricultural pro-duction of produce through crop-shifting from lower-value crops (accounting for resource constraints)
o 3a: Shifting some production from alfalfa to a vegetable-wheat rotation o 3b: Shifting some production from
cotton to a vegetable-wheat rotation • Case 4: An increase in local agricultural
production of produce other than lettuce, broccoli, and cauliflower (accounting for export substitution)
• Case 5: All effects combined (opportunity cost, resource constraints, and export substitution)
o 5a: Crop-shifting alfalfa to a vegetable-wheat rotation
o 5b: Crop-shifting cotton to a vegetable-wheat rotation
A simple increase in local agricultural produc-tion of produce is modeled as the full value of average farm-to-school produce sales ($70,550) going to vegetable and melon production. Fruits and vegetables are the most commonly procured local food items in Southern Arizona, according to the Farm to School Census. To account for the opportunity costs of spending at wholesale, we modeled a decrease in wholesale activity using IMPLAN’s wholesale sector, margining the gross value of sales. We modeled crop-shifting as a decrease in the acreage of alfalfa or cotton produc-tion and a corresponding increase in (excluding lettuce, broccoli, and cauliflower) vegetable acre-age. We calculated the magnitude of the shift using the amount of land and applied water necessary to produce $70,550 in vegetables (USDA, 2014; USDA, NASS, 2014b). Given the relatively high value per-unit of water generated through vege-table production, additional water is freed up through this crop-shifting. Therefore, we assume that the remainder of the water is used to cultivate wheat in rotation with vegetables, a common
6 “The North American Industry Classification System (NAICS) is the standard used by Federal statistical agencies in classifying business establishments for the purpose of collecting, analyzing, and publishing statistical data related to the U.S. business economy” (U.S. Census Bureau, n.d., para. 1).
practice among vegetable producers in Arizona. This implies that additional sales are generated beyond the sales of vegetables, thus moderating the countervailing effect.
To account for export substitution, we use the share of Arizona schools’ Department of Defense (DoD) program spending (39%) in 2013 on fruits and vegetables excluding lettuce, cauliflower, and broccoli, which account for 61% of program spending. These crops are commonly produced in Arizona and would likely be purchased locally even in the absence of local food promotion efforts; therefore, their share of spending is excluded to calculate the impacts net of export substitution. Changes in agricultural production are modeled using analysis-by-parts and a customized industry spending pattern developed using data on agricul-tural input costs by NAICS code6 from the 2012
Census of Agriculture data for Arizona. Within IMPLAN, the model’s geographic scope is set to include Pima, Cochise, Yuma, and Santa Cruz counties, aggregated. Economic impacts are reported in terms of sales for simplicity’s sake and to accord with sales as the unit of measure for transactions between schools, producers, and intermediaries. For the purposes of this analysis, we will assume that schools and school districts are operating in such a way as to maximize the pur-chasing power of their foodservice budgets, and therefore it is assumed that local foods are not sold to school districts at a price premium.
Scenario Results
On average, farm-to-school programs in Southern Arizona reported spending $70,550 in FY2014 on local food procurement, not including milk. Milk is excluded from local spending as it is typically sourced locally. Most milk is produced in Maricopa and Pinal counties in Arizona, but outside of the Southern Arizona study area for this analysis.
Case 1: A simple increase in local agricultural
production of produce (no constraints)
produce generating sales of $70,550 to schools. It assumes no resource constraints and no opportu-nity cost of spending. This would result in a total estimated economic impact of $149,400 in sales on the regional economy. This includes multiplier effects generated by the increased demand for agricultural inputs and labor (Table 6). Producing an additional $70,550 worth of vegetables would require 34 acre-feet (41,938 m3) of water and 11.5
acres (4.7 ha) of land.
Case 2: An increase in local agricultural production
of produce while accounting for the opportunity cost
of spending at wholesale (accounting for import
substitution)
In the case that an increase in local agricultural production occurred to meet school demand for local produce, it is fair to assume that such a pur-chase would occur at the expense of the school purchasing non-local produce through a whole-saler. This is referred to as the “opportunity cost” of spending. Accounting for this corresponding decrease in sales at wholesale, the net direct sales effect of the local food purchase would be $58,980. Including multiplier effects, the total impact would be $129,990 in sales. Again, the additional produc-tion would require 34 acre-feet of water and 11.5 acres of additional land for cultivation.
Case 3: An increase in local agricultural production
of produce through crop-shifting from lower-value
crops (accounting for resource constraints)
Cases 3a and 3b examine the countervailing effects of natural resource constraints: water and, second-arily, land. We assume that in order for agricultural producers to grow vegetables, they must forego growing other crops because of water and land constraints. Southern Arizona growers frequently grow vegetable crops in rotation with wheat (Fris-vold, 2015; Frisvold et al., 2018). Over the past 30 years, vegetable-wheat rotations have supplanted crops with a longer growing season such as alfalfa and cotton. In addition, growers apply less water per acre to vegetable crops (3.1 acre-feet per acre or 3,824 m3) and wheat (3.4 acre-feet per acre or
4,934 m3), than to alfalfa (5.4 acre-feet per acre or
6,661 m3) or cotton (4.5 acre-feet per acre or 5,551
m3) (USDA, NASS, 2014b).
Were alfalfa to be fallowed in order to grow $70,550 of vegetables in a vegetable-wheat rota-tion, 38.4 acre-feet (47,366 m3) of water would be
freed up by fallowing 11.5 acres (4.7 ha) of alfalfa. With that remaining water, 8.4 acres (3.4 ha) of wheat could be cultivated, resulting in some fallowed land during the wheat rotation. There would be a loss of $17,287 in alfalfa revenue; however, $8,230 in wheat revenue would also be
Table 6. Summary of Sales Impacts by Case Scenario (all in US$)
Case School Spending on Local Foods Countervailing Effect(s) Net Direct Sales Impact
Total Sales Impact Including Multiplier Effects
Case 1
No Constraints or Opportunity Costs $70,550 N/A $70,550 $149,400
Case 2
Opportunity Cost of Spending $70,550 ($12,170) $58,980 $129,990
Case 3a
Resource Constraints: Fallowing Alfalfa $70,550 ($9,060) $61,500 $130,840
Case 3b
Resource Constraints: Fallowing Cotton $70,550 ($12,400) $58,100 $127,060
Case 4
Export Substitution $70,550 ($43,040) $27,520 $58,270
Case 5a
Export Substitution, Resource Constraints: Fallowing
Alfalfa, and Opportunity Cost of Spending $70,550 ($51,320) $19,240 $43,460
Case 5b
Export Substitution, Resource Constraints: Fallowing Cotton, and Opportunity Cost of Spending
generated. This would result in a net countervailing effect of -$9,060, and, overall, a net direct impact of $61,500. That would generate an economic impact of $130,840 in sales, including multiplier effects. Though not examined in this analysis, large-scale crop-shifting from alfalfa to fruit and vegetable specialty crops could have an impact on regional dairy industries that rely on the nearby production of feed crops such as alfalfa. A decrease in alfalfa supply could be expected to lead to an increase in feed prices, which in turn could be passed on to consu-mers in the form of higher prices for dairy products.
Were cotton to be shifted to a vegetable-wheat rotation, the net countervailing effect would be -$12,400, for a net direct impact of $58,100 and a total economic impact of $127,060. The 18 acre-feet of water (22,203 m3) freed up by switching
11.5 acres from cotton to vegetables could be used to grow 5.3 acres (2.1 ha) of wheat. Again, this would result in some land being fallowed during the wheat rotation. Therefore, the fact that vege-table crops require less water per acre than alfalfa or cotton means that the crop mix effect is more muted than if one made a simple acreage-switching assumption, as has been made often in previous studies.
Case 4: An increase in local agricultural production
of produce other than lettuce, broccoli, and cauliflower
(accounting for export substitution)
According to statewide data on DoD program spending on local foods in Arizona, 61% of DoD funds used for local foods are used to purchase Arizona-grown lettuce, cauliflower, and broccoli. As illustrated above, Arizona is almost the exclu-sive producer of lettuce in winter months when school is in session and is a major producer of broccoli and cauliflower as well. As local lettuce, broccoli, and cauliflower would be purchased from in-state for much of the year when they are in season, this scenario considers only the share of DoD program spending that goes toward other vegetable and melon crops. Considering only the 39% of crops that would represent import substitution (versus export substitution), spending of $70,550 on local produce would have a net direct impact of $27,520 in sales, and a total economic impact of $58,270.
However, one must note that, in the case of Southern Arizona, export substitution has a larger effect on net impacts compared to import substitution.
Case 5: All effects combined (opportunity cost,
resource constraints, and export substitution)
Finally, in Cases 5a and 5b, we consider all con-straints and tradeoffs combined. Spending $70,550 on local produce, not including lettuce, broccoli, and cauliflower, while accounting for a correspond-ing decrease in wholesale purchases, would have a net direct sales impact of $19,240 if that produc-tion were enabled by fallowing alfalfa. The total sales impact, including multiplier effects, would be $43,460. Were the production to occur by fallow-ing cotton, the direct sales impact would be $17,930, and the total sales impact would be $42,020.
Discussion and Conclusions
This analysis applies various principles and methods from the USDA Local Foods Toolkit to demonstrate the moderating influence of counter-vailing effects on the economic impacts of local food purchases through FTS programs in Southern Arizona. Beyond those recommendations pre-sented in the Toolkit, it introduces the concept of export substitution and explores how water resource constraints create tradeoffs for farms through crop-shifting and cropping rotations. This analysis reveals that for fruit and vegetable export-ing regions, export substitution can be a major countervailing effect. In fact, it can be larger than other countervailing effects typically considered. This result suggests that gathering information from producers on how FTS procurement (or other local food activities) affects their production and marketing decisions is crucial for an accurate assessment of economic impacts. Is procurement expanding production (i.e., causing local produc-tion that would not otherwise occur)? And if so, does the expansion of local food production result in a shift of crops produced? Or, does procure-ment reflect local production that would have occurred anyway, but shipped out of the region? For those localities pursuing local food initiatives in an effort to promote economic development–– in particular those regions specializing in the pro-duction of fruit and vegetable specialty crops–– these are critical considerations, the effects of which cannot be assessed without information on how producers and intermediaries respond to increases in the demand for local foods. For fresh fruit and vegetable purchases, the countervailing effects of export substitution may well occur in regions that the USDA Economic Research Service identifies as the “Fruitful Rim” (USDA, ERS, 2000). Other examples of this include the produc-tion of apples in Washington or potatoes in Idaho.
This analysis included a small number of interviews to inform assumptions about supplier responses; however, they are insufficient to draw any conclusions about countervailing effects at the regional level. A more systematic collection of this information would help to understand the regional implications of the responses of food-chain actors to changes in the demand for local foods. For
agricultural producers, this could be achieved through an additional question on the USDA Local Foods Marketing Practices Survey (USDA, 2016b). Furthermore, gathering data on the quantity of spending on the top commodities purchased by schools would be helpful to isolate spending on those commodities for which export substitution effects should be considered. While the Farm to School Census asks SFA respondents to rank their top five items procured, more detailed spending data would be of further use. Finally, a question could be added to address the issue of whether institutions such as schools have a higher willing-ness to pay for locally marketed produce than for produce coming from outside the local area.
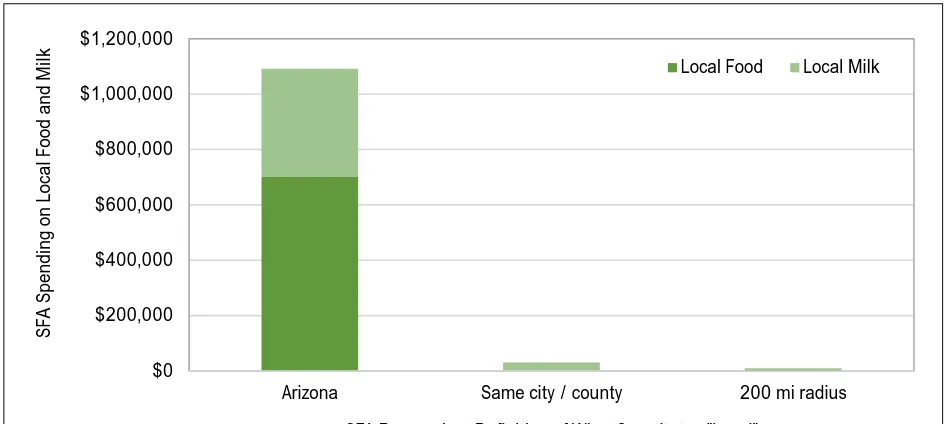
Another important consideration for this analysis is the potential mismatch between the geo-graphic scope of the analysis and the most com-mon definitions of “local” by Southern Arizona SFAs. Figure 5 shows reported spending on local food and milk categorized by the reporting SFA’s definition of “local.” Overwhelmingly, respondents consider local to be within the state of Arizona. Only two respondents with local purchases defined local as smaller than the state level, and their pur-chases were comparatively small. This IMPLAN analysis is based upon the assumption that all local spending occurred within the study area (Pima, Cochise, Santa Cruz, and Yuma counties). While it is fair to assume much of that production might have occurred within the study area, there is the potential for additional leakages, which would further moderate the economic impacts. On the other hand, for those SFAs who consider local to be within the same city or county, or within a specific radius, their reported spending could be significantly undercounting purchases from within the study area but that do not fit their definition of local. Future research might consider state-level reliance on DoD program funds as a share of farm-to-school spending and farm-to-school program spending by definition of local.
(Arizona Department of Education, 2018). Of the 10 SFAs that reported their spending on local foods, three respondents’ answers matched the figures reported to the Arizona Department of Education for total spending on food. Information for two SFAs was not available. The five remaining respondents all had underreported total food spend-ing on the Farm to School Census compared to the figures reported to the Arizona Department of Education. Total food spending reported by SFAs on the Farm to School Census ranged from 7.4% lower to 90% lower than spending reported to the state. While this does not directly affect the accuracy of local food spending responses in the FTS Cen-sus, it does impact the accuracy of the variables measuring the percent of total food cost that is local. It also brings into question the issue of overall accuracy of food expenditure figures, including local expenditures.
Siegfried, Sanderson, and McHenry (2007), in a review of the best practices for assessing the eco-nomic impacts of educational institution spending, point to the need to establish a realistic and well-defined counterfactual in order to assess the true economic impacts of institutional spending. The same can be said of farm-to-school programs. For
Farm to School Census data to be more easily applied to economic impact analyses, it would be helpful to have a means of comparing local pro-curement to non-local propro-curement, both for schools purchasing locally as well as those that do not. For example, do those schools purchasing local produce through farm-to-school programs use the same distributor for local foods as they do for non-local foods? In the case of local purchases for which a non-local option is not available, such as winter lettuce in Arizona, should that spending be counted as a program economic impact?
The regional economic effects of farm-to-school programs are complicated to assess given the varying definitions of local, the potential for negligible impacts resulting from the decisions of individual food-chain actors, and a lack of informa-tion to build reliable counterfactual scenarios. That said, the Farm to School Census is one of the few data sources easily accessible for analyzing the eco-nomic impacts of local food efforts. Institutional buyers such as schools represent an important opportunity for food producers and intermediary market channels to sell local foods in a structured and steady arrangement (Washington State Depart-ment of Agriculture [WSDA], 2014) and potentially
Figure 5. School Food Authorities’ (SFAs’) Local Food Spending (in US$) in Southern Arizona by Definition of Local (all in US$)
$0 $200,000 $400,000 $600,000 $800,000 $1,000,000 $1,200,000
Arizona Same city / county 200 mi radius
SFA Spending
on Local
Food and Milk
SFA Respondent Definition of What Constitutes "Local"
Local Food Local Milk
achieve improved financial outcomes (Bauman, Thilmany McFadden, & Jablonski, 2018). As the prevalence of farm-to-school programs increases and interest grows in other programs to promote local foods, there is a need for improved informa-tion to fully understand the potential scope and scale of the impacts and tradeoffs associated with increases in local food activity, as well as the barriers to its future growth, particularly in areas where water is scarce. The introduction of
additional questions to inform counterfactuals for economic impact analysis, particularly regarding export substitution, would be an important step to increase the usefulness to practitioners of the Farm to School Census.
Acknowledgment
The authors would like to thank Ashley Schimke of the Arizona Department of Education for her assistance with primary research for this project.
References
Arizona Department of Education. (2018). Districts/Charters Food Services Annual Financial Reports. Information and Financial Services. Retrieved from https://www.ade.az.gov/Budget/EntitySelection.asp
Arizona Department of Education & Arizona Grown. (2014). Department of Defense Fresh Produce Program: Trends in local purchasing, 2012–2013. Retrieved from http://www.farmtoschool.org/resources-main/department-of-defense-fresh-produce-program-trends-in-local-purchasing-2012-2013
Bauman, A., & Thilmany McFadden, D. (2017). Exploring localized economic dynamics: Methods-driven case studies of transformation and growth in agricultural and food markets. Economic Development Quarterly, 31(3), 244–254.
https://doi.org/10.1177/0891242417709530
Bauman, A., Thilmany McFadden, D., & Jablonski, B. B. R. (2018). The financial performance implications of
differential marketing strategies: Exploring farms that pursue local markets as a core competitive advantage. Agricultural and Resource Economics Review, 47(3), 477–504. https://doi.org/10.1017/age.2017.34
Becot, F., Kolodinsky, J. M., Roche, E., Zipparo, A. E., Berlin, L., Buckwalter, E., & McLaughlin, J. (2017). Do farm-to-school programs create economic impacts? Choices Magazine, 32(1). Retrieved from
http://www.choicesmagazine.org/choices-magazine/theme-articles/transformations-in-the-food-system-nutritional-and-economic-impacts/do-farm-to-school-programs-create-local-economic-impacts
Bickel, A. K., Duval, D., & Frisvold, G. (2017). Arizona’s agribusiness system: Contributions to the state economy. University of Arizona Department of Agricultural & Resource Economics. Retrieved from
https://cals.arizona.edu/arec/publication/arizonas-agribusiness-system-contributions-state-economy
Burnett, P., Kuethe, T. H., & Price, C. (2011). Consumer preference for locally grown produce: An analysis of
willingness-to-pay and geographic scale. Journal of Agriculture, Food Systems, and Community Development, 2(1), 269–278.
http://dx.doi.org/10.5304/jafscd.2011.021.013
Christensen, L., Jablonski, B., Stephens, L., & Joshi, A. (2017). Economic impacts of farm to school: Case studies and assessment tools. National Farm to School Network. Retrieved from
http://www.farmtoschool.org/Resources/EconomicImpactReport.pdf
Fleck, B. (2013). Factors affecting agricultural water use and sourcing in irrigation districts of central Arizona (Unpublished master’s thesis). University of Arizona, Tucson, AZ.
Frisvold, G. (2015). Developing sustainability metrics for water use in Arizona small grain production. Department of Agricultural & Resource Economics, University of Arizona. Retrieved from https://cals.arizona.edu/arec/sites/cals.arizona.edu.arec/ files/publications/Developing_Sustainability_Metrics_for_Water_Use_in_Arizona_Small_Grain_Production.pdf Frisvold, G., Sanchez, C., Gollehon, N., Megdal, S., & Brown, P. (2018). Evaluating gravity-flow irrigation with lessons from
Yuma, Arizona, USA. Sustainability, 10(5), 1548. https://doi.org/10.3390/su10051548
Goldenberg, M., Meter, K., & Thompson, O. (2017). Tracking the impacts of farm-to-school purchasing programs.
Journal of Nutrition and Human Health, 1(2), 1–8. Retrieved from http://www.alliedacademies.org/articles/tracking-the-impacts-of-farmtoschool-purchasing-programs-8434.html
Haynes, M. (2009). Farm-to-school in Central Minnesota – Applied economic analysis (CAP Report 144). Minneapolis, MN: Region Five Development Commission & University of Minnesota. Retrieved from
http://www.cura.umn.edu/publications/catalog/cap-144
IMPLAN. (2014). IMPLAN Professional (Version 3.1). Huntersville, North Carolina: IMPLAN.
Jacobs, K. & Holway, J. (2004). Managing for sustainability in an arid climate: Lessons learned from 20 years of groundwater management in Arizona, USA. Hydrogeology Journal, 12(1), 52–65. https://doi.org/10.1007/s10040-003-0308-y
Kanazawa, M. (1993). Pricing subsidies and economic efficiency: The US bureau of reclamation. The Journal of Law and Economics, 36(1), 205–234. https://doi.org/10.1086/467271
Kane, D., Kruse, S., Ratcliffe, M. M., Sobell, S. A., & Tessman, N. (2010). The impact of seven cents. Portland, Oregon: Ecotrust. Retrieved from https://ecotrust.org/publication/the-impact-of-seven-cents/
Kerna, A., Duval, D., & Frisvold, G. (2017). Arizona leafy greens: Economic contributions of the industry cluster. University of Arizona Dept. of Agricultural & Resource Economics. Retrieved from https://cals.arizona.edu/arec/sites/cals.arizona. edu.arec/files/publications/FINAL%20leafy%20greens%20september%202017.pdf
Kluson, R. A. (2012). Regional and local economic impacts of the Sarasota County Farm to School Program (Fact Sheet). University of Florida Agriculture/Natural Resource Extension. Retrieved from
https://www.sarasotacountyschools.net/departments/fns/default.aspx?id=45858
Low, S. A., Adalja, A., Beaulieu, E., Key, N., Martinez, S., Melton, A., … Jablonski, B. B. R. (2015). Trends in U.S. local and regional food systems (AP-068). U.S. Department of Agriculture, Economic Research Service. Retrieved from
https://www.ers.usda.gov/publications/pub-details/?pubid=42807
Low, S. A., & Vogel, S. (2011). Direct and intermediated marketing of local foods in the United States (ERR-128). U.S. Department of Agriculture, Economic Research Service. Retrieved from
https://www.ers.usda.gov/webdocs/publications/44924/8276_err128_2_.pdf?v=0
Miller, R., & Blair, P. (2009). Input-output analysis: Foundations and extensions (2nd ed.). New York: Cambridge University Press.
Moore, M. R., & Dinar, A. (1995). Water and land as quantity-rationed inputs in California agriculture: Empirical tests and water policy implications. Land Economics,71(4), 445–461. https://doi.org/10.2307/3146710
National Center for Education Statistics (NCES). (2014). Local Education Agency (School District) Universe Survey Data.
Retrieved from https://nces.ed.gov/ccd/pubagency.asp
National Farm to School Network (n.d.). What is farm to school. Retrieved in February 2018 from
http://www.farmtoschool.org/about/what-is-farm-to-school
Onozaka, Y., Nurse, G., & Thilmany McFadden, D. (2010). Local food consumers: How motivations and perceptions translate to buying behavior. Choices Magazine, 25(1). Retrieved from
http://www.choicesmagazine.org/UserFiles/file/article_109.pdf
Pesch, R. (2014). Assessing the potential farm-to-institution market in Central and Northeast Minnesota. University of Minnesota Extension. Retrieved from https://conservancy.umn.edu/handle/11299/171633
Roche, E., Becot, F., Kolodinsky, J., & Conner, D. (2016). Economic contribution and potential impact of local food purchases made by Vermont schools. Burlington, VT: Center for Rural Studies, University of Vermont. Retrieved from
http://agriculture.vermont.gov/sites/ag/files/CRS_Economic%20Contribution%20of%20Farm%20to%20School_FIN AL.pdf
Siegfried, J., Sanderson, A., & McHenry, P. (2007). The economic impact of colleges and universities. Economics of Education Review, 26(5), 546–558. https://doi.org/10.1016/j.econedurev.2006.07.010
Swenson, D. (2010). Selected measures of the economic values of increased fruit and vegetable production and consumption in the Upper Midwest. Leopold Center for Sustainable Agriculture, Iowa State University. Retrieved from
http://lib.dr.iastate.edu/leopold_pubspapers/68
Thilmany McFadden, D., Conner, D., Deller, S., Hughes, D., Meter, K.…Tropp, D. (2016). The economics of local food systems: A toolkit to guide community discussions, assessments, and choices. U.S. Department of Agriculture, Agricultural Marketing Service. Retrieved from https://www.ams.usda.gov/publications/content/economics-local-food-systems-toolkit-guide-community-discussions-assessments
Tuck, B., Haynes, M., King, R., & Pesch, R. (2010). The economic impact of farm-to-school lunch programs: A central Minnesota example. University of Minnesota Extension Center for Community Vitality and University of Minnesota Department of Applied Economics. Retrieved from https://conservancy.umn.edu/bitstream/handle/11299/ 171560/2010-EIA-Farm-School-Programs.pdf
U.S. Census Bureau. (n.d.). North American Industry Classification System. Retrieved from
https://www.census.gov/eos/www/naics/
U.S. Department of Agriculture (USDA). (n.d.). About the Census:The Farm to School Census. Retrieved in February 2018 from https://farmtoschoolcensus.fns.usda.gov/about
USDA. (1999). 1997 Census of Agriculture – County Data. Table 2. Market Value of Agricultural Products Sold Including Direct Sales. Retrieved from
http://usda.mannlib.cornell.edu/usda/AgCensusImages/1997/01/03/1599/Table-02.pdf
USDA. (2004). 2002 Census of Agriculture – County Data. Table 2. Market Value of Agricultural Products Sold Including Direct Sales. Retrieved from
http://usda.mannlib.cornell.edu/usda/AgCensusImages/2002/01/02/1703/Table-02.pdf
USDA. (2009). 2007 Census of Agriculture – County Data. Table 2. Market Value of Agricultural Products Sold Including Direct Sales. Retrieved from
https://www.nass.usda.gov/Publications/AgCensus/2007/Full_Report/Volume_1,_Chapter_1_State_Level/Arizona/st 04_1_002_002.pdf
USDA. (2014). 2012 Census of Agriculture – County Data. Table 2. Market Value of Agricultural Products Sold Including Direct Sales. Retrieved from
https://www.nass.usda.gov/Publications/AgCensus/2012/Full_Report/Volume_1,_Chapter_2_US_State_Level/st99_2_002_ 002.pdf
USDA. (2015). 2015 Farm to School Census Questionnaire. Retrieved from
https://farmtoschoolcensus.fns.usda.gov/sites/default/files/asset/document/2015%20USDA%20Farm%20to%20Scho ol%20Census%20Fax-back%20Questionnaire_3.16.15_0.docx
USDA. (2016a). 2015 Farm to School Census Respondent Data.The Farm to School Census. Retrieved from
https://farmtoschoolcensus.fns.usda.gov/sites/default/files/asset/document/2015%20F2S%20Census%20SFA%20Dat a_10.31.16_web_3_0.xlsx
USDA. (2016b). Local Foods Marketing Practices Survey. Retrieved from
https://www.agcensus.usda.gov/Publications/Local_Food/
USDA, Economic Research Service (USDA ERS). (2000). Farm resource regions (Agricultural Information Bulletin Number 760). United States Department of Agriculture, Economic Research Service. Retrieved from
https://www.ers.usda.gov/webdocs/publications/42298/32489_aib-760_002.pdf?v=42487
USDA, National Agricultural Statistics Service (USDA NASS). (2013). USDA NASS, Arizona Field Office 2013 Annual Statistics Bulletin. Retrieved from https://www.nass.usda.gov/Statistics_by_State/Arizona/Publications/Annual _Statistical_Bulletin/2013/2013-AZ-Bulletin.pdf
USDA, NASS. (2014a). Arizona Agricultural Statistics 2014. Retrieved from https://www.nass.usda.gov/Statistics_by_State/ Arizona/Publications/Annual_Statistical_Bulletin/2014/AZ-Bulletin-2014.pdf
USDA, NASS. (2014b). Farm and Ranch Irrigation Survey: 2013; Volume 3, Special Studies, Part 1 of the 2012 Census of Agriculture, AC-12-SS-1. Washington, D.C.: National Agricultural Statistics Service.. Retrieved from
https://www.nass.usda.gov/Publications/AgCensus/2012/Online_Resources/Farm_and_Ranch_Irrigation_Survey/ Valpiani, N. H., Wilde, P. E., Rogers, B. L., & Stewart, H. G. (2016). Price differences across farmers’ markets, roadside
stands, and supermarkets in North Carolina. Applied Economic Perspectives and Policy, 38(2), 276–291.
Washington State Department of Agriculture (WSDA). (2014). Direct marketing strategies: Selling to schools and other institutions. https://agr.wa.gov/Marketing/SmallFarm/Greenbook/docs/14.pdf