Lincoln University
FINANCIAL
BUDGET MANUAL
2012
SECTION A
PRODUCT PRICES
EDITORS:
David Askin B. Ag. Sc. (Hons), Ph D
Virginia Askin B. C.M. (Accounting)
"Manual Sales" Faculty of Commerce
P. O .Box 84 Lincoln University
Lincoln 7647 New Zealand
PREFACE
The "Financial Budget Manual 2012" is an invaluable reference book for farmers and growers, consultants and students. It contains a wealth of up to date information on farm and orchard costs and prices, the profitability of different enterprises, and income taxation. Following its successful introduction in 1999, the manual is in the process of moving to the web. However, many users find having the information in a book is the most convenient and efficient format, and this manual is the result of the Universities commitment to the wide readership.
This year we have started a process of moving information in sections to the web, for individual purchase as pdf’s. On-line calculators are being prepared and the opportunity for contractors to register/advertise is available at www.aginfo.lincoln.ac.nz.
Unless stated otherwise, data contained in the Manual are current mid-2012 and are exclusive of GST. Prices do not remain stationary so the Manual should be used as a guide only. Market movements and exchange rate changes are just two of the factors which can rapidly alter costs and prices. The availability of discounts for bulk purchases, and deferred payment arrangements, may also affect final costs for budgeting purposes. In addition, some commodity price information is becoming increasingly sensitive and remains confidential between the client and the supplier and/or buyer. It is therefore unavailable for publication in this Manual.
Information quoted has been gathered from hundreds of sources throughout New Zealand, but some variation may occur between regions. Trade names have been used for clarity and convenience; no preferential endorsement by the University is intended, nor is any criticism implied of any product which does not appear in the Manual. If you as a supplier would like your products listed – please use the website as your point of contact.
Please note that each of the sections is paged individually, and comprehensive index provided.
Our sincere thanks to staff at Leech and Partners Ltd., and Murray Clark who contributed Section D on Tax. Thanks also to all the individuals, organisations and commercial firms who have provided information for our use. Without their co-operation, the production of the Financial Budget Manual would not be possible, and we sincerely appreciate the willingness of all those who have contributed. We wish to express our appreciation to the Assistant Editor Annmarie Baldwin for her efforts in gathering and collating the information.
information or opinions contained in this Manual. Lincoln University does not accept any liability for the accuracy, currency, reliability or correctness of any information provided by third parties.
The inclusion of advertisements in the text does not necessarily imply the University's endorsement of those advertised products/services.
Any suggestions for the improvement of the Manual would be welcomed.
For readers' information the Faculty of Commerce at Lincoln University also produces a companion volume - the "Farm Technical Manual". It is a versatile reference book, which brings into one place all manner of essential technical information required by farmers and others involved in the farming industry.
David and Virginia Askin EDITORS
SECTION 1 - PRODUCT PRICES
1.1 Market Prices ... A- 3 1.1.1 Impact of Exchange Rate on Product Prices ... A- 3 1.1.2 Exchange Rate ... A- 4
1.2 Sheep ... A- 5 1.2.1 Lamb Schedule (Export) ... A- 5 1.2.2 Lamb Price Trends ... A- 5 1.2.3 Lamb Skin Price Trends 1988 to 2012 ... A- 7 1.2.4 Lamb Supply Options ... A- 7 1.2.5 Live Lamb and Sheep Shipments ... A- 8 1.2.6 Slink Skins ... A- 8 1.2.7 Mutton Schedule (Export) ... A- 9 1.2.8 Ewe Supply Options ... A- 9 1.2.9 Mutton Price Trends (Export) ... A- 9 1.2.10 Ewe and Lamb Prices - Prime Stock (Local Sales) ... A- 10 1.2.11 Ewe and Lamb Prices - Store and Breeding Stock ... A- 11
1.3 Wool ... A- 13 1.3.1 Wool Market Prices ... A- 13 1.3.2 Wool Price Trends ... A- 14
1.4 Cattle ... A- 16 1.4.1 Beef Schedule (Export) ... A- 16 1.4.2 Beef Price Trends (Export) ... A- 17 1.4.3 Beef Supply Options ... A- 18 1.4.4 Calf Slink Skins ... A- 18 1.4.5 Cattle Prices - Prime Stock (Local Sales) ... A- 19 1.4.6 Store and Breeding Cattle Prices ... A- 20 1.4.7 T.B. Compensation ... A- 22
1.6.2 Venison Supply Options ... A- 36 1.6.3 Venison Price Trends... A- 36 1.6.4 Deer Live Sales ... A- 38 1.6.5 Velvet ... A- 38 1.6.6 TB Compensation ... A- 39
1.7 Goat Production ... A- 40 1.7.1 Introduction ... A- 40 1.7.2 Goat Meat Prices (Chevon) ... A- 40 1.7.3 Meat Price Trends ... A- 41 1.7.4 Goat Milk ... A- 41 1.7.5 Goat Fibre ... A- 42 1.7.6 Goat Livestock Sales ... A- 43
1.8 Pig Production ... A- 44 1.8.1 Pig Meat Prices ... A- 44 1.8.2 Average Pig Meat Returns 1987 to 2012 ... A- 45 1.8.3 Live Pig Price Trends ... A- 47
1.9 Camelids ... A- 48
1.10 Crops ... A- 49 1.10.1 Wheat ... A- 49 1.10.2 Barley ... A- 52 1.10.3 Oats/Oaten Hay ... A- 55 1.10.4 Peas ... A- 56 1.10.5 Maize/Maize Silage ... A- 58 1.10.6 Ryecorn ... A- 58 1.10.7 Lentils ... A- 59 1.10.8 Triticale ... A- 59 1.10.9 Lupins ... A- 59 1.10.10 Linseed ... A- 60 1.10.11 Evening Primrose ... A- 60 1.10.12 Borage ... A- 60 1.10.13 Oilseed Rape/Canola ... A- 60
1.11 Small Seeds ... A- 62 1.11.1 Pasture Grasses ... A- 62 1.11.2 Turf/Amenity Species ... A- 62 1.11.3 Legumes ... A- 62 1.11.4 Forage Herbs ... A- 63 1.11.5 Forage Brassicas ... A- 63
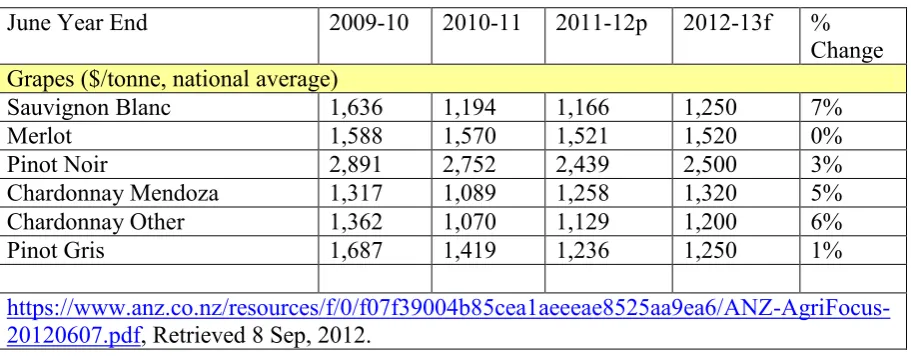
1.12.4 Berryfruit ... A- 65 1.12.5 Citrus ... A- 66 1.12.6 Feijoa ... A- 67 1.12.7 Grapes ... A- 68 1.12.8 Kiwifruit ... A- 70 1.12.9 Olives ... A- 72 1.12.10 Pears ... A- 72 1.12.11 Stone Fruit ... A- 72
1.13 Vegetable Production ... A- 73 1.13.1 Vegetable Prices - General ... A- 73 1.13.2 Asparagus ... A- 73 1.13.3 Broccoli ... A- 73 1.13.4 Capsicum ... A- 74 1.13.5 Carrots ... A- 74 1.13.6 Cauliflower ... A- 74 1.13.7 Kabocha (Squash) ... A- 74 1.13.8 Lettuce ... A- 74 1.13.9 Onions ... A- 75 1.13.10 Peas ... A- 75 1.13.11 Potatoes ... A- 75 1.13.12 Sweetcorn ... A- 77 1.13.13 Tomatoes ... A- 77
1.14 Cut Flowers ... A- 78 1.14.1 Local Market ... A- 78
1.15 Apicultural Products ... A- 85 1.15.1 Honey ... A- 85 1.15.2 Beeswax ... A- 85 1.15.3 Pollen ... A- 85 1.15.4 Propolis ... A- 85 1.15.5 Pollination ... A- 86 1.15.6 Live Bees ... A- 86
1.1
MARKET PRICES
1.1.1 Impact of Exchange Rate on Product Prices
For pastoral farming, exchange rates can have a dominant effect on prices at the farm gate. The exchange rate is influenced by four main factors. These are the Government's fiscal policy (its spending behaviour), its monetary policy (how much money the Reserve Bank permits to circulate within the economy at any given time), the interest rate level (the cost of borrowing money on the domestic money market) and the inflation rate. The following table shows the estimated movements in farm gate prices for a 10% movement in trade-weighted exchange rates for a range of commodities. This movement in exchange rates effectively gives the same result as a price change at f.o.b.*.
In general the greater the processing and handling charges between the farm gate and f.o.b. as a proportion of the f.o.b. price the greater the impact of exchange rate movements in farm gate prices. Products such as wool, where the proportion of the value added between farm and ship is low relative to other pastoral products, show the least leveraged effect of
exchange rate movements. Mutton at the other extreme shows the highest leveraged effect. In times of currency volatility, low added value products minimise exposure to appreciation of the currency, but minimise potential gains to producers from currency depreciation.
* f.o.b. - Free on Board (ship or aeroplane)
Farm Gate Prices - Effect of a 10% Movement in Trade Weighted Exchange Rates.
Depreciation Appreciation
Wool +14% -11%
Lamb +16% -13%
Mutton +17% -14%
Beef +15% -12%
Note: The figures assume the appreciation or depreciation is effective for the whole season. Fluctuations of lesser duration will have lesser effects.
1.1.2 Exchange Rate
(i) Major Currencies and TWI to $NZ (2011)
2011 USA UK Aust Japan Euro TWI
Jan 2011 0.7653 0.4847 0.7692 63.29 0.5732 68.7 Feb 2011 0.7623 0.4728 0.7565 62.98 0.5583 67.8 Mar 2011 0.7408 0.4582 0.7333 60.41 0.5290 65.2 Apr 2011 0.7859 0.4810 0.7450 65.57 0.5447 68.2 May 2011 0.7959 0.4868 0.7447 64.60 0.5550 68.7 Jun 2011 0.8150 0.5023 0.7686 65.63 0.5666 70.3 Jul 2011 0.8455 0.5239 0.7852 67.17 0.5912 72.7
Aug 2011 0.8384 0.5123 .7978 64.67 0.5849 72.1
Sep 2011 0.8143 0.5155 0.7943 62.59 0.5908 71.2 Oct 2011 0.7879 0.5007 0.7799 60.39 0.5754 69.3 Nov 2011 0.7728 0.4884 0.7635 59.95 0.5692 68.2 Dec 2011 0.7697 0.4936 0.7603 59.92 0.5839 68.6
Source: Reserve Bank.
(ii) $US to $NZ (1974 to 2011)
0 0.2 0.4 0.6 0.8 1 1.2 1.4 1.6
1974 1976 1978 1980 1982 1984 1986 1988 1990 1992 1994 1996 1998 2000 2002 2004 2006 2008 2010
$US
1.2
SHEEP1.2.1 Lamb Schedule (Export)
Meat which is destined for export is graded by individual companies reflecting the market’s needs. The various grades are paid for according to Works' schedules, which are set every week during the killing season. Below is a schedule from a meat company for a week in April 2012. Weights shown are hot weights in kilograms.
Weight (kg) Procurement Premium Total Meat Value
9.10 - 13.2 0.00 $2.90
13.3 - 13.9 0.00 $4.00
14.0 - 15.9 0.00 $5.25
16.0 - 18.9 0.00 $5.25
19.0 - 22.9 0.00 $5.25
23.0 – 24.9 0.00 $4.65
25.0 – 29.9 0.00 $4.35
30.0 and over 0.00 $3.85
Other grades P, Y and T. Also F (14.0 – 22.9kg) C grade & remaining F grade minus $0.60 additional quality presentation, shorn or bellied $0.10/kg on qualifying lambs from 30/1/12
Wool and Pelt : Wool Pull 1.0kg = $7.50 Small Pelt under 13.3kg minus $1.50 / head Large Pelt over 17.5kg plus $1.50 / head
Lamb c/kg incl P,Y,T and F incl wool & pelt presentation
Weight 14.0 to 22.9kg $5.70
Weight 23.0 to 24.9kg $5.30
Weight 25kg and over $4.90
1.2.2 Lamb Price Trends
(i) Average prices paid for YM lamb (13.3 to 17.0kg); and All Grades lamb: with 1kg woolpull
2006/07 2007/08 2008/09 2009/10 2010/11 2011/12e YM ($/head) $52.30 $56.91 $80.57 $73.23 $99.73 $95.85 This price comprises:
- Average weight (kg) 15.45 15.31 15.57 15.63 15.65 15.65 - All-in (skin + wool) c/kg 338.5 371.7 517.5 468.5 637.3 612.3 All Grades Avg ($/hd) $53.89 $58.55 $89.83 $81.30 $117.64 $114.75 Average weight (kg) 16.90 16.49 17.67 17.63 18.23 18.46 Notes: 1. Prices are at works, for year ended 30 September.
2. Figures may not add due to rounding.
(ii) Actual and Inflation Adjusted Lamb Prices, 1980 to 2012e. (YM Grade Export Lamb Price - September year) Base year 2004/05.
Source: Beef + Lamb New Zealand Economic Service, Lincoln University
(iii) Average net export price paid for heavy and medium lambs with a 1 kg woolly pelt (monthly averages, January 1988 to December 2011).
0 20 40 60 80 100 120 140 160 180
1988 1990 1992 1994 1996 1998 2000 2002 2004 2006 2008 2010
$/
H
ead
Medium Heavy
Note: Until October 1993 categories were 13.5kg and 21kg. From November 1993 to June 1996 weights were 14kg and 18kg and from July 1996 onwards weights were 15kg and 18kg. From 2001, weights were 15kg and 21.0kg. From July 2009 they were
0 20 40 60 80 100 120
$/
H
e
ad
(iv) Prime Lamb/Hogget Prices - Local Trade (See Section 1.2.10)
(v) Store Lamb Prices (See Section 1.2.11)
1.2.3 Lamb Skin Price Trends 1988 to April 2012
The graph shows the "at works" price for shorn lamb skins (including 1 kg wool pull).
0 2 4 6 8 10 12 14
1988 1990 1992 1994 1996 1998 2000 2002 2004 2006 2008 2010 2012
$/
Pel
t
Source: Beef + Lamb New Zealand Economic Service
1.2.4 Lamb Supply Options
Most Meat Companies offer clients a range of supply options.
Silver Fern™ Farms' Backbone® programme
Farmer suppliers have the option of supplying under: - Committed Supplier Programme
- Integrated Value Chain Programme
The committed supplier option has a paid weekly schedule and lambs must be Farm Assured.
Committed Supplier Programme
Stock class Premium Grades Weights Criteria
Lambs $0.10/kg P and Y 14 to 22.9kg Farm Assured
A and B presentation Other supplier premiums
Shorn or bellied and
Integrated Value Chain Programme options Lamb
BackboneTM Partnership Club
15-22.9 kg, P & Y Grades 60 days Farm Assured A and B presentation
No ram lambs after 31 March
Operates for 12 months split into
1. Peak season Dec – May 2. Winter season Jun - Nov M&S Lamb
partnership
17 – 21.9 kg P & Y grades 60 days Farm Assured A & B presentation Must be PrimeraTM lamb No ram lambs after 31 March
Operates from Dec to May
North American Lamb
15-22.9 kg, P & Y Grades 60 days Farm Assured A & B presentation
Antibiotic free from accredited farms No ram lambs after 31 March
Operates for 12 months split into
1. Peak season Dec – May 2. Winter season Jun - Nov
Organic Lamb 15-22.9 kg, P & Y Grades 60 days Farm Assured A & B presentation Certified Organic
No ram lambs after 31 March
Operates from Dec to May
Performance Premium Pools
Applicable to all the above supply options. Payable quarterly with 10% retention Criteria include:
market returns
proportion of stock supplied meeting quality specs(weights and grades) meeting BackboneTM Committed Supply Plan numbers
quality attributes determined by X-ray carcase analysis where applicable other specific market related criteria as required by customer eg compliance to
environmental plan
Affco offer a straight option of across all the grades and weights, payouts are 100% and are paid within 7 to 14 days of slaughter.
1.2.5 Live Lamb and Sheep Shipments
From 2001 until 2003 approximately 36,000 live sheep were exported. From 2007 until now there have been no live sheep exports..
1.2.6 Slink Skins
A North Island Firm:
Large (Other sizes have no commercial value)
2005 $0.50
2006 to 2011 $1.00
1.2.7 Mutton Schedule (Export)
The mutton schedule works in the same way as for lamb (refer to Section 1.2.1). Below is a schedule from a meat company for a week in April 2012. These are net prices offered to farmers for the various mutton grades.
Weight (kg) Grade Base Price
Up to 23.2 MX1, ML1 $2.90 per kg
Over 23.3 MX2, ML2 $2.90 per kg
MH, MP $2.10 per kg
MF, MM $1.90 per kg
1.2.8 Ewe Supply Options
Affco offer a straight option of across all the grades and weights, payouts are 100% and are paid within 7 to 14 days of slaughter.
1.2.9 Mutton Price Trends (Export)
Net Value of a 21kg (carcase weight) Ewe with a 0.5kg Pelt January 1989 to December 2011
0 20 40 60 80 100 120
1988 1990 1992 1994 1996 1998 2000 2002 2004 2006 2008 2010
$
/He
a
d
Source: N.Z. Farmer January 1989 to April 2001, Meat Matters, and Straight Furrow.
Average Prices Paid for <22kg Mutton; and "All Grades Average" Prices are at works, for year ended 30 September.
2007/08 2008/09 2009/10 2010/11 2011/12e MX1 Mutton < 22kg $/head $32.66 $45.05 $50.02 $80.34 $78.50
1.2.10Ewe and Lamb - Prime Stock (Local Sales)
A large amount of meat is sold directly from farms to wholesale buyers, but the prime stock auction sales in main centres still set the local market. The current situation can be
determined from the weekly reports in the newspapers or www.interest.co.nz/rural. The following information should be used as a guide only.
Sales Information (three main sale centres) 2011: Prices represent ranges from the prime sales at each centre over a two-month period.
(Average $ per head) Few hoggets were sold, so no information is given.
Feilding Tuakau Canterbury
Low High Low High Low High
Jan/Feb
Lambs $99 $126 $100 $120 $104 $121
Ewes $78 $98 $69 $90 $84 $108
Mar/Apr
Lambs $114 $129 $116 $132 $120 $130
Ewes $85 $112 $84 $102 $80 $103
May/June
Lambs $135 $159 $128 $150 $134 $161
Ewes $91 $124 $75 $120 $104 $123
July/Aug
Lambs $144 $178 $139 $170 $151 $165
Ewes $93 $113 $80 $115 $100 $125
Sept/Oct
Lambs $167 $176 $145 $166 $162 $178
Ewes $117 $122 $75 $113 $105 $138
Nov/Dec
Lambs $146 $174 $134 $151 $142 $166
Ewes $105 $138 $103 $106 $124 $138
Note: The price range is the average price (of each type, over a number of sales) for Feilding, Tuakau, and Canterbury.
1.2.11Ewe and Lamb - Store and Breeding Stock
This information should be used as a guide only, as store and breeding sheep prices may vary markedly between districts, seasons and breeds. Sales are normally on a per kg basis. (i) Average Prices for Store Stock (N.Z. Regions) 2002 to 2012
Store Lambs $ per head Northland/ Waikato/BOP
East Coast Taranaki Manawatu
Marlborough Canterbury
Otago Southland
2002/03 86.43 78.51 94.71 109.54 156.78
2003/04 110.48 100.87 95.21 104.99 140.42
2004/05 107.66 89.57 106.33 123.96 111.15
2005/06 96.38 84.63 88.57 97.87 99.54
2006/07 68.19 74.10 76.29 94.40 89.14
2007/08 61.81 61.41 73.97 73.97 59.77
2008/09 98.56 113.61 80.75 96.97 151.77
2009/10 72.28 130.90 108.29 136.48 164.96
2010/11p 135.35 160.47 137.15 162.94 171.12
2011/12e 145.06 156.24 145.75 177.63 184.90
Store Two-Tooth Ewes $ per head Northland/
Waikato/BOP East Coast Manawatu Taranaki Marlborough Canterbury Southland Otago
2002/03 86.43 78.51 94.71 109.54 156.78
2003/04 110.48 100.87 95.21 104.99 140.42
2004/05 107.66 89.57 106.33 123.96 111.15
2005/06 96.38 84.63 88.57 97.87 99.54
2006/07 68.19 74.10 76.29 94.40 89.14
2007/08 61.81 61.41 73.97 73.97 59.77
2008/09 98.56 113.61 80.75 96.97 151.77
2009/10 72.28 130.90 108.29 136.48 164.96
2010/11p 135.35 160.47 137.15 162.94 171.12
2011/12e 145.06 156.24 145.75 177.63 184.90
Store Mixed Age Ewes $ per head Northland/
Waikato/BOP East Coast Manawatu Taranaki Marlborough Canterbury Southland Otago
2002/03 65.43 63.35 61.19 61.69 76.56
2003/04 67.68 70.67 72.41 63.68 77.09
2004/05 65.56 75.47 70.34 76.57 105.11
2005/06 63.81 68.75 60.48 56.09 45.82
2006/07 46.89 46.40 45.10 52.85 56.95
(ii) N.Z. Average Purchase Price for Two-Tooth and MA Ewes (1980 to 2012e) ($ per head - All Regions Average)
Source: Beef + Lamb New Zealand Economic Services 0
20 40 60 80 100 120 140 160 180
$ / H
ead
1.3
WOOL
1.3.1 Wool Market Prices
Shorn Wool Sales – Auction and Private. (Clean price, c per kg)
Month Merino
Mid-Micron Crossbred Fine Crossbred Coarse Indicator Lamb
2010 Jul 693 401 342
Aug 1,424 715 429 372
Sept 1,441 713 470 453
Oct 1,607 740 510 484 501
Nov 1,680 792 510 485 509
Dec 807 544 520 559
2011 Jan 843 567 537 594
Feb 657 609 665
Mar 976 686 647 674
Apr 1,053 651 618 604
May 1,029 676 638 627
Jun 1,010 682 639 638
2010-11 Auction1 1,538 852 565 529 597
Month Merino
Mid-Micron Crossbred Fine Crossbred Coarse Indicator Lamb
2011 Jul 988 656 623
Aug 977 634 605 573
Sept 2,031 949 657 619
Oct 1,843 890 682 645
Nov 1,864 920 661 636
Dec 1,855 927 624 594
2012 Jan 917 575 532 539
Feb 1,904 923 562 500 557
Mar 579 511 563
Apr 532 458 510
May 515 429 500
Jun
2011-12 Auction1 1,899 936 607 559 540
1=simple average, not weighted
1.3.2 Wool Price Trends
(i) Wool Market Indicator Prices.
Monthly Price Indicators, 1989 to Dec 2011
Price trends for four main segments of the New Zealand clip are shown on the graph below: Fine = 18 to 24 micron; Medium = 25 to 31; Strong = 32 to 41; Lamb = 31.
Note: Monthly figures unavailable for 2003/04, an annual average has been substituted in these graphs. Gaps in 2010 and 2011 indicate no wool data available.
Source: Straight Furrow, Lincoln University.
Annual Average Price Indicators 1994/95 to 2011/12 (cents per kilogram clean)
Fine Medium Strong
1994-95 1,230 598 464
1995-96 787 552 456
1996-97 806 489 393
1997-98 1,047 551 356
1998-99 737 432 362
1999-00 1,109 402 369
2000-01 1,543 519 405
2001-02 1,113 636 420
2002/03 1,462 718 443
2003/04 1,089 589 401
2004/05 992 534 387
2005/06 941 472 350
2006/07 1,225 514 341
2007/08 1,356 565 340
2008/09 1,098 594 371
2009/10 865 607 298
2010/11 1,538 699 361
2011/12e 1,898 924 607
0 500 1000 1500 2000 2500
cents
/
kg
Farm Gate Greasy Wool Price before Freight
With a lack of consistent Wool Auction data since the demise of the Wool Levy in April 2010 and its associated comprehensive wool statistics - the Sheep and Beef Farm Survey provides consistent actual greasy wool price data on a consistent and continuing basis.
Source: Beef + Lamb New Zealand Economic Service
(iii) Actual and Inflation Adjusted Clean Wool Price. These data no longer supplied.
Source: WoolPro, Beef + Lamb New Zealand Economic Service 0.0
100.0 200.0 300.0 400.0 500.0 600.0 700.0 800.0 900.0 1,000.0
ce
n
ts
/ k
g
South Is High Country Predominantly Fine Wool North Is All Classes -Predominantly Strong Wool
0 1 2 3 4 5 6 7 8
$/kg
1.4
CATTLE
1.4.1 Beef Schedule (Export)
Below is a schedule of gross prices ($/kg) for a week in April 2012 from a meat company. Charges and levies have not been deducted.
Steers / Heifers Bulls Prime Cows
Weight kgs P2 Price Weight kgs M2 Price Carcass weight P2 Price 145.5 - 195.0 $2.50 145.5 - 195.0 $2.30 Up to 195.0 $2.70 195.5 - 220.0 $3.00 195.5 - 220.0 $2.85 195.5 - 220.0 $2.85 220.5 - 245.0 $3.40 220.5 - 245.0 $3.35 220.5 - 245.0 $2.90 245.5 - 270.0 $3.60 245.5 - 270.0 $3.40 245.5 - 270.0 $2.95 270.5 - 295.0 $3.70 270.5 - 295.0 $3.70 270.5 - 295.0 $3.00 295.5 - 320.0 $3.70 295.5 - 320.0 $3.70 295.5 & over $3.00 320.5 - 345.0 $3.70 320.5 - 345.0 $3.70
345.5 - 370.0 $3.70 345.5 - 445.0 $3.70 370.5 - 400.0 $3.70 445.5 - 545.0 $3.00 400.5 & over $3.40 545.5 & over $2.60 T, L1, L2 grades minus
$0.10c/kg TM grade minus $0.05 c/kg T grade minus $0.10 c/kg
F grade minus $0.45 c/kg F grade minus $0.45 c/kg
L3 &A grades at manufacturing rates
Angus and Hereford plus $0.15 c/kg for qualifying cattle
All the above: Muscle class 1 plus $0.05c/kg. Muscle class 3 minus $0.05 c/kg
Manufacturing Cows
Weight kgs M Price
Up to 145.0 $1.95
145.0 – 170.0 $2.65
170.5 – 195.0 $2.75
195.5 – 220.0 $2.80
1.4.2 Beef Price Trends (Export)
(i) Net Price paid for 280 / 295 kg P2 Steer and 260kg / 320 kg Bull (Jan 1988 to Dec 2011)
0 200 400 600 800 1000 1200 1400
1988 1990 1992 1994 1996 1998 2000 2002 2004 2006 2008 2010
$
/He
a
d
P2 Steer Bull
Note: From April 2005, bull weights changed to 320kg to reflect market trends better.
Source: "N.Z. Farmer" Issues January 1988 to April 2001, Meat Matters, Straight Furrow.
(ii) Cow Beef Schedule
(170 - 195 kg) 05/06 06/07 07/08 08/09 09/10 10/11 11/12e
Cow M (cents/kg) 243 211 238 238 254 334 337
Cow M (avg $/hd) $444 $387 $435 $436 $465 $612 $617 Prices are at works, for year ended 30 September.
Source: Beef + Lamb Economic Service of New Zealand
(iii) Bull Beef Schedule
(270 - 295 kg) 05/06 06/07 07/08 08/09 09/10 10/11 11/12e
M Bull (cents/kg) 304 308 312 349 337 410 414
1.4.3 Beef Supply Options
Silver Fern™ Farms' Backbone® programme
Farmer suppliers have the option of supplying under the Committed supplier programme or the Integrated value chain programme
Committed Supplier premiums
Stock class Premium Grades Weights Criteria
Steer/heifer $0.05/kg P 245.5 – 370kg A and B presentation for all
Bull $0.05/kg M 245.5 – 400kg
Prime cow $0.05/kg P 195.5kg + Manuf cow $0.05/kg M 145kg + Other supplier premiums
Prime quality beef
premium $20/hd Stock with a pH measurement of 5.8 and under Volume quality supply premium On supply volumes over 10,000su
Paid on quality stock criteria in table above BackboneTM Integrated Value Chain Programme options
BackboneTM Prime Beef
245.5 – 370kg P grade steers / heifers Non-HGP, AHB tagged pH of 5.8 or less
Operates on a rolling quarterly basis
Prices announced prior to commencement of supply quarter. Qrt1 Dec – Feb Qrt2 Mar – May Qrt3 Jun – Aug Qrt4 Sept - Nov BackboneTM Bull 245.5 – 400kg
M grade bulls
Non-HGP, AHB tagged BackboneTM Cow M Cow 145kg +
P Cow 195.5kg+
Non-HGP, AHB tagged
BackboneTM Angus Sired by 100% Angus bull and at least 50% Angus dam
Non-HGP, AHB tagged
Angus Prime beef, bull and cow options as for above except M cow.
See section 1.2.4 for Performance Premium Pools
Affco offer a straight option of across all the grades and weights, payouts are 100% and are paid within 7 to 14 days of slaughter.
1.4.4 Calf Slink Skins North Island
Heavy Medium Light
2003 $3.00 $2.00 $0.50
2004 $3.00 $1.00 $0.50
2005 $2.00 $0.50 $0.50
2006 $3.00 $1.50 $0.50
2007 $2.50 $1.00 $0.50
Slink Skins Ltd (South Island)
Large Small
2002 $4.00 $1.00
2003 $4.00 $1.00
2004 $4.00 $1.00
2005 $3.00 $0.50
2006 $3.00 $0.50
2007 $3.00 $0.50
2008 $3.00 $1.00
2009 - -
2010 $1.00 $1.00
2011 $1.00 $1.00
1.4.5 Cattle Prices - Prime Stock (Local Sales) Sales Information (three main sale centres) 2011:
Prices represent ranges at each centre over a two-month period, and are cents/kg liveweight
Tuakau Frankton Canterbury
Low High Low High Low High
Jan/Feb
Steers 190 242 200 241 194 236
Heifers 180 238 169 231 172 217
Cows 90 196 137 175 114 194
Mar/Apr
Steers 208 255 195 258 198 245
Heifers 166 240 170 244 165 240
Cows 90 217 142 206 115 217
May/June
Steers 206 249 199 249 186 244
Heifers 179 233 171 232 170 235
Cows 111 212 141 206 97 178
July/Aug
Steers 191 235 186 235 192 247
Heifers 166 228 184 228 180 237
Cows 100 215 136 183 100 184
Sept/Oct
Steers 195 247 201 254 197 242
Heifers 174 241 174 243 173 229
Cows 100 220 136 190 115 167
Nov/Dec
Steers 204 250 218 256 200 248
1.4.6 Store and Breeding Cattle Prices
The following tables are a guide to the average prices paid for store and breeding cattle throughout the country.
(i) Average Prices for Store Stock (N.Z. Regions) 2000 to 2012e. Store 2.5 Year Steers ($ per head)
Northland/ Waikato/BOP
East Coast Taranaki Manawatu
Marlborough Canterbury
Otago Southland
2000/01 974 945 865 809 -
2001/02 960 1,021 881 1,007 918
2002/03 842 786 808 822 688
2003/04 706 788 781 731 733
2004/05 723 786 771 744 756
2005/06 875 852 811 735 840
2006/07 851 883 801 676 793
2007/08 788 780 749 599 669
2008/09 885 820 879 n/a 825
2009/10 806 724 918 821 833
2010/11p 1,010 1,027 874 n/a n/a
2011/12e 999 1,009 919 n/a n/a
p = provisional, e = estimate
Store 1.5 Year Steers ($ per head) Northland/
Waikato/BOP East Coast Manawatu Taranaki Marlborough Canterbury Southland Otago
2000/01 794 823 770 704 769
2001/02 799 820 835 846 668
2002/03 621 617 633 609 504
2003/04 605 610 640 581 515
2004/05 645 696 641 607 635
2005/06 651 683 707 628 596
2006/07 673 660 674 628 546
2007/08 593 603 633 540 423
2008/09 622 660 753 646 670
2009/10 704 653 778 687 566
2010/11p 756 777 780 722 584
2011/12e 742 757 800 737 672
Store Weaner Steers ($ per head) Northland/
Waikato/BOP East Coast Manawatu Taranaki Marlborough Canterbury Southland Otago
2000/01 484 531 540 459 521
2001/02 486 577 562 579 469
2002/03 373 439 417 412 371
2003/04 393 487 456 523 287
2007/08 355 410 368 347 338
2008/09 402 488 516 435 432
2009/10 467 509 511 478 375
2010/11p 454 548 498 559 432
2011/12e 447 536 548 548 450
p = provisional, e = estimate
Store Weaner Heifers ($ per head) Northland/
Waikato/BOP
East Coast Taranaki Manawatu
Marlborough Canterbury
Otago Southland
2000/01 454 351 439 363 370
2001/02 477 433 506 456 496
2002/03 352 332 325 346 219
2003/04 358 378 382 300 284
2004/05 405 398 397 406 434
2005/06 398 388 399 368 377
2006/07 361 374 363 372 453
2007/08 291 342 291 270 270
2008/09 392 445 368 322 321
2009/10 2010/11p 2011/12e
Store 1.5 year Heifers ($ per head) Northland/
Waikato/BOP
East Coast Taranaki Manawatu
Marlborough Canterbury
Otago Southland
2000/01 585 642 576 617 606
2001/02 617 650 662 593 592
2002/03 520 502 514 643 530
2003/04 470 463 472 502 336
2004/05 542 535 483 565 577
2005/06 544 584 497 524 577
2006/07 555 517 577 540 448
2007/08 527 506 476 535 492
2008/09 514 541 517 480 680
2009/10 531 591 603 560 595
2010/11p 624 699 637 681 717
2011/12e 608 682 663 675 646
Store Cows ($ per head) Northland/
2006/07 609 559 649 595 523
2007/08 681 609 565 833 518
2008/09 565 668 704 453 681
2009/10 572 515 680 687 673
2010/11p 744 721 803 882 929
2011/12e 744 796 893 930 n/a
p = provisional, e = estimate
Source: Beef + Lamb Economic Service of New Zealand
(ii) N.Z. Average Purchase Price for 18 Month Steers/Heifers (1980 to Dec 2011)
Source: Beef + Lamb Economic Service of New Zealand
1.4.7 T.B. Compensation
Subject to certain criteria, compensation is payable to the owners of cattle classified as TB reactors. For all TB cattle reactors, compensation will be payable at a rate of 65% of the fair market value of each reactor animal, up to the maximum allowable. A 35% top-up
compensation payment will be paid to farmers who have a clear or high-risk infected status dairy herd and the reactor animal is found to have no visible lesions on slaughter.
The AHB updates its maximum values for the purposes of compensation through PGG Wrightson on a monthly basis. The following are based on current market values average price per kg liveweight and valid from 1 Jun 2012. To obtain up to date values please contact the AHB on 0800 4 TB INFO (0800 4 824 636)
NB HERD OWNERS RECEIVE 65% OF THE AGREED VALUE See table over the page.
0 100 200 300 400 500 600 700 800 900
$ / Head
Beef $/kg Beef wnr
steers to 1 yr Small av - 160kg $3.00 Med av 161- 230kg $2.60 Heavy av 230kg + $2.60 Beef wnr hfrs
to 1 yr
Small av - 160kg $2.30
Med av 161-220kg $2.30
Heavy av 220kg + $2.30
Beef hfrs to
2yrs Small av - 250kg $1.90 Med av 300-380kg $1.90 Heavy av 381kg + $2.00 Beef Steers to
2 yr Light av 300 - 350kg $2.10 Beef Steers to
2 yr
Small av 351- 420kg $2.10
Med av 421-480kg $2.20
Heavy av 481kg + $2.20
Beef Breeding
2yr+ (Cows) Small av 350-400kg $1.50 Med av 401-470kg $1.60 Heavy av 470kg + $1.60 NB: In calf cows depending on stage of pregnancy add $50 - $70 per head
Beef Breeding
est av livewgt Ylg bulls av-380kg max value $1,200 2yr bulls av-700kg max value $1,800 aged bull 3yr av-800kg max value $1,800 NB: For young bulls check if insured
Dairy Beef $/kg Wnr Friesian bulls to 1 yr
Small av - 120kg $2.30
Med av 121- 180kg $2.30
Heavy av 180kg + $2.30
Non Breeding bulls, Friesian etc. 1 to 2 yr
Small av 250-300kg
$2.10 Med av 301-360kg $2.00 Heavy av 360kg + $2.00
Friesian Steers to 1 yr
Small av 120kg $2.00 Med av 121- 180kg $2.00
Heavy av 181kg + $2.00
Rising 2 yr
Friesian Steers Small av 200-300kg $1.70 Med av 301-360kg $1.70 Heavy av 360kg + $1.70 Hereford cross
to 1yr
Small av - 120kg $2.50
Med av 121- 180kg $2.50
Heavy av 181kg + $2.50
Hereford cross
to 2yr+ Small av 200 - 300kg $2.20 Med av 301- 360kg $2.20 Heavy av 360kg + $2.00
No TB reactor compensation will be paid when:
A farmer wishes to slaughter cattle which have been positive to an approved TB test and the animals are awaiting a retest, as directed by an inspector or authorised person;
An owner wishes to retain the meat from a TB reactor for home consumption; The owner has not complied with a legal directive to slaughter a TB reactor; Pathological evidence of TB is detected in non-reactor cattle at slaughter.
1.5
DAIRY PRODUCE 1.5.1 Price paid for Milksolids (i) Background.Up until the end of the 2000/2001 season, dairy farmers received payment from the New Zealand Dairy Board through a system of advance and final payouts via dairy companies. Seasonal supply dairy companies passed on the Dairy Board advance rate to their suppliers in addition to a margin based on dairy company efficiency, product mix and investment policies; together known as the total payout.
The introduction of the Dairy Industry Restructuring Act 2001 opened the way for New Zealand’s largest dairy companies, Kiwi Co-operative Dairies Ltd (Kiwi) and The New Zealand Co-operative Dairy Company Ltd (NZDG) to merge to form Fonterra Co-operative Group Ltd, and for the Dairy Board to become a company and a wholly-owned subsidiary of Fonterra. Further, the Act provided for the buy-out of shares in the Dairy Board held by three smaller dairy companies, The Tatua Co-operative Dairy Company Ltd, Westland Co-operative Dairy Co Limited and New Zealand’s Premier Dairy Cooperative Limited. Also it regulated the activities of Fonterra which has facilitated the emergence of other companies such as Open Country Cheese, NZ Dairies, Synlait, Open Country Dairy and starting in the 2011/12 season, Miraka in the central North Island.
Fonterra remains a co-operative, 100% owned and controlled by its shareholder suppliers. The payments that Fonterra suppliers receive comprise a Milk Price (the price paid for raw milk supplied) and a Dividend (the amount of distributable profit actually paid to farmer shareholders in respect of any financial year).
To support suppliers’ seasonal cash flows, Fonterra advances a proportion of the forecast Milk Price for milk supplied each month. Typically these advance rates increase throughout the season as full year returns become more certain, culminating with a final payout in October for the season which finished on 31 May the same year.
(ii) Payments for Milksolids Supplied.
Fonterra’s payments for milk (and advance rates) expressed in $ per kg of milksolids, represents the total money to be distributed to shareholders for the milksolids they supply the Co-operative when averaged over the total kg of milksolids supplied. This is not the actual amount paid for milk to individual shareholders, as actual payments are based on the composition of their individual raw milk.
Standard payments for milk are calculated by the formula (a + b) + or - c where:
a = cents per kg of the milkfat component contained in the milk (subject to Company grading).
b = cents per kg of the protein component contained in the milk (subject to Company grading).
Payments for Fat and Protein (a + b)
The splitting of the Milk Price into separate payment rates for fat and protein is dependent on two key parameters:
The Valued Component Ratio (VCR) is the ratio of the value of milkfat compared with the value of protein. It reflects the relative returns achieved by Fonterra from milkfat and protein products sold in all markets.
This is set at the beginning of each season with the ratio for 2011/2012 being 0.49. This means that the payment for a kg of fat is 0.49 (or 49%) of the payment made per kg of protein. The ratio between the fat and protein payment rates is held constant throughout the season (including the final payment) regardless of the advance rate paid.
The Component Composition Ratio (CCR) is the ratio of the total amount of protein supplied to the company in the season versus the total amount of milkfat.
For the 2011/2012 season this has been estimated as 0.7579. This means that for every kg of fat supplied, the company is expecting to receive 0.7579 kg of protein. This ratio is updated with the actual ratio at the end of the season when the figure is known. If the actual figure at the end of the season is greater than the initial estimate then the final fat and protein payment rates are both reduced so that on average the company still pays the announced payout.
This has to occur because the company would be paying out on a greater quantity of protein than originally estimated, and because protein is paid for at a higher rate, the company would end up paying out more money than it actually has available to distribute. Conversely, if the actual composition ratio is less than the initial estimate, the final fat and protein rates are both increased so that, on average, the company still pays the announced payout.
Volume Adjustment (+ or - c)
Capacity Adjustment
Further to the (a + b) +/-c formula, a capacity adjustment is also applied to the milk payment (this is effectively a +/-d pricing mechanism). The purpose of the capacity adjustment is to recognise that some suppliers who produce a greater than average volume of milk during the peak of the season relative to the rest of the season require a greater than average quantity of capital assets to process their milk (for example, processing plants and other capital investment such as tankers). Like the volume adjustment, the capacity adjustment is a zero sum calculation across Fonterra. The chart below illustrates how the capacity adjustment is rationalised.
Fundamentally, there are two components of the Capacity Adjustment, the Capacity Charge and the Capacity Payment. The Capacity Charge is negative and the Capacity Payment is positive. The difference between the two will result in either a payment by a farmer or a payment to a farmer.
The capacity adjustment has several important factors applied in its calculation;
Capacity Payment Rate: This is the ratio of milk supplied on shareholders peak days to total production, multiplied by the Capacity Charge Rate (for the 2011/12 season this is estimated to be $0.317).
Capacity Charge Rate: This is the amortised cost to Fonterra of installing an additional litre of processing capacity (this has been set at -$5.40 for the 2011/12 season).
Peak Day: The day in the season with the highest collection volume.
Peak Period: Shown on the chart as the 30 days before and 40 days after Fonterra’s peak day (this is a 71 day period including the actual peak day).
Standardisation Adjustment for volume and milksolids: Recognition that the capital costs associated with processing peak milk are affected by both milk volume and milk solids at 32.5% and 67.5% respectively. These percentages are used to calculate the PSL as shown below.
PSL = 0.675 x Farm’s Peak Period Composition + 0.325 Company’s Peak Period Composition
For the 2011/12 Season the Capacity Adjustment is calculated as follows;
Capacity Charge = PSL x Capacity Charge Rate
Capacity Payment = Season kgMS x Capacity Payment Rate
Calculation of Payout Split
Protein payment rate = (1+CCR) x Advance Rate (VCR + CCR)
Milkfat payment rate = (1+CCR) x Advance rate (1/VCR x CCR + 1)
Where: CCR = Component Composition Ratio (company protein to milkfat ratio) VCR = Valued Component Ratio (fat to protein value ratio)
Example
Protein payment rate = (1+0.7579) x 4.40 (0.49 + 0.7579)
= 6.1982 $/kg = 619.82 c/kg Milk fat payment rate = (1+0.7579) x 4.40
(1/0.49 x 0.7579 +1)
= 3.0371 $/kg = 303.71 c/kg
Component Quantity Rate (cents) Total $
Protein 4,317.1kg 619.82 / kg 26,758.34
Milkfat 6,322.6 kg 303.71 / kg 19,202.55
Volume Adjustment 113,298 litres ([9.39-8.73] / 8.73) * 2.78
= 0.2102 / litre 238.15
Total paid to supplier $46,199.04
Total paid per kg ms: $4.34 Company Advance Rate: $4.40
In the above example, a positive Volume Adjustment is paid because the farm’s average milksolids percentage is greater than the company’s average milksolids percentage. However, the total paid per kg of milksolids is less than the company advance rate. This is because the farm’s protein to fat ratio is less than the company’s average (i.e. less protein has been produced per kg of milkfat compared to the company). The company’s average milksolids percentage and protein to milkfat ratio are estimated at the beginning of the season and replaced with actual numbers at the end of the season. This impacts the split of the final payment into separate rates for milkfat and protein, and total volume adjustment paid for the season.
(iii) 2011/2012 Forecast Payments.
The Fonterra advance rates for the 2011/2012 season, as at May 2012, were as follows: Payment Month $ per milk solid equivalent
July 2011 $4.40
August $4.40
September $4.40
October $4.40
November $4.40
December $4.40
January 2012 $4.55
February $4.65
March $4.75
April $4.90
May $5.05
June $5.20
July $5.35
August $5.50
September $5.75
October $6.05
(iii) Dividend
which (the interim dividend) is paid on shares held on March 31st and paid on April 20th. The second instalment (the final dividend) is paid on shares held on May 31st and paid on October 20th. In normal circumstances the Board will target an interim dividend (to be paid in April) of around 30 per cent of the then forecast full-year dividend, with the residual as a final dividend (to be paid in October).
On 3 December 2009 the Fonterra Board announced a dividend policy. From 2010/2011, Fonterra targets a dividend payment ratio of 65-75 per cent of Distributable Profit, meaning 25-35 per cent of Distributable Profit would be retained to be reinvested in the business. The Board will have full discretion on the dividend level in any year, taking into account the level of payments made to date against the forecast Milk Price and the market conditions which Fonterra and farmers face.
For the 2011/2012 year the Fonterra Board is forecasting a Distributable Profit of between 40-50 cents per share, including non-recurring items. The Board is targeting a Dividend of 26-38 cents per share.
Milksolids Price Trends
(i) Milksolids in wholemilk for manufacture (cents per kg).
93/94 94/95 95/96 96/97 97/98 98/99 NZDB-Final 290.00 300.00 360.00 318.00 300.00 325.00 Company margin 41.72 39.85 39.43 44.88 41.65 32.95 NZ weighted average 331.72 339.85 399.43 362.88 341.65 357.95
99/00 00/01
NZDB-Final 335.00 460.00
Company margin 43.00 41.00 NZ weighted average 378.00 501.00
01/02* 02/03 03/04 04/05 05/06 06/07 Milk Price ($/kg MS) 5.06 3.16 3.77 4.37 3.85 3.87
Value Return 0.22 0.47 0.48 0.22 0.25 0.59
Payout ($/kgMS) 5.33 3.63 4.25 4.59 4.10 4.46
07/08** 08/09** 09/10*** 10/11**** 11/12fc Milk Price ($/kg MS) 7.59 4.72 5.70 7.60 6.05 Value Return/Dividend 0.07 0.48 0.27 0.30 0.26-0.38 Milk Price + Value
Return/Dividend
7.66 5.20 6.37 7.90 6.31-6.43
* Final payout for 2001/02 included payment from reserves of $0.05
** Final payout for the 2007/08 and 2008/09 seasons is post retentions of $0.24 and $0.01. *** Final payout for the 2009/10 season post retentions of $0.33.
scheme is to ensure that supplying shareholders are held responsible for milk quality and incur milk payment deductions for downgrade milk supplied.
The company can reject milk that does not meet certain standards.
The Company can impose a maximum of 12 demerit points on a supplying shareholder in any one collection day except where inhibitory substances are involved, reject milk is supplied, or in the first ten days of a season where there is a maximum of 20 demerits per collection day.
Generally, one demerit point means a 5% deduction from payments made from milk collected on that day. The demerit deductions are based on 100% of the opening Milk Price forecast for the season.
Fonterra carries out a number of Raw Milk Quality Tests. For details refer to the Fonterra Suppliers Handbook, Section 4 and Table 1.
Premium Rates for Contract Winter Milk
The vast majority of winter milk contractors have standard Fonterra contracts, committing to supply of a daily quantity (kilograms milksolids per day) from 1 May to 31 July in the North Island and 16 May until 15 August in the South Island. Suppliers are paid a premium for this winter milk, but are liable to pay damages to Fonterra for any shortfall in supply compared to their contract volume.
This payment is based on a factory price minus a transport differential which depends on the supplier’s location in relation to their accepting factory.
There are tighter milk quality requirements for winter contract milk due to the nature of markets for this milk.
Regional Premiums - winter 2012
Region cents/kg milksolids
Takanini (Waikato North) 140
Longburn (Lower North Island) 155 Christchurch (Central South Island) 380 Cadbury (Lower South Island) 380
In 2007 Fonterra introduced Winter Premium Milk. This refers to milk supplied between June 1 and July 15, which is not supplied under Winter Contract or any other specialty milk contracts. Winter Premium Milk has been designed to provide additional flexibility to suppliers to respond to the higher value Fonterra receives for milk collected during this period. Currently, this payment is 75 cents per kilogram of milksolids over and above standard payout, however this price is subject to seasonal variation.
Specialty Milks
Further premiums are available for suppliers of Organic, Colostrum and Stolle milk. These specialty milks all have varying pricing mechanisms.
(ii) Average Payouts since 1984 in actual Dollars and in "Real" Dollars
(based on the value of the dollar in December 2011 and adjusted for inflation). Figures are in $ per kg milksolids.
Note the 2011/12 figure is a forecast payout by Fonterra.
Sources: New Zealand Dairy Board (data through to 2001), Lincoln University
Sire Proving Scheme Rebates
Livestock Improvement Corporation contract 150-160 farmers each year as members of the Sire Proving Scheme. Members are located throughout the country and represent a cross-section of New Zealand's dairy industry. Each member signs a contract that spans four seasons, covering the member’s responsibilities, including; mating 90% of their herd to LIC's current sire proving team, rearing the resulting heifer calves to first lactation as two year olds, keeping accurate herd records, herd testing four times, drafting heifers for weighing and Traits Other than Production (TOP) inspection. Where the contract has been completed successfully, LIC pay the member a rebate for each qualifying heifer.
Rebate payments per qualifying heifer SPS Contract Year
2009 2010 2011 2012
Self-Sample Herd Test $52 $52 $52 $62
Herd Test Assist Provided $62 $62 $62 $62
0 1 2 3 4 5 6 7 8 9 10
$ / kg
1.5.2 Dairy Cattle Sales (2011)
Actual prices for Winter / Spring 2011 and estimates for 2012 for dairy cattle for six regions.
Waikato
Class Winter/Spring 2011 Autumn 2012
MA Cows 110-120 BW Friesian $2,300/$2,400 $2,250
Cross Bred $2,300/$2,400 $2,250
Jersey $2,200/$2,250 $2,100
MA Cows 60-90 BW Friesian $1,850 $1,900
Cross Bred $1,800 $1,850
Jersey $1,700 $1,700
Rsg 2yr heifers Friesian $1,850 $1,900
Cross Bred $1,850 $1,850
Jersey $1,700 $1,700
Rsg 1yr heifers Friesian $1,800/$2,000 $1,800
Cross Bred $1,200 $1,200
Jersey $1,050 $1,050
Note: Prices include a sales commission of approximately 7%. BW = breeding worth Autumn prices assume a 1st June delivery. The high Rising 1 yr price is driven by the strong export market. Quality cows are attracting a premium.
Bay of Plenty
Winter/Spring
Class 2009 2010 2011 2012 est
MA cows Friesian $1000 to $2600 $1200 to $1600 $1800 to $2300 $1600 to $1900 Jersey $1000 to $1800 $1100 to $1500 $1700 to $2100 $1500 to $1900 Rsg 2yr
heifers Friesian $650 to $1600 $1000 to $1450 $1650 to $1900 $1500 to $1800 Jersey $450 to $1350 $1000 to $1400 $1400 to $1850 $1300 to $1750 Rsg 1yr
heifers Friesian $550 to $900 $600 to $900 $1100 to $1900 $1100 to $1900 Jersey $450 to $650 $450 to $650 $650 to $850 $550 to $750 Taranaki
Winter/Spring
Class 2010 2011 2012 est
MA cows Friesian $1,500 to $1,700 $2,100 $2,300 to $2,500 Jersey $,400 to $1,500 $1,600 $1,900 to $2,000 Rsg 2yr
heifers Friesian $1,500 $1,500 $1,800
Jersey $1,100 $1,200 $1,400
Rsg 1yr
heifers Friesian $600 $800 $1,700*
Jersey $400 $400 $700
4 day hfr
calves Friesian $100 $100 $250
Manawatu/Wairarapa
Winter/Spring
Class 2010 2011 2012 est
MA cows Friesian $1,400 to $1,800 $1,400 to $1,800 $1,700 to $2,350 Jersey $1,200 to $1,600 $1,200 to $1,600 $1,500 to $2,000 Rsg 2yr heifers Friesian $1,150 to $1,350 $1,150 to $1,450 $1,400 to $1,800 Jersey $1,000 to $1,250 $1,000 to $1,300 $1,200 to $1,700 Rsg 1yr heifers Friesian $600 to $700 $700 to $1,450 $900 to $1,750 Jersey $450 to $550 $500 to $700 $600 to $900
Heifer calves $250 to $350 $150 to $400 $150 to $400
Canterbury
Winter/Spring
Class 2010 2011 2012est
MA cows Friesian $1,300 to $1,600 $1,800 to $2,600 $1,700 to $2,400 Jersey $1,200 to $1,500 $1,650 to $2,400 $1,500 to $2,200 Rsg 2yr heifers Friesian $1,000 to $1,400 $1,500 to $2,150 $1,400 to $2,000 Jersey $900 to $1,300 $1,350 to $1,800 $1,300 to $1,650 Rsg 1yr heifers Friesian $500 to $750 $700 to $1,000 $700 to $1,000 Jersey $400 to $650 $600 to $750 $600 to $750 Heifer calves - per BW $0.70 to $1.00 $1.00 to $1.20 $1.00 to $1.20 BW = breeding worth
Southland
Winter/Spring
Class 2010 2011 2012 est
MA cows Friesian $1,400 to $2,100 $1,800 to $2,500 $1,700 to $2,350 Jersey $1,400 to $2,100 $1,650 to $2,400 $1,550 to $2,200 Rsg 2yr heifers Friesian $1,200 to $1,600 $1,500 to $2,100 $1,400 to $1,900 Jersey $1,200 to $1,600 $1,350 to $1,800 $1,250 to $1,650 Rsg 1yr heifers Friesian $500 to $700 $700 to $1,000 $700 to $1,000 Jersey $500 to $700 $600 to $750 $600 to $750
1.5.3 Dairy and Dairy-Cross Calves (Refer also to Sections1.4.5 and 1.5.7).
(i) Calves sold for rearing (Spring 2011): Canterbury
Friesian bull calves sold for rearing
2005 from $70.00 to $120.00
2006 $100.00
Bay of Plenty
2011 2012 est
4 day Friesian bulls $50 $75
4 day Friesian heifers rec $400 $550 4 day Friesian heifers unrec $75 $100
(ii) Bobby Calves sold at Tuakau 2010/2011
2010 2011
Min/head Max/head Min/head Max/head
January $35 $270 $10 $230
February $9 $290 $30 $255
March $5 $272 $5 $270
April $5 $292 $5 $260
May $5 $380 $5 $290
June $5 $230 $10 $345
July $5 $270 $5 $300
August $5 $210 $10 $320
September $5 $175 $5 $235
October $6 $198 $10 $210
November $10 $205 $15 $270
December $10 $220 $25 $290
Source: www.interest.co.nz/rural
(iii) Heifers sold for Live Export:
Over the last two years the live export heifer market has been focussed on sales into China and the Asian markets. There have been no sales into the Mexican / Central Americas markets.
The shipments over this period have been in the vicinity of 30,000 head per annum and the demand has been greater than what could be supplied assuming suitable shipping had been available.
For the forthcoming 2013 year the demand from China is expected to continue, however it should be noted that the due to the global economic downturn, there may be signs of some buyer resistance. The preference is for Rising 1 year, unmated cattle. The cattle need to be F12 to F16 and have full ancestry records.
The demand through 2012 has resulted in prices up to $300 above the domestic market subject to the quality of the heifer and the protocol testing requirements.
The farm-gate prices throughout the 2012 year have ranged from $1,600 to $1,900 for 12 to 15mth F12-F16 Holstein Friesian Heifers. Indications for the 2013 year are that the demand will remain strong, but the pricing will possibly reduce to levels more closely aligned to the domestic market. However this is fully dependent on both the foreign exchange position and changes to the world-wide commodity prices for milk products.
(iv) Bobby Calf Price at Farm Gate:
Blue Sky Meats Ltd – Prices are cents per kg hot carcass weight Weight Range (kg) 2009 2010 2011
up to 7.0kg - nil 100
7.5 – 13.5 80 - -
7.1 - 13.5 - 102 -
7.0 - 13.5 - - 152
13.6 – 19.0 118 140 200
19.1 – 22.9 128 147 234
23.0 – 26.9 145 - -
23.0 - 33.0 - 156 252
27 kg and over $39.15/head - -
Depending on market changes schedule may be subject to review.
Cartage is the only deduction - $5 per head for 2010 and $4.50 per head for 2011.
1.5.4 Dairy Beef Weaners Refer also to Section 1.4.6
Canterbury
100kg Friesian bull calves
November 2005 $300.00 to $340.00
2007 $280.00 to $330.00
2008 $300.00 to $340.00
2009 $280.00 to $320.00
2010 $270.00 to $300.00
2011 $280.00 to $310.00
Southland
2010 2011 2012
Weaner Friesian bulls $280 to $320 $300 to $340 $300 to $350 Weaner Beef cross bulls (100kg) $350 to $380 $360 to $400 $360 to $400 Weaner Beef cross heifers (100kg) $300 to $320 $320 to $350 $320 to $350
1.5.5 Cow Beef
Refer to Section 1.4.3 for Silver Fern Farms supply options
1.6
DEER PRODUCTION 1.6.1 Venison Schedule (Export)The venison schedule works in the same way as for sheep (refer to Section 1.2.1). Below is a schedule of gross prices for a week in April 2012 from a meat company. Charges and levies have not been deducted.
Weight (kg) AP Price $/kg
35.1 – 45.0 5.80
45.1 – 85.0 7.10
85.1 to 100.0 5.90
100.1 & over 5.70
Deductions
Hinds minus $0.10 AF grades minus $1.25
AFH grade minus $0.95 off 100.1 and over PD grade minus $1.40
1.6.2 Venison Supply Options
Silver Fern™ Farms' Backbone® programme
Farmer suppliers have the option of supplying under: - Committed supplier programme
- Integrated value chain programme Committed supplier premiums:
Stock class Premium Grades Weights Criteria
Venison $0.05/kg AP2 – AP5 45.1 – 85kg A and B presentation
BackboneTM integrated value chain programme options:
Venison BackboneTM partnership club Operates for total of 12 months split into: 1. Peak season Dec-May
2. Winter season June-Nov 45.1 – 85kg, AP grades only
A & B presentation Max age 3yrs
See section 1.2.4 for Performance Premium Pools
1.6.3 Venison Price Trends
(i) Average Schedule Price 60 kg AP Stag. Prices are $ per kg
Year Jan Feb Mar Apr May Jun Jul Aug Sep Oct Nov Dec 2012 7.98 7.38 7.14 7.07
(ii) Venison Schedule prices 2000 to 2012 Prices are $ per kg
2000-01 2001-02 2002-03 2003-04 2004-05 2005-06 2006-07 2007-08 2008-09 2009-10 2010-11 2011-12 $8.12 $6.87 $4.56 $4.34 $4.19 $4.21 $5.19 $7.19 $8.67 $7.17 $7.92 $8.02 Note: The figures are based on the average weekly schedule for the year ending September.
Source: Deer Industry New Zealand
(iii) Average Schedule Price for AP Grade (60 kg stag) 1988 to December 2011.
0 100 200 300 400 500 600
1988 1990 1992 1994 1996 1998 2000 2002 2004 2006 2008 2010
$/He
ad
Source: Lincoln University, "N.Z. Farmer" to April 2001, The Deer Farmer, Straight Furrow.
(iv) Average Schedule Price for AP Grade (45kg / 50kg hind) 1991 to December 2011.
0 100 200 300 400 500 600
1.6.4 Deer Live Sales
Livestock prices vary markedly throughout the year and between districts.
Apart from breeding stags, prices will be very dependent on feed availability, freezing works capacity and schedules. Adult hinds 2 year upwards are quoted as being pregnancy tested – in fawn. Livestock prices for each season from 2007 to 2011 are shown below.
Red Deer
$/head
2007 2008 2009 2010 2011
Weaner hinds 100 to 120 140 to 160 180 to 200 200+ 250+ Rising 2yr hinds 250 to 300 400 to 450 500 to 550 500 to 550 500 to 550 Mixed age hinds 280 to 350 475 to 500 540 to 580 500 to 550 525 to 575
CFA hinds* 230 350 450 450 475
Weaner stags 130 to 180 180 to 220 220 to 280 235 to 275 250 to 300
Rising 2yr stags 300 to 350 450+ 600+ 500+ 600+
MA velveting stags 350 to 450 500+ 700+ 700+ 800+
Breeding stags 2,500 2,700 3,000 3,000 3,000
*cast for age
Weaner red deer can also be purchased on a per kilogram live weight basis. $/kg live weight
2007 2008 2009 2010 2011
Weaner hinds 2.00 to 2.20 2.80 to 3.00 3.80 to 4.00 4+ 4.25 to 4.50 Weaner stags 2.50 to 2.75 3.80 to 4.00 4.30 to 4.50 4.30+ 4.50 to 5.00
Wapiti and Wapiti cross
$/head
2007 2008 2009 2010 2011
Weaner hinds 150 200 150 250+ 270+
Rsg 2yr hinds 320 500 320 550+ 575+
MA hinds 460 550 460 575+ 600+
Weaner stags 180 to 200 225 to 250 275 to 300 275+ 300+
Rsg 2yr stags 400 550 650+ 650+ 700+
MA velveting stags 450+ 650 800+ 800+ 900+
Breeding stags 2,500 2,500 2,750 3000 3000
Source: PGG Wrightson.
1.6.5 Velvet
(i) Velvet Average Weighted Pool Prices by Grade ($ per kg) Pools discontinued 2011
2006/07 2007/08 2008/09
Super A 107 to 127 84 to 107 69 to 81
A 1 and 2 106 to 122 77 to 88 63 to 72
B 1 and 2 101 to 120 72 to 85 56 to 64
C 1 and 2 99 to 107 69 to 77 52 to 61
Spiker (1 - 3) 76 to 111 70 to 96 57 to 85
Regrowth 80 to 117 61 to 103 43 to 86
Overgrown 55 to 88 45 to 74 43 to 56
Damaged 78 to 105 56 to 73 44 to 61
These figures represent a range of prices paid over the November to January period in each season. Prices are net of GIB/DINZ Levy, handling/grading charges and commission.
Source: Deer Industry New Zealand
(ii) Seasonal Average Prices for Red Grade Velvet
2007/08 2008/09 2009/10 2010/11
Average Weighted Pool Prices ($ per kg)
Super A 94.58 73.45 110.24 107.49
A 81.55 66.15 106.42 105.42
B 76.67 59.40 100.13 100.97
C 73.13 56.47 95.16 99.91
D 75.80 46.91 83.80 89.69
Taiwan 75.32 47.58 110.58 110.03
Spiker 79.17 72.75 98.14 105.02
Damaged 64.05 51.58 91.54 91.17
Manufacturing 52.87 47.29 69.68 81.69
Regrowth 84.09 65.84 83.43 86.27
Source: Deer Industry NZ
(iii) Wapiti Velvet Prices 2007/08 to 2010/11
The following prices ($ per kg) are from the South Island sales.
2007/08 2008/09 2009/10 2010/11
Supreme 131.60 91.08 130.00 109.27
EW1 - long 94.75 71.69 N/A 97.65
- medium 105.00 71.12 N/A 97.65
- short 109.45 81.05 120.00 107.65
EW2 - long 107.00 72.50 105.98 97.65
- medium 110.00 73.00 106.00 98.08
- short 90.17 74.37 N/A 107.65
EW3 - long 98.01 71.50 105.00 96.72
- medium 98.25 71.50 105.00 97.19
- short 103.30 69.50 111.65 107.65
EW overgrown 84 to 110 49.00 to 73.00 71.00 84.00
Source: Deer Industry NZ.
1.6.6 T.B. Compensation
1.7
GOAT PRODUCTION1.7.1 Introduction
Production from goats is divided into three categories: Meat (chevon), milk and fibre. In conjunction with these, goats can be employed for weed control.
1.7.2 Goat Meat Prices (Chevon)
Schedule Prices - these prices are net of all charges, and are a guide only, subject to change. All prices are for December 2011.
Hellabys: 8/11/11
Weight Range $ per kg
0 – 5 kg 0.00
5.1 – 7 kg 3.85
7.1 – 20 kg 4.30
20.1 – 22 kg 2.90
22.1 – 25 kg 1.40
25kg and over 1.00
Taylor Preston / C R Grace Ltd.: As at 03/12/11
Grade Weight range (kg) Cents per kg
GA Under 4.0 0
GL1 4.0 to 6.0 230
GL2 6.1 to 8.0 380
GM1 8.1 to 13.0 430
GM2 13.1 to 16.0 430
GX1 16.1 to 18.0 430
GH1 18.1 to 21.0 355
GHH1 21.1 to 23.0 280
GHHH 23.1 and over 280
Defectsall weights - NIL. Meat NZ Levy 55c per head, MAF Inspection fee $1.80 per head. Condemned charge $9.90 per head. Payment of up to $4.00 per head towards cartage.
Crusader Meats NZ Ltd: 8/12/11
Grade Description Weight $ per head
GL Very Light 0 to 4 kg 0.00
GL Very Light 4.1 to 6 kg 2.25
GL Light 6.1 to 9 kg 3.60
GM Medium 9.1 to 13 kg 4.20
GH Heavy 13.1 to 18.9 kg 4.20
GV Very Heavy 18.9 to 99.9 2.45
CL Cutter Very Light 0 to 4 kg 0.00
CL Cutter Very Light 4.1 to 6 kg 1.70
CL Cutter Light 6.1 to 9 kg 1.70
CM Cutter Medium 9.1 to 13 kg 1.70
paid at Cutter rates. Levies to be deducted per head (unless stated): MAF Inspection - $1.79. C.Ovis - $0.015. TOTAL = $1.805
Ovation New Zealand Ltd
Weight kg Grade Nett $ per kg
Under 6 kg Nil
6 to 8.9 GL 3.50
9 to 11.9 GM1 3.60
12 to 14.9 GM2 3.90
15 to 17.9 GH 4.10
18.0 plus GHH 3.70
Cutter up p 11.9 GC1 1.90
Cutter 12 plus GC2 2.15
Prices paid before levies. There is no payment for less than 6kg. Goats must measure at least 600mm from base of neck to base of tail.
Silver Fern Farms:
North Is Goat Meat Schedule 3/04/11
4.0 to 11.0 kg GL $2.70/kg
11.1 to 18.0 kg GM $3.70/kg
18.1 + GH $1.80/kg
South Is Schedule 7/03/11
Weight kg Grade Cents per kg
Under 4 kg GA Nil
4.0 to 11.0 GL 370
11.1 to 18.0 GM 370
18.1 and over GH 270
4.0 to 11.0 GPL 50
11.1 to 18.0 GPM 50
18.1 and over GPH 50
1.7.3 Meat Prices Trends Prices are $ / head.
2006/07 Avg 2007/08 2008/09 15.0 kg carcase weight 42.86 44.66 41.85 to 44.66
Source: Straight Furrow 2008, 2009. No goat prices available in 2010 and 2011.
1.7.4 Goat Milk