www.ijres.org Volume 5 Issue 12 ǁ December. 2017 ǁ PP. 01-07
A New Formation Dip Correction Method for Electrical Imaging
Logging
*Yuan Tong
1,Wang Jiabin
2,Zhu Shuwen
2,Chen Yingying
2 2,
1 (School of Electric and Electrical Engineering,Shanghai University of Engineering Science,China) Corresponding Author: *Yuan Tong
*Graduate research and innovation projects funded of Shanghai University of Engineering Science(E3-0903-17-01043)
ABSTRACT:
Because of the small investigation radius of electrical imaging logging method, it can reflect strata information around the wellbore and extract formation dip. However, in the inclination angle calculation, the well diameter or a fixed electrical diameter correction to compensate is used, resulting in large calculation result. In this paper, the relationship between the electrical diameter correction and the formation resistivity is established by studying the effect of such factors as borehole mud, wall rock contrast with formation and formation dip on the electrical diameter correction. In practical application, the amount of correction based on the resistivity information of different measuring points is used to compensate the well diameter to get more accurate formation dip.The results of the ideal model test and the actual data processing show that the proposed method further improves the accuracy of the calculation of formation dip and can provide reliable information of stratum for the geological explanation with the electrical imaging data.Keywords:
electrical imaging logging; formation dip correction;electrical diameter;formation resistivity---Date of Submission: 04-12-2017 Date of acceptance: 16-12-2017
---I.
INTRODUCTION
Micro-resistivity scanning imaging logging technology was developed in the 1980s, using array-type high-density button electrode probe to obtain a large number of electrical information of the formation near the borehole wall to obtain high resolution, high borehole coverage and high definition Borehole imaging maps, which can be obtained underground lithology, formation formation and cracks and other geological information[12].
The depth of electrical imaging logging tool is shallow in the radial direction, and the measured information mainly reflects the electrical information of the formation near the borehole wall. This feature determines the imaging instrument is particularly conducive to the calculation of the formation dip. The geological interpreter can obtain the downhole information stratigraphic sedimentation and tectonic conditions, and then to carry out the evaluation of the geological structure of the reservoir. In the commonly used imaging data processing software, most of the calculation of formation dip is directly compensated by the measured caliper information or by using a fixed electrical diameter correction value. Foreign studies have shown that the direct use of well diameter value will lead to the calculated value of tilt is too large[34] , while Caliper correction needs to consider the instrument's own detection characteristics and measurement of environmental factors.
In order to solve the above problems, this paper uses finite element numerical algorithm for numerical simulation of electrical imaging instruments, and proposes a new algorithm of electrical diameter correction, examines the contrast of different formations and drilling fluids and the correction of electrical diameter in different inclination conditions Influence, and draw the electric diameter correction and formation resistivity relationship list. The results of the ideal formation model test and actual well data processing show that the method proposed in this paper can further improve the accuracy of stratum dip and provide a reliable basis for geologic application such as fine sedimentary and tectonic analysis of imaging data.
II.
THE WORKING PRINCIPLE OF ELECTRICAL IMAGING EQUIPMENT
independent push arm system connected with the main body of the instrument to ensure that each plate and Well wall close to obtain reliable measurement of borehole information. During measurement, the instrument collects a large amount of formation information along the longitudinal, radial and circumferential directions of the borehole wall. The information is transmitted to the ground to process the system. After the relevant image processing technology is obtained, a 2D imaging map of the borehole wall or a sounding depth near the borehole wall Range of three-dimensional images.
At present, the working principle of the mainstream electrical photographic apparatus at home and abroad[67] is shown in Figure 2.1. When measuring, the button electrode and the shell of the electrode plate and the surrounding shielding electrode keep the same potential while keeping the potential difference between the button transmitting electrode and the remote loop electrode constant. The instrument body also has a section of insulation short section, used to separate the emitter electrode and the return electrode. The button measures the current perpendicular to the button electrode and emits electrical current through the drilling fluid, mud cake, intrusion zone, and intact formation and eventually to the return electrode. This current therefore contains electrical information about the formation near the borehole wall.
Figure 2.1Working principle of electric imaging instrument
III. A NEW METHOD OF FORMATION DIP CORRECTION IN ELECTRICAL IMAGING
LOGGING
3. 1 The extraction of stratum dip
Using six electrical buckling curves synthesized on different plates to extract the dip angle, the corresponding algorithm is used to obtain the corresponding response points of the six electrical buckling curves in the same formation, and the corresponding elevation difference can be obtained, that is, 6 points. A two-dimensional plan developed by intersecting the borehole wall with the inclined formation shows a single-period sinusoid (Figure 3.1), which can be expressed as[8]
0
)
(
s
in
x
y
A
y
(1)In formula (1),
y
represents the depth of the measuring point;A
represents the Sinusoidal amplitude ;
represents the sinusoidal angular frequency;x
represents the phase of the measuring point;
represents the initial phase;y
0represents sinusoidal baseline position. The period of the curveT
isthe image pixel width, so
T
2
Figure 3.1 2D plan of inclined strata
The formula (1) and the differential product formula can be converted
)
cos(
sin
)
sin(
cos
0
A
x
A
x
y
y
(2)We define
y
s
(
x
),
a
0
y
0,
0(
x
)
1
,
a
1
A
cos
,
1(
x
)
sin(
x
),
),
cos(
)
(
,
sin
22
A
x
x
a
so we have)
(
)
(
)
(
)
(
x
a
0 0x
a
1 1x
a
2 2x
s
(3)Using the least square fitting method, the matrix equation can be expressed as
)
,
(
)
,
(
)
,
(
)
,
(
)
,
(
)
,
(
)
,
(
)
,
(
)
,
(
)
,
(
)
,
(
)
,
(
2 1 0 2 1 0 2 2 1 2 0 2 2 1 1 1 0 1 2 0 1 0 0 0
y
y
y
a
a
a
(4)
We have
a
0,
a
1,
a
2 from Solving the system of linear equations , then the three unknown coefficientsof the sinusoidal equation can be described by
cos
/
)
/
arctan(
1 1 2 0 0a
A
a
a
a
y
(5)
The three unknown coefficients of the sinusoid require 3 known points to be solved, and a more accurate curve equation can be obtained using 6 point fitting above the formation. Used
D
h to indicate borehole diameter, the formation dip is calculated ash
D
A
2
arctan
(6)
3.2 Electric diameter correction
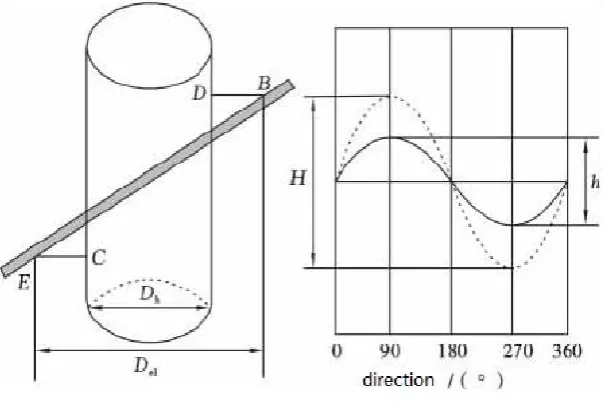
Different application requirements in resistivity logging also have different requirements on logging performance of logging tools. If it is necessary to identify the formation resistivity information, it is required that the device has a deeper detection depth. If the formation dip is to be calculated, the instrument is required to have a shallow depth of investigation because the shallow depth of investigation makes it easier to identify the intersection of the inclined layer and the borehole wall. As can be seen from Figure 3.1, it is more convenient to define the depth of investigation using the electrical diameter of the electrical imaging tool (the radial distance between points E and B in Figure 3.1), and the true depth of the instrument will vary with the borehole and formation environment The commonly used instrument detection depth is a fixed value obtained in an ideal formation environment. Therefore, it is more reasonable to define the instrument radial detection depth by using the electrical diameter.
Precise calculations of dip should use the electrical diameter instead of the borehole diameter. Because the electrical imaging instrument has a certain depth of detection and the electrical diameter is always larger than the borehole diameter, the calculation using formula (6) will inevitably lead to overestimation of the dip of the formation. As shown in Figure 3.2, the solid curve represents the intersection of the actual inclined formation and the borehole wall, and the sinusoidal curve represented by the dotted line represents the actual inclined layer recognized by the instrument. It can be seen that the actually recognized gradient height difference
H
is greater than the true formation height differenceh
, so the dip calculation of electrical imaging data must be caliper corrected[910].Let
D
el be the amount of electrical diameter correction, the electrical diameter can be defined as elh
D
D
D
(7)From the above analysis we can see that the corrected formation dip is calculated as
D
A
2
arctan
(8)3. 3 Electric diameter correction amount acquisition
For electrical photographic instruments, the magnitude of the electrical diameter correction is related to the thickness of the target layer, the inclination of the formation and the contrast between the target layer and the surrounding rock. In this paper, the relationship between the electrical diameter correction
D
el and the logarithm of the formation resistivitylg(Rt
)
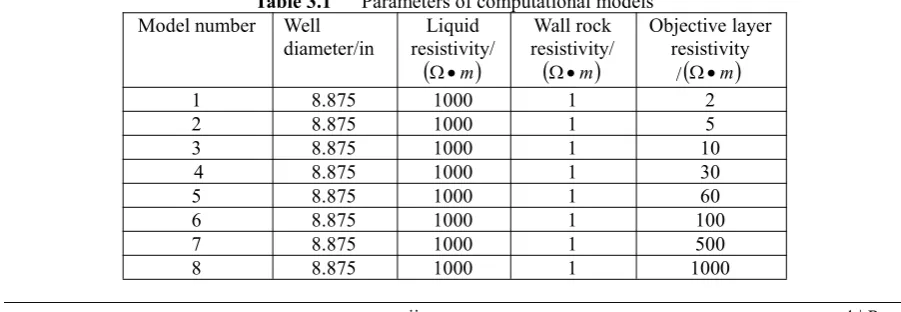
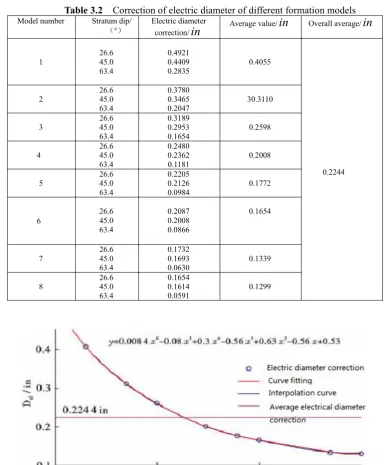
is established, and the corresponding electrical diameter correction is obtained by looking up the apparent resistivity of the measuring point. That is to use three-dimensional finite element method to simulate the logging response of the electrical imaging instrument.The parameters of the two strata model used to establish the linked list are shown in Table 3.1, the simulation results of the model are given by using the three-dimensional finite element numerical simulation method[11], and the corresponding sinusoidal amplitude values are plotted by Matlab software and calculated to obtain the model Electric diameter correction (Table 3.2). It can be seen from Table 3.2 that under the same contrast, the larger the dip angle of the strata is, the smaller the electric diameter correction will be; in the same strata dip, the larger the contrast, the smaller the correction amount. By fitting the above discrete results through a curve fit (Figure 3.3), it can be seen that there is a significant irrationality with a fixed amount of electrical diameter correction, a small amount of correction in the low resistance region, and a large correction in the high resistance region The amount of correction. In both cases, the dip of the calculated formation will be deviated. Therefore, it is more effective to calibrate the electrical diameter with the linked list.Table 3.1 Parameters of computational models
Model number Well
diameter/in resistivity/Liquid
m
Wall rock resistivity/
m
Objective layer resistivity
/
m
1 8.875 1000 1 2
2 8.875 1000 1 5
3 8.875 1000 1 10
4 8.875 1000 1 30
5 8.875 1000 1 60
6 8.875 1000 1 100
7 8.875 1000 1 500
Table 3.2 Correction of electric diameter of different formation models Model number Stratum dip/
(°) Electric diametercorrection/
in
Average value/in
Overall average/in
1 26.645.0
63.4
0.4921 0.4409
0.2835 0.4055
0.2244
2 26.645.0
63.4
0.3780 0.3465
0.2047 30.3110
3 26.645.0
63.4
0.3189 0.2953
0.1654 0.2598
4 26.645.0
63.4
0.2480 0.2362
0.1181 0.2008
5 26.645.0
63.4
0.2205 0.2126
0.0984 0.1772
6 26.645.0
63.4
0.2087 0.2008 0.0866
0.1654
7 26.645.0
63.4
0.1732 0.1693
0.0630 0.1339
8 26.645.0
63.4
0.1654 0.1614
0.0591 0.1299
Figure 3.2Relationship between formation resistivity and electric diameter correction
When actually obtaining the amount of electric diameter correction, it is necessary to consider both the influence of formation resistivity and formation inclination.Therefore, the process of electric diameter correction is mainly divided into two steps: (1) Check the calibration list to get the initial value of the correction and calculate the initial value of the dip angle ; (2) The initial value of formation dip is substituted into Table 3.2, and the more accurate diameter correction is obtained through the interpolation of the electrical diameter correction under different inclination angles.
IV. EFFECT VERIFICATION 4. 1 Ideal formation model
forward programming. When calculating the inclination of the strata in this inclined interval, the required amount of electrical diameter correction can be obtained by looking up the apparent resistivity response and using equation (8) to obtain the corrected dip angle. The calculated results show that under the conditions of the established formation model, when the true dip angle of the formation is 60 °, If not for the electrical diameter correction, formation resistivity of 10 and 50
m
, respectively, when the dip was 61.28°and 60. 67 °, the extracted dip angle of the strata is larger than the real value. If the diameter correction is carried out, the relationship between the electric diameter correction amount corresponding to Figure 3.2 and the resistivity of the formation can be obtained. The corrected values are 0.268 4in
and 0.219 9in
, respectively. The corrected dip angles are 60. 55 ° and 60. 07 °, respectively, which are closer to the true values. It can be seen that the validity of the linked list can be verified by querying the electric diameter correction amount linked list established in this paper to determine the amount of electric diameter correction.Figure 4.1 Three layer inclined stratum model
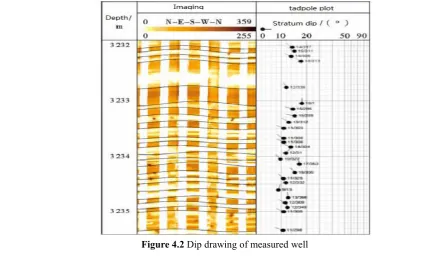
4. 2 Actual well data
Applying the above method, the inclination angle of the real imaging well of electrical imaging instrument at different depths is extracted. According to the apparent resistivity of the electrical imaging, the diameter of the wellbore is corrected by looking up the electric diameter correction linked list established in this paper, and the inclination values of different depth points (Figure 4.2). It can be seen that the extracted inclination and inclination are in good agreement with the bedding features of the image and the extraction results of the inclination angle are more refined, which proves the reliability of the method.
V. CONCLUSION AND SUGGESTION
Electrical imaging logging is shallow in depth and is especially suitable for the extraction of formation dip. In this paper, the relationship between electrical diameter correction and formation resistivity is established by studying the influence of borehole drilling fluid, surrounding rock and formation contrast and strata inclination on the electrical diameter correction. The theoretical stratigraphic model test and actual well Data processing, verify the validity and reliability of the method in this paper, so as to achieve the accurate formation dip information from imaging logging data.
In this paper, we only consider the inclination of formation, the contrast between surrounding rock and formation and wellbore drilling fluid when establishing the relation between electrical diameter correction and formation resistivity. For the factors such as the gap between plate and borehole wall and the borehole collapse during the instrument measurement Therefore, with the enrichment of actual log data, the method in this paper will be further improved in the process of processing a large number of actual log data and provide more reliable formation information for geological interpretation of electrical imaging data .
REFERENCES
[1]. LI Qing-song, PAN He-ping, ZHANG Rong. The progress of resistivity imaging log[J]. Chinese Journal of Engineering Geophysics,2005,2(4);304-310.
[2]. WANG Jun,YANG Chang-chun,XU Da-hua,et al.Application and prospect of the formation micro-resistivity image well logging[J]. Progress in Geophysics,2005,20(20):357-364.
[3]. WANG T,FANG S, PAVLOVIC M D,et al. Borehole imaging in nonconductive muds:resolution,depth of investigation and impact of anisotropy[C]//SPWLA 45th Annual Logging Symposium,Paper NN,2004; 1-14.
[4]. MCKINNY K,BOONEN P,HUISZOON C,et al. Analysis of density image dip angle calculations[C]//SPWLA 49th Annual Logging Symposium,Paper ZZ,2008:1-9.
[5]. YU Zeng-hui.Investigation on characteristics of electrical imaging tool oil-hase mud hased on capacitive coupling[J].Well Logging Technology,2014,38(2):206-210.
[6]. ZHAI Jin-hai. Study on micro-resistivity scanning imaging method in oil-based mud[D]. Chengdu: University of electronic Science and Technology of China,2012.
[7]. LOFTS J,EVANS M,PAVLOVIC M. A new micro-resistivity imaging device for use in oil-based
mud[C]//SPWLA 43rd Annual Logging Symposium,Paper II,2002.
[8]. LAI Fu-qiang. Micro-resistivity imaging logging processing and interpretation methods
research[D]. Dongying;China University of Petroleum,2011.
[9]. BLOEMENKAMP R,ZHANC T,COMPARON L,et al. Design and field testing of a new high-definition micro-resistivity imaging tool engineered for oil-based mud[C]//SPWLA 55th Annual Logging Symposium,Paper KK,2014:1-25.
[10]. ITSKOVICH U, CORLEY B, FORGANG S, et al. An improved resistivity imager for oil-based mud: basic physics and applications [C]//SPWLA 55th Annual Logging Symposium, Paper NN,2014:1-13. [11]. ZHANU Geng-ji. Electric logging algorithm[M]. Beijing;Petroleum Industry Press,2007.