(NCMTEE-2K17) 27th March 2017
DISEASE DETECTION BY USING IMAGE PROCESSING
RUPALI MISAL ME (E&Tc) Smt. Kashibai Navale college of Engineering vadgaon. , pune,[email protected]
V. S. KULKARNI
ME (E&Tc) Smt. Kashibai Navale college of Engineering vadgaon, pune, [email protected]
ABSTRACT
The analysis of malaria is based on novel Annular Ring Ratio Method which is already implemented, tested and validated in MATLAB. The method detects the blood components such as the Red Blood Cells (RBCs), White Blood Cells (WBCs), and identifies the parasites in the infected RBCs. Dengue fever is a viral disease and it is a major issue in many developing countries, including India. The main objective is to detect and count platelet to diagnose Dengue Haemorrhagic Fever this reduces labor intensive, time and cost. There is a solution in hands of digital image processing to face this challenge. Segmentation techniques and morphological operation are applied to investigate the number of platelets which is used to diagnose dengue using the microscopic image of blood smear. The platelet count is estimated using various Segmentation techniques and morphological operations and with the help of the platelets count dengue fever infection is detected. One of the morphological operations called flood fill is utilized to detect platelet with platelet size. In many primary health care centers blood cell counting is typically performed manually, which is very difficult and requires expert lab technician. This procedure needs a digital camera attached with traditional magnifying microscope where the advanced camera is associated with PC. The expense of the proposed hardware is cost efficient.
KEYWORDS:malaria; dengue ; RBCs, platlets.
I. INTRODUCTION
1.1 INTRODUCTION TO MALARIA
The most widely used technique for determining the development stage of the malaria disease is visualmicroscopical evaluation of Giemsa stained blood smears. However this is a routine and time consuming task and requires a trained operator. Besides a recent study on the Field shows the agreement rates among the clinical experts for the diagnosis are surprisingly low. Malaria can be fatal if not detected and treated on time. The disease is the second most dangerous after tuberculosis and is endemic in areas of Africa, Asia, South America, and to a lesser extend in areas of Middle East and Europe.
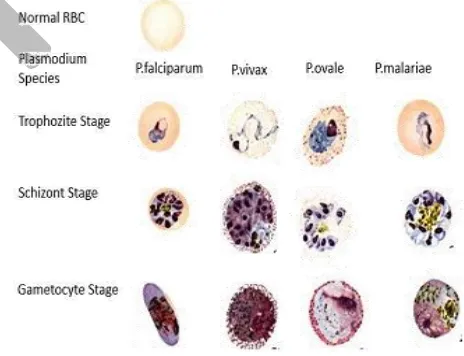
Malaria is transmitted by the female anopheles mosquitoes which carry the protozoan parasite of the genus Plasmodium. In peripheral blood sample, definitive diagnosis of malaria is done by visual detection and recognition of the parasite in a stained sample of blood through a microscope. The common staining technique for malaria diagnosis in thin blood films is the Giemsa stain. If examined through a light microscope, the Plasmodium species, white blood cells (WBC) and platelets or artifacts will appear as saturated dark blue-purplish whereas The red blood cells (RBC) are lightly colorized. However the visual effect of staining varies according to the lighting and imaging conditions. But the manual microscopic diagnosis is laborious, time consuming and the accuracy depends on the expertise of the microscopist. Hence automating the process is important to provide an accurate, reliable and objective tool for the complete eradication of the deadly disease. Malaria is one of the most widespread and potentially fatal diseases especially in Africa and Asia.
Fig. 1: Malarial Parasites and their life cycles
1.2 INTRODUCTION TO DENGUE
(NCMTEE-2K17) 27th March 2017 the bone pain of dengue fever. Alternatively, the use of the
Spanish word may derive from the similar-sounding Swahili. Slaves in the West Indies who contracted dengue were said to have the posture and gait of a dandy, and the disease was known as "Dandy Fever".
In this paper, an attempt has been made to implement the malarial diagnosis algorithm that has already been implemented, tested and evaluated on a MATLAB platform. The main objective of the research is to results have to be the same as the pathologist output, as well as keeping to an acceptable processing speed and duration.
1.3 MOTIVATION
Wilderness fever is a deadly disease and the present survey by the World Prosperity Affiliation (WHO) has evaluated that intestinal issue causes more than 200K occurrences of fever reliably.
The diagnosis of the disease requires intense and costly instruments inaccessible for the poorest nations of the world, where regularly the malady is endemic. Microscopic malaria analysis is, by a wide margin, thought to be the best effective diagnostic method, however it is highly tedious and work intensive.
The research will concentrate on the advantages it can accommodate the effective determination of intestinal sickness, dengue and the supportive treatment.
1.4 OBJECTIVES
The objective of this paper is given below
The main objective of the research is to successfully detection of malaria and dengue.
Separate the affected and not affected RBCs by using the ostus segmentation and counting the platelets by using the counting algorithm.
In By using such tool we can improve the speed and the accuracy in the results compare to the pathologies using in the hospital.
1.5 ARR transform undergoes following procedures:
Convert the image to grayscale.
Dilate the image using a ring shaped structuring element.
Erode the image using a disk shaped structuring element.
Convert the closed image to a ratio transformed image by calculating the ratio of average intensities of the annular concentric ring structuring element to disk shaped structuring element masked over the image.
Calculate the peak intensities of the ratio transformed image.
Map the peaks on to the corresponding coordinates, which is actually the centre of each
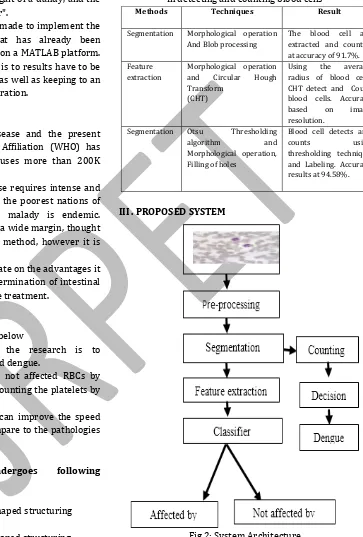
Table 1. Various technique of image processing that useful In detecting and counting blood cells
III . PROPOSED SYSTEM
Fig 2: System Architecture
3.1 IMAGE ACQUISITION
Image acquisition is the action of retrieving an image from some source, usually a hardware-based source. Digital image acquisition is done here by making use of a digital camera. A drop of blood is taken in a slide and prepares a monolayer of blood using another slice where the cells are divided sufficiently. Place a drop of immersion oil onto
Methods Techniques Result
Segmentation Morphological operation
And Blob processing
The blood cell are extracted and counted at accuracy of 91.7%. Feature
extraction
Morphological operation
and Circular Hough
Transform (CHT)
Using the average
radius of blood cells CHT detect and Count blood cells. Accuracy
based on image
resolution.
Segmentation Otsu Thresholding
algorithm and
Morphological operation, Filling of holes
Blood cell detects and
counts using
(NCMTEE-2K17) 27th March 2017 slide to be seen ensuring it is totally air dried subsequent
to recoloring. Blend the Wright-Giemsa Stain and buffer blend to get ready with blood smears16. The advanced camera is associated with a magnifying lens which catches tiny computerized picture of blood smear. Caught picture is annexed to PC for examination. The computerized pic-ture determination depends on advanced camera and magnifying instrument.
3.2 IMAGE ENHANCEMENT
Before segmentation, the image is enhanced to improve the quality. Such enhancement process is as follow:
3.2.1 GREEN PLANE EXTRACTION
Before segmentation the RGB color image is split into three planes such as red, green and blue. The green plane so extracted is clear with feature that we need to split platelets. So the green plane of the imported image is taken for further process. The formula G = Img (:,:,2) is used to split green plane. The other two plane such as red and blue are not suitable for analysis with clear feature.[1]
3.2.2 CONTRAST ADJUSTMENT
The image may lack contrast when there are no sharp dif-ferences between black and white. To change the contrast or brightness of an image we make use of Contrast-limited adaptive histogram equalization (CLAHE). CLAHE works on little areas in the image, called tiles, as opposed to the whole image. Every tile’s contrast is upgraded using formula CA=adapthisteq (G). [1]
3.3 IMAGE SEGMENTATION
The term image segmentation refers to the partition of an image into an arrangement of areas that cover it. The fundamental objective is to extract significant information the digital image. A global threshold (limit) can be utilized to change over the image intensity of a binary image. Binary images are typically obtained by thresholding a gray level image. Pixels with a gray level above the threshold are set to 1 and the rest are set to 0.17 [1] 3.3.1 GLOBAL IMAGE THRESHOLD USING OTSU’S METHOD
The contrast adjusted image is converted to binary image based on threshold. The gray thresh () function uses Otsu’s strategy to produced image with black and white pixels. The binary image obtained is inverted i.e. background representing black and cells in it representing white.18-19 [1]
3.3.2 FILLING OF HOLES
One of the morphological operations called flood fill operation is performed on binary image. This operation repair gaps in the binary image. Flood fill in binary image changes connected background pixels (0s) to foreground pixels (1s), ceasing when it achieves object limits. Little openings and substantial gaps are isolated utilizing fill
holes operator. Here the platelets are considered as little gap and it effectively extracted from other blood cells. [1]
3.4 IMAGE LABELING
Image labeling is one of the image analysis techniques which can name the connected region in a binary image. Labeling checks the imported image and groups its pixels into components based on pixel availability, for instance platelets are labeled, i.e. all pixels in a connected com-ponent have comparable pixel intensity values and are somehow associated with one another. [1]
3.5 COUNTING OF PLATELETS
Counting cells manually is a tiresome process for humans if given a large data set of microscopy images. This task can be achieved much faster by means of labeling techniques. Each block of Figure1 can be proceeding by various steps as given below in a flow chat Figure 1.[1]
4. FEATURE EXTRACTION
Feature extraction includes morphological operations. It extracts features that contain quantitative information of objects of interest. Shape features are areas of cell and nucleus, cell perimeter, ratio of nucleus to overall cell area, boundary of the nucleus and circularity factor. Texture features include contrast, homogeneity and entropy derived from the gray-level co-occurrence matrix. Color histogram, mean and standard deviation of the color components in CIE-Lab domain, form the color features.[1] Various textural and shape features of the separate images Obtained after labeling are extracted. The features include: GLCM (19) (textural features)
Shape features (7) (perimeter, area etc.) fractal dimension (1)
histogram features (5)
These features are extracted to get a better idea about the Shape, solidity, texture, contrast, energy etc. The parasite can Be classified based on these parameters
5. CLASSIFIERS
(NCMTEE-2K17) 27th March 2017
A) Blood sample B) gray scale image
c) Ostu thresholding D) Inversion
E) Cropped cell IV RESULT
IV CONCLUSION
A robust and novel method by using cell phone for diagnose malaria and dengue has been implemented in this paper. By using this method we obtain the less than 60 seconds time to give a diagnosis as compared to other clinical laboratories. The main objective of the research is to successfully implement the application on to the mobile platform without the loss of information integrity, with minimal memory footprint on the mobile phone. The results have to be the same as the MATLAB output, as well as keeping to an acceptable processing speed and duration. The research will focus on the benefits it can provide for the successful diagnosis of malaria, dengue and the supportive treatment.
ACKNOWLEDGMENT
The maker might need to express phenomenal by virtue of V. S. Kulkarni for his critical duty in building this work.
REFERENCES
1) V. V. Makkapatti and R. M. Rao, "division of intestinal sickness parasites in fringe blood spread pictures "Procedures of IEEE Universal Meeting on Acoustics
Discourse and Flag Handling, I CASSP 2009, pp. 136l - 1364, Apr. 2009.
2) Ravi raja, g. Bajpai Also s. Sharma, "Examination of identifying those intestinal sickness parasite contaminated blood pictures utilizing measurable built Approocft " IFMBE Proceedings, third kuala lumpur universal gathering ahead biomedical building 2006,vol. 15,p craftsmanship 12,pp. 502-505,2007. 3) Abdul Nasir, A. S.; Res. Bunch, Univ. Malaysia Perlis,
Arau, Malaysia Mashor, M.Y. , Mohamed, Z "Division based approach for location of intestinal sickness parasites utilizing moving k-implies grouping" 2012. 4) Muda, T. Z. T, Sch. About media Technol. & Commun. ,
Univ. Utara Malaysia, Sintok, Malaysia; Salam, r. An. “Blood Mobile picture division utilizing mixture K-means and median-cut algorithms” 2011.
5) Mandal,S. ; Sch. Of med. Sci. & Technol. , Indian inst. For Technol. , Kharagpur, india ; Kumar, a. ; Chatterjee, j. ; Manjunatha “Segmentation for blood smear pictures utilizing normalized cuts for identification for malarial parasites” 2010.
6) Halim, What's more, the lion's share of Corps parts don't stay in their starting work areas once their comm.; Sch. From claiming Comput. Eng. , Nanyang Technol. Univ. , Singapore; Bretschneider, t. ; Li, Y. ; Preiser, p. R. “Estimating intestinal sickness parasitemia starting with blood smear Images” 2006. 7) Sarach Tantikittil, Sompong Tumswadi, Wichian
Premchaiswadi doctoral level college for data improvement Siam school Bangkok, Thailand'image get ready to identification of dengue infection In view of WBC order What's more choice Tree'2015 Ict and taking in planning thirteen meeting.
8) Anna Rosanas-Urgell, Dania Mueller , Inoni Betuela, Céline Barnadas, Jonah Iga, Peter A Zimmerman, Hernando A del Portillo , Peter Siba, Ivo Mueller and Ingrid Felger ,” Comparison of diagnostic methods forth detection and quantification of the four sympatric Plasmodium species in field samples from Papua New Guinea” Malaria Journal 2010,Volume 9, www.malariajournal.com.
9) S. Kareem, R.C.S Morling, I Kale “A Novel Method to Count the Red Blood Cells in Thin Blood Films”IEEE International Symposium on Circuits and Systems (ISCAS), 2011, Pages 1021-1024
10) S.Kareem, I Kale, R.C.S Morling “Automated Malaria Parasite Detection in Thin Blood: - A Hybrid Illumination and Color Constancy Insensitive, Morphological Approach”
(NCMTEE-2K17) 27th March 2017 Films” Pan American Health Care Exchanges
(PAHCE2013), Medellin, Columbia, May 2013
12) S.Kareem, I Kale, R.C.S Morling “Automated P.falciparum Detection system for Post-treatment Malaria Diagnosis using Modified Annular Ring Rat io Method” IEEE 14th International Conference on Computer Modelling and Simulation, March 2012 13) C.Di Ruberto, Andrew G. Dempster, S.Khan, and
B.Jarra,”Analysis of infected blood cell images using morphological operators,”Image and vision computing,vol 20,no.2,pp.133-146,February 2002 14) K.N.R.M.Rao,,”Application of Mathematical Morphology
to Biomedical Image Processing,” PhD thesis , 2004 15) Boray Tek, Andrew G. Dempster, Izzet Kale.”Computer