13 | P a g e
OPTIMIZATION OF VARIOUS DRILLING MACHINE PARAMETERS USING
GREY RELATION METHOD AND ANOVA APPROACH
SYED NADEEM AHMAD ALVI
Department of Mechanical Engineering, Bapurao Deshmukh College of Engg. Sevagram, Wardha, India, [email protected]
DR. SUNIL V DESHMUKH
Department of Mechanical Engineering, Suresh Deshmukh College of Engineering, Wardha, India [email protected]
ABSTRACT:
This paper is related to the vibrations in the drilling operations where as the processor parameters are optimized using grey relational analysis and Anova approach. The parameters which effect vibrations are Drill Diameter, Speed and Feed Rate which is related to the performance characteristics. A grey relational grade obtained from the grey relational analysis is used to optimize the process parameters. Optimal process parameters can then be determined by the Taguchi method using the grey relational grade as the performance index. Using these different characteristics, the parameters, including speed, drill diameter, and feed rate are optimized. The Results show the parameter drill diameter and feed rate of drilling has most significant effect on the vibrations. KEYWORDS: Grey relational grade, Drilling, Feed Rate, Vibrations.
I. INTRODUCTION:
In many industries drilling is a most important process, while drilling it is observed that the vibrations occur due to machine parameters. If the vibrations are produced by external parameters then that can be controlled by the methods of vibration isolation and carrying out during the drilling operation. But, if the vibrations are produced by drilling itself i.e. due to spindle speed and feed cannot be controlled completely.
So, such internal vibrations need to be avoided. As these vibrations depend upon the various machining parameters, calculation of vibrations can be done under different machining parameters.
So here we had conducted the study and the results can be summarized and the critical values of vibrations for various parameters are defined. And grey relational analysis is used for identifying the most affecting factor for the vibrations. [1]
II. DESING OF EXPREMENT: A. INPUT PARAMETER:
1. Diameter 2. Feed rate 3. Speed
B. OUTPUT PARAMETER:
1. Vibrations
In this research we used the above mentioned input parameters to get the readings of the vibrations. After the reviewing of literature the input parameters diameter, speed and feed rate are consider and as an output the vibrations are measured. [2]
The Mild Steel material specimen has been used for the study and 6mm, 8mm, 10mm and 12mm drill diameter with same point angle is used for experimentation. Each fresh drill point was used to make the holes in order to nullify the effect of tool wear on cutting forces.
The objective of this research is to study the effect of different parameters such as speed, drill diameter and feed rate. So for this purpose we select different levels and combinations of diameter of drill, Speed and feed rate
For conducting the study, it has been decided to follow Taguchi method of experimental design. And examine and verify, grey relation analysis method. The most important output i.e. vibrations is analyzed in this research work. The effect of the variation in input process parameter is studied on this response parameter.
III. EXPERIMENTAL SETUP: A. DRILLING MACHINE:
A radial drilling machine was used for the drilling operation of different speed and feed.
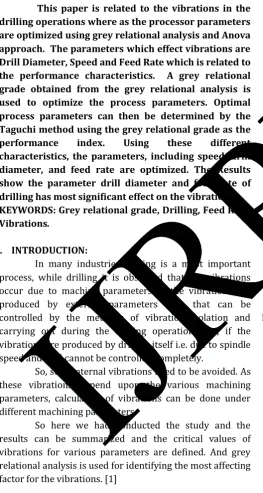
B. EXPERIMENTAL SETUP:
14 | P a g e Fig 1: Experimental Set-up
Fig 2: Experimental Set-up
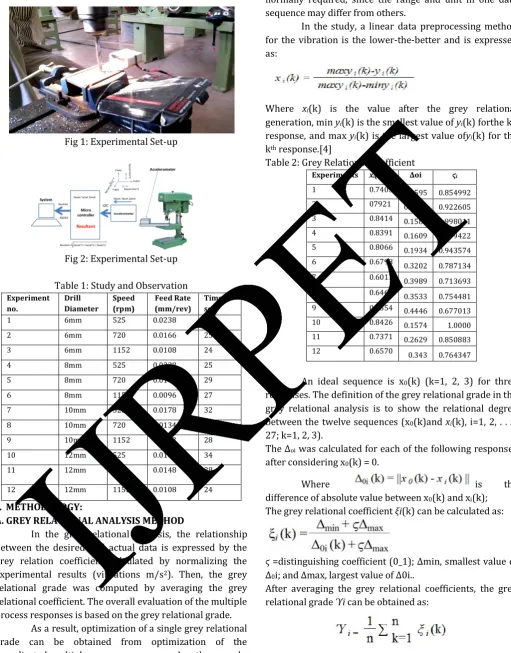
Table 1: Study and Observation
Experiment no.
Drill Diameter
Speed (rpm)
Feed Rate (mm/rev)
Time sec.
1 6mm 525 0.0238 24
2 6mm 720 0.0166 25
3 6mm 1152 0.0108 24
4 8mm 525 0.0228 25
5 8mm 720 0.0143 29
6 8mm 1152 0.0096 27
7 10mm 525 0.0178 32
8 10mm 720 0.0134 31
9 10mm 1152 0.0093 28
10 12mm 525 0.0168 34
11 12mm 720 0.0148 28
12 12mm 1152 0.0108 24
IV. METHODOLOGY:
A. GREY RELATIONAL ANALYSIS METHOD
In the grey relational analysis, the relationship between the desired and actual data is expressed by the grey relation coefficient calculated by normalizing the experimental results (vibrations m/s2). Then, the grey relational grade was computed by averaging the grey relational coefficient. The overall evaluation of the multiple process responses is based on the grey relational grade.
As a result, optimization of a single grey relational grade can be obtained from optimization of the complicated multiple process responses. In other words, the grey relational grade can be treated as the overall evaluation of experimental data for the multi response process. Optimization of a factor gives level with the highest grey relational grade. Data Pre-Processing is
normally required, since the range and unit in one data sequence may differ from others.
In the study, a linear data preprocessing method for the vibration is the lower-the-better and is expressed as:
Where xi(k) is the value after the grey relational
generation, min yi(k) is the smallest value of yi(k) forthe kth
response, and max yi(k) is the largest value ofyi(k) for the
kth response.[4]
Table 2: Grey Relational Coefficient
Experiments xi(k) Δoi ϛi 1 0.7405 0.2595 0.854992 2 07921 0.2079 0.922605 3 0.8414 0.1586 0.998011 4 0.8391 0.1609 0.99422 5 0.8066 0.1934 0.943574 6 0.6798 0.3202 0.787134 7 0.6011 0.3989 0.713693 8 0.6467 0.3533 0.754481 9 0.5554 0.4446 0.677013 10 0.8426 0.1574 1.0000 11 0.7371 0.2629 0.850883 12 0.6570 0.343 0.764347
An ideal sequence is x0(k) (k=1, 2, 3) for three responses. The definition of the grey relational grade in the grey relational analysis is to show the relational degree between the twelve sequences (x0(k)and xi(k), i=1, 2, . . . ,
27; k=1, 2, 3).
The Δoi was calculated for each of the following responses after considering x0(k) = 0.
Where is the
difference of absolute value between x0(k) and xi(k); The grey relational coefficient ξi(k) can be calculated as:
ϛ =distinguishing coefficient (0_1); Δmin, smallest value of Δ0i; and Δmax, largest value of Δ0i..
After averaging the grey relational coefficients, the grey relational grade Ύi can be obtained as:
Where n is the number of process responses. The higher value of the grey relational grade represents the stronger relational degree between the reference sequence
15 | P a g e the reference sequence x0(k) is the best process response
in the experimental layout. The higher value of the grey relational grade means that the corresponding cutting parameter is closer to optimal. In other words, optimization of the complicated multiple process responses is converted into optimization of a single grey relational grade.[5]
Table 3: Grey relational Grade
Experiments Ύi Order
1 0.854992 6
2 0.922605 5
3 0.998011 2
4 0.994220 3
5 0.943574 4
6 0.787134 8
7 0.713693 11
8 0.754481 10
9 0.677013 12
10 1.0000 1
11 0.850883 7
12 0.764347 9
According to the Taguchi method,[6] the statistic delta is the difference between the high and the low effect in the grey relational grade factor, was used. A classification can be done to determine the most affecting factor. So the multiple objective optimization problems are transformed into a single equivalent objective function optimization problem. The higher grey relational grade will be close to the optimal condition. Using the grey relational grade value, the mean of the grey relational grade for each level of different factors, and the total mean of the grey relational grade is summarized in Table.
Table 4: Response table for GRG values for Diameter.
Level Diameter Grey Relational Grade
1 6mm 0.9252
2 8mm 0.9083
3 10mm 0.7150
4 12mm 0.8717
Delta 0.2102
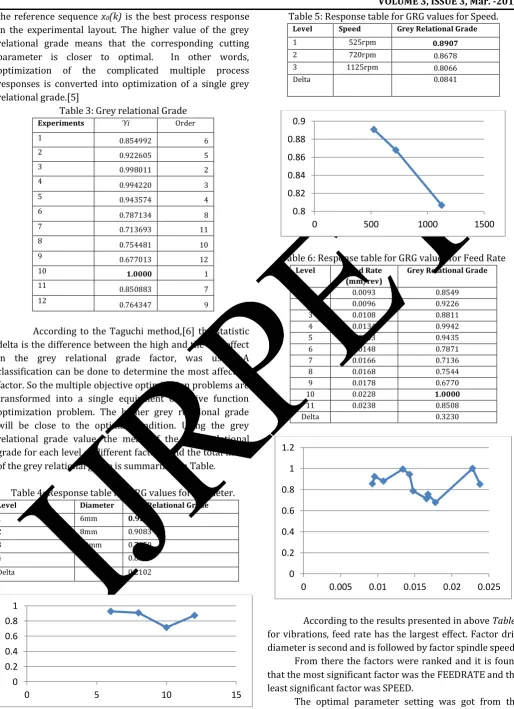
Table 5: Response table for GRG values for Speed.
Level Speed Grey Relational Grade
1 525rpm 0.8907
2 720rpm 0.8678
3 1125rpm 0.8066
Delta 0.0841
Table 6: Response table for GRG values for Feed Rate
Level Feed Rate (mm/rev)
Grey Relational Grade
1 0.0093 0.8549
2 0.0096 0.9226
3 0.0108 0.8811
4 0.0134 0.9942
5 0.0143 0.9435
6 0.0148 0.7871
7 0.0166 0.7136
8 0.0168 0.7544
9 0.0178 0.6770
10 0.0228 1.0000
11 0.0238 0.8508
Delta 0.3230
According to the results presented in above Tables for vibrations, feed rate has the largest effect. Factor drill diameter is second and is followed by factor spindle speed.
From there the factors were ranked and it is found that the most significant factor was the FEEDRATE and the least significant factor was SPEED.
The optimal parameter setting was got from the combination of 520 RPM Speed, 6mm Diameter of Drill and 0
0.2 0.4 0.6 0.8 1
0 5 10 15
0.8 0.82 0.84 0.86 0.88 0.9
0 500 1000 1500
0 0.2 0.4 0.6 0.8 1 1.2
16 | P a g e Feed Rate 0.0228mm/Revolution for the 12 experiment having highest performance this is observed in figures.[7]
ANOVA
The purpose of the ANOVA is to investigate which factors significantly affect the performance characteristic. This is accomplished by separating the total variability of the grey relational grades, which is measured by the sum of the squared deviations from the total mean of the grey relational grade, into contributions by each drill parameter and the error. The percentage contribution by each factor to the total sum of the squared deviations SST can be used to evaluate the importance of the drilling parameter change on the performance characteristic.
In addition, the F test can also be used to determine which factor has a significant effect on the performance characteristic. Usually, the change of a determined factor has a significant effect on the performance characteristic when the F value is large. Results of the ANOVA Table indicate that diameter is the most significant factor for affecting the multiple performance characteristics. Based on the previous discussion, the feed rate affects mostly the vibrations, but through the F value and ANOVA proves that diameter is have significantly affect the vibrations.[8]
SOURCE SS DF MS F P
DIAMETER 0.083 3 0.028 3.402 0.074 SPEED 0.015 2 0.008 0.512 0.616 FEEDRATE 0.148 11 0.013 - -
ERROR 0.00 0
CONCLUSION:
A grey relational grade obtained from the grey relational analysis was used to optimize the drilling parameters during the drilling of the mild steel specimen with vibrations. The experimental results show that parameter Feed Rate and Diameter has the most significant effect on the vibrations.
Therefore, the integration of grey relational analysis and the Taguchi Method can be applicable for the optimization of process parameters and help to improve process efficiency.
REFERENCES:
1) El-Wardany T.I., Gao D., Elbestawi M.A. (1996)
“Tool condition monitoring in drilling using vibration signature analysis” International
Journal of Machine Tools and Manufacture, Vol. 36(6), pp. 687–711
2) Kanai M. and Kanda Y. (1978) “Statistical
characteristic of drill wear and drill life for standard ized performance tests” Annals of CRIP, Vol. 27(1), pp.
61-66
3) Abhijit Saha and N. K. Mandal, “Optimization of
machining parameters of turning operations based on multi performance criteria”, International Journal of
Industrial Engineering Computations 4, pp. 51–60, 2013
4) D. Chakradhar and A. Venu Gopal, “Multi-Objective
Optimization of Electrochemical machining of EN31 steel by Grey Relational Analysis”, International
Journal of Modeling and Optimization, Vol. 1, No. 2, pp. 113-117, June 2011.
5) Chao-Lieh Yang, “Optimizing the Glass Fiber Cutting
Process Using the Taguchi Methods and Grey Relational Analysis”, New Journal of Glass and
Ceramics, 1, pp. 13-19, 2011
6) Yang W.H., Tarng Y.S. (1998) „Design optimization of
cutting parameters for turning operations based on the Taguchi method‟ Journal of Material Processing
17 | P a g e 7) Fung C.P., Kang P.C. (2005), “Multi-response
optimization in friction properties of PBT composites using Taguchi method and principle component analysis” Journal of Material Processing Technology,
Vol l. 170, pp. 602–610
8) B. Shivapragash, K. Chandrasekaran, C. Parthasarathy and M. Samuel, “Multi Response Optimizations in
Drilling Using Taguchi and Grey Relational Analysis”,
International Journal of Modern Engineering Research, Vol.3, Issue.2, pp-765-768, March-April. 2013
9) Kang and M. Hadfield, “Parameter Optimization by
Taguchi Methods for Finishing Advanced Ceramic Balls Using a Novel Eccentric Lapping Machine,” Proceedings of the Institution of Mechanical Engineers, Part B: Journal of Engineering Manufacture, Vol. 215, No. 1,
2001,
10)G. Taguchi, Introduction to Quality Engineering, Asian