Research Article
CODEN: IJPNL6
DEVELOPMENT AND VALIDATION OF REVERSE PHASE HIGH PERFORMANCE
LIQUID CHROMATOGRAPHIC METHOD FOR DETERMINATION OF TIROFIBAN
IN SERUM
Marija Darkovska Serafimovska
1, Emilija Janevik-Ivanovska
1*, Zorica Arsova-Sarafinovska
2,
Icko Djorgoski
3, Nenad Ugresic
41
GoceDelcev University, Faculty of Medical Sciences, Stip, Republic of Macedonia,
2
Institute for Public Health of the Republic of Macedonia, Skopje, Republic of Macedonia,
3
University St. Cyril and Methodius, Faculty of Natural Science and Mathematics, Skopje,
Republic of Macedonia,
4
University of Belgrade, Faculty of Pharmacy, Belgrade, Serbia
*Corresponding author e-mail: [email protected]
ABSTRACT
A specific, sensitive and rapid RP-HPLC method has been developed for the determination of Tirofiban in serum. The chromatographic separation was realized using reverse phase LiChrospher® 100 RP-18 column (4.0 mm × 250 mm, 5 μm) and mobile phase consisting the mixture of 0.1 M KH2PO4 (pH 5.2, adjusted with 1.0 N sodium hydroxide solution) and acetonitrile, with the ratio of 70:30% (v/v) and flow rate of 1.0 ml/min. The detection was carried out at 274 nm. The response was linear over the range of 0.03 – 0.18 mgmL-1 in mobile phase and serum samples. The limit of detection (LOD) for Tirofiban was 1.84, 13.8 and 14.6 μg mL-1 in methanol, spiked rat serum and spiked human serum, respectively. The described method can be quickly and routinely applied, without any interference from endogenous substances, for therapeutic monitoring of levels of Tirofiban in the serum samples.
Key Words: Tirofiban; HPLC; Determination; Human serum; Rat serum.
INTRODUCTION
Tirofiban hydrochloride, a non-peptide antagonist of fibrinogen binding the platelet glycoprotein (GP) IIb/IIIa receptor and inhibits platelet aggregation. Tirofiban hydrochloride monohydrate is chemically described as a N-(butylsulfonyl)-O-(4-[4-piperidinyl] butyl)-L-tyrosine monohydrochloride monohydrate (Figure 1.). The empirical formula of Tirofiban is C22H36N2O5S·HCl·H2O and molecular weight of 495.08. [1,2].
Tirofiban can be used in combination with heparin and aspirin in the treatment of patients with unstable angina or non-Q-wave myocardial infarction, including patients under subsequently percutaneous transluminal coronary angioplasty (PTCA) [3,4]. Adjunctive therapy with a GP IIb/IIIa-receptor inhibitors can reduce the incidence of cardiac
ischemic events, including subsequent myocardial infarction (MI) and death, in the patients with non-ST-segment-elevation acute coronary syndromes [5,6] Tirofibanprescribed and administrated to the patient according to the recommended treatment, attain more than 90% inhibition by the end of the 30-minute infusion. Platelet aggregation inhibition is reversible following cessation of the infusion of Tirofiban. Tirofiban with a half-life of approximately 2 hours [2] is not strongly bound to plasma protein. Protein binding of Tirofibanis concentration-independent in the range of 0.01–25 μgmL-1. The unbound fraction in human plasma is around 35% and the distribution volume of Tirofiban in the steady state is about 30 liters.
Experiments with 14C-labelled Tirofiban[7-9] showthat the radioactivity in urine and feces is emitted chiefly by unchanged Tirofiban. The radioactivity in
International Journal of Pharmacy
circulating plasma originates is mainly from unchanged Tirofiban (up to 10 hours after administration). These data present limited metabolism of Tirofiban. After intravenous administration of 14C-labelled Tirofiban to the healthy subjects, 66% of the radioactivity was recovered in the urine, 23% in the feces. The total recovery of radioactivity is 91%. Renal and biliary excretion contributes significantly to the elimination of Tirofiban. )[7-9]
Very few methods for the examination of Tirofibanwho use biological samples have been reported. [10,11], The direct determination of Tirofiban using UV detector to carry out pharmacokinetic parameters of Tirofiban, have not yet been described.. For the determination of Tirofiban in pharmaceutical dosage formulation for routine analysis and in a pure substance form, only a few HPLC methods were used. [14, 15]
The purpose of this paper is to describe the development of reliable, reproducible, fully validated, easy to perform, and low cost routine RP-HPLC method for the determination of Tirofiban in serum samples. The method appears to be suitable for the therapeutic monitoring of the levels of Tirofiban in serum samples.
MATERIAL AND METHODS
Apparatus and Chromatographic Conditions: The sample analyses were performed usingHPLC system (Perkin Elmer Series 200), containing tertiary pump, UV / VIS detector and auto sampler. The separation was carried out in the room temperature, using reversed-phase LiChrospher® 100 RP-18 column (4.0 mm × 250 mm, 5 μmparticle size). The chromatographic separation was performed using an isocraticmethod. The mobile phase contained a mixture of 0.1 M KH2PO4 (pH 5.2, adjusted with 1.0 N sodium hydroxide solution) and acetonitrile in the ratio 70:30 % v/v and flow rate of 1.0 ml min-1. The UV detector was set at a wavelength of 274 nm. The injection volume of samples was 50 µl.
Chemicals and Reagents: Tirofiban hydrochloride as a Reference Standard was supplied from Merck (batch No. L-000700462-006X027). Methanol and acetonitrile with HPLC grade were provided from Sigma Aldrich. All other chemicals were with analytical reagent grade. Redistilled water was used to prepare solutions for mobile phase.
Standard Solutions and Calibration Curves: The standard stock solution of Tirofiban was prepared by dissolving 10 mg of Tirofiban hydrochloride with 50 mL of methanol in a 50 mL volumetric flask. After
suitable dilutions (1,5 ml; 3 ml; 4,5 ml; 6 ml; 7,5 ml and 9 ml of standard stock solution up to 10 ml with methanol in a 10 ml volumetric flask) the concentration of Tirofiban was varied in the range of 0,03–0,18 mgmL-1. The calibration curve for HPLC analysis was constructed by plotting the ratio of the peak area of the drug against the drug concentration. All solvents and solutions for HPLC analysis were filtered using a membrane filter (0.45 μm pore size) and vacuum degassed before use.
Validation of the Method: The precision and reproducibility were checked for the period ofseveral days; both within day (n = 5) and between days (n = 5) for two different concentrations. Relative standard deviations were calculated to obtain the ruggedness and precision of the method. The precision and reproducibility of the proposed method wereevaluated by performing replicate analysis of the standard solutions. Two different concentrations within calibration range were prepared in methanol and serum samples, and analyzed with related calibration curves to determine intra-day and inter-day variability.
Recovery Studies: In order to establish the accuracy and reliability of the proposed method, recovery experiments were carried out by the standard addition method. The known amounts of the standard solution of Tirofiban were added to the rat and the human serum, mixed and analyzed by the proposed method. After five repeated experiments, the recoveries were calculated.
Recovery Studies in Spiked Human and Rat Serum Samples: The reason that serum samples were used for this study and collected from the normal human volunteers and from the normal rat before introducing the experimental model of deep venous thrombosis (DVT) was to obtain validated quantitative method appropriate to follow the concentration of Tirofiban and potential various degradation products in vitro and in vivo after application.
-1. Serum samples were injected into the HPLC
column. The amount of Tirofiban in spiked human and rat serum samples was calculated from the related linear regression equation.
Limit of Detection and Limit of Quantification:
The limit of detection (LOD) and limit of quantitation (LOQ) was calculated using following formulae: LOD = 3.3 SD/S and LOQ = 10 SD/S,, where SD is the standard deviation of the response (peak area) and S is the slope of the calibration curve obtained.
RESULTS AND DISCUSSION
Initial experiments were carried out using the mobile phase consisting of phosphate buffer and acetonitrile in different proportions and at different pH values. Mobile phase composition of 0.1 M KH2PO4 (pH 5.2, adjusted with 1.0 N sodium hydroxide solution) and acetonitrile (70:30, v/v) was finally optimized to give retention time of 8.6 min and 12.9 min. for Tirofiban and heparin, respectively. This mobile phase composition was found to be optimal for good peak resolution. The optimum wavelength for detection was 274 nm, at which the best detector response was obtained for Tirofiban.
System suitability tests should be an integral part of each analytical HPLC methods.[12,13] and in our study was performed through evaluation of different parameters (retention time, tailing factor, capacity factor, resolution, and selectivity). System suitability tests were carried out on freshly prepared standard stock solutions of Tirofiban. Tailing and capacity factors were obtained as 1.17 and 2.41 for Tirofiban. Resolution factor for this system for Tirofiban and heparin was 3.90. The retention times of Tirofiban in methanol, human and rat serum samples were 9.1, 9.2, and 9.16 min, respectively. The variation in retention time of Tirofiban among five replicate injections of standard solution in methanol, human and rat serum samples was very slight, giving the relative standard deviations (RSD%) of 0.61%, 0.93%, and 0.82%, respectively.
Linearity of response was studied by running the standard curve of Tirofiban. The plot of peak area ratio vs.Tirofiban concentration in methanol and spiked serum samples was linear in the concentration range of 0.03 – 0.18 mgmL-1. The determination coefficient was greater than 0.99 for both media. Table 1 shows the calibration characteristics and validation parameters of Tirofiban.
The intra and inter-day precision was determined as the RSD%. Precision, accuracy, and reproducibility results shown in Table 2 demonstrate good precision, accuracy, and reproducibility.
The stability studies of Tirofiban in methanol indicated no significant changes in sample concentrations after storage of samples in the period of 72 hours at 4oC in refrigerator.
Based on the obtained results, the proposed method was applied for the direct determination of Tirofiban content in the serum.
In order to check the applicability of the proposed method to the human and rat serum samples, the linearity range studies and recovery studies were performed. Calibration graph parameters are the same as showed in Table 1. Required validation parameters and recovery study results for human and rat serum samples are given in Table 2 and Table 3. The Figure 2ashows a typical chromatogram of the extract of the fresh blank serum sample, while Figure 2c and Figure 2d show chromatograms obtained when the same method was applied to spiked human and rat serum samples. There are no anyextraneous peaks from endogenous substances in chromatograms obtained in serum samples.
CONCLUSION
Figure 1. Chemical structure of Tirofiban hydrochloride.
Figure 2a. Chromatogram of blank serum
Figure 2b. Chromatogram of methanol used as solvent
Figure 2d. Chromatogram of Tirofiban (0,0675 mg mL-1) and heparin (12500 I.U mL-1) in methanol
Figure 2e. Chromatogram of serum spiked with Tirofiban (0,0337 mg mL-1) and heparin (12500 I.U mL-1)
Table 1. Characteristics of the linear regression analysis of Tirofiban
Methanol Human Serum Rat serum
Linearity range (mgmL-1) 0.03–0.18 0.03–0.18 0.03 -0.18
Slope 9200223 7942560 8795042
Intercept 2720.6 90750 23999
Determination coefficient (r2)
0.9999 0.9943 0.9949
SEa of the intercept 5124.18 35082.2 36834.2
SE of the slope 43858.91 300276.9 315271.9
Detection limit (mgmL-) 0.0018 0.0146 0.0138 Quantification limit (mgmL-) 0.0056 0.0442 0.0419 a
SE – Standard error
Table 2. Intra-day and inter-day precision of Tirofiban standards.
In methanol In rat serum
Theoretical concentration (mg mL-1)
Intra-day measured concentration (mg mL-1)a
Inter-day measured concentration (mg mL-1)b
Intra-day measured concentration (mg mL-1)a
Inter-day measured concentration (mg mL-1)b
Mean RSD% Mean RSD% Mean RSD% Mean RSD%
0.06 0.0577 1.15 0.0564 1.27 0.0562 1.72 0.0573 1.55
0.15 0.1484 0.93 0.1475 1.33 0.1462 1.39 0.1458 1.91
a
Each value was obtained from five different Tirofiban standards on the same day
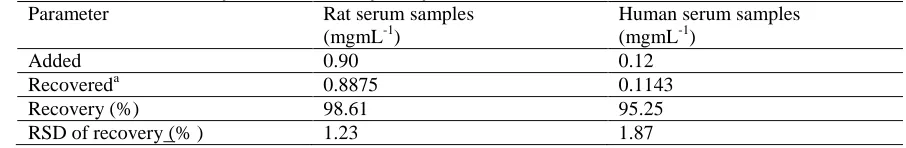
Table 3. Results of the assay and the recovery analysis of Tirofiban
Parameter Rat serum samples
(mgmL-1)
Human serum samples (mgmL-1)
Added 0.90 0.12
Recovereda 0.8875 0.1143
Recovery (%) 98.61 95.25
RSD of recovery (% ) 1.23 1.87
a
Mean value of 5 determinations
REFERENCES
1. Hashemzadeh M, Furukawa M, Goldsberry S, Movahed MR. ExpClinCardiol, 2008; 13(4): 192–197. 2. http://www.accessdata.fda.gov/drugsatfda_docs/label/2012/020912s018,020913s017lbl.pdf
3. Weitz JI. Blood Coagulation and Anticoagulant, Fibrinolytic, and Antiplatelet Drugs. In: Goodman & Gilman's The Pharmacological Basis of Therapeutics, 12thed., New York; The McGraw Hill Co: 2011, pp.849 – 877
4. Kumar A, Herrmann HC. ExpOpin Invest Drugs. 1997; 6:1257-67. 5. The PRISM-PLUS Investigators. N Engl J Med. 1998; 338:1488-97 6. The RESTORE Investigators. Circulation. 1997; 96:1445-53 7. Medicure Pharma. Somerset, NJ; 2007 Nov.
8. Anon. Drugs Future. 1995; 20:897-901.
9. Kondo K, Umemura K. ClinPharmacokinet. 2002; 41(3):187-95
10. Oertel R, Köhler A, Koster A, Kirch W. J Chromatogr B. AnalytTechnol Biomed Life Sci. 2004; 805(1):181-5
11. Bougie DW, Wilker PR, Wuitschick ED, Curtis BR, Malik M, Levine S, Lind EN, Pereira J, Aster RH. Journal of the American Society of Hematology, 2002; 100 (6): 2071-2076.
12. The United States Pharmacopoeia, The USP 24th Ed.; Easton, Rand Mc; Nally: Tounton, MA, 2000. 13. ICH Topic Q 2 (R1) Note for guidance on validation of analytical procedures: Text and methodology
(CPMP/ICH/381/95), London; European Medicines Agency: 1995 14. Ranjitha KS, Rao AL. IJPCBC. 2011; 1 (1): 43-47