Human Journals Vol.:2, Issue:1
Research Article
© All rights are reserved by Saadoon Fahad Dakhil et al.
Experimental & CFD Analysis for the Solar Heat Pump by
Using Phase Change Material
www.ijrm.humanjournals.com
Keywords: free convection, paraffin wax, heat pump, numerical, CFD
ABSTRACT
The hot climate in Basra city requires many research to find a solution to reduce heat. The objective of the study is the possibility of building a heat pump using renewable energy. Present work addresses as a renewable energy heat bump by using paraffin wax during daytime. The experimental and the CFD model of solar collector and thermal energy storage (TES) system based on phase change materials (PCM) as a renewable heat pump system were presented. An experimental rig was constructed to conduct a practical analysis by measuring the intensity of solar radiation at different hours of the daytime. Temperatures distribution were measured with 24 type K thermocouples at different sites for the system. A numerical investigation has carried out to predict flow and heat transfer for the solar heat pump. Free convection of turbulent flow with 2-D unsteady state incompressible flow were examined. The numerical work is divided in two parts: the first part present the development of numerical models of the heating collector room while second is the numerical model of paraffin wax room. ANSYS FLUENT code 16 was applied to solve Navier Stock, energy and k-Ɛ model equations by using finite volume method. The calculations of the velocity, temperatures distribution, and then the Nusselt number values with different Rayleigh number for air at both heat collector room and paraffin wax room at different daytime were reported.The results of the present work great guarantee future development of this technology for the food or agriculture industry. Maximum cooling temperature of the hot air was reached more than 20 oC. It was found that a PCM led to maximum energy savings and greater peak load at high solar intensity value.
Saadoon Fahad Dakhil*, Kifaya Oudah Ibraheem Basra Technical Eng. College
1. INTRODUCTION
In the past years more systems combining solar thermal collectors with heat pumps had been developed and introduced to the market for both domestic hot water and space heating. Usually the thermal pump needs an external energy to ensure its continued operation. Now renewable technologies were considered as clean sources of energy and optimal use of these resource minimize environmental impacts. Also renewable energy products minimum secondary wastes and sustainable based on current and future economic. Clean energy generation becomes more and more crucial day by day due to the growing significance of environmental issues. Renewable energy sources (RES) supply 14% of the total world energy demand. Renewable energy resources will play an important role in the world᾿s future and are also often called alternative sources of classic energy. RES includes biomass, hydropower, geothermal, solar, wind and marine energies. Among the clean energy technologies, solar energy is recognized as one of the most promising choices since it is free and provides clean and environmentally friendly energy[1]. A thermal solar collector is a device which absorbs the incoming solar radiation, converts it into heat, and transfers this heat to fluid (usually air, water, or oil) flowing through the collector. Solar collectors are usually classified into two categories according to concentration ratios: concentrating collectors and concentrating collectors. The non-concentrating has area of absorbing equal to the area exposed to the solar radiation, while in the state of concentrating solar collector has concave and reflexive surface to intercept and focus the beam of sun radiation and give it to a small area of reception[2].
Solar energy is available only during the day, and hence, its application requires an efficient thermal energy storage so that the excess heat collected during sunshine hours may be stored for later use during the night. Because of this limitation, researchers are required to treat this problem. This study aims at finding a solution to substitute for this weakness, that᾿s by using the thermal storage systems for storage of energy during the time of the availability of solar energy.
efficiency. PCMs are latent heat thermal storage materials[4]. Materials that have been studied during the last 40 years are hydrated salts, paraffin waxes, fatty acids and eutectics of organic and non-organic compounds. Depending on the applications, the PCMs should first be selected based on their melting temperature. Materials that melt below 15 ̊ C are used for storing coolness in air conditioning applications, while materials that melt below 15 ̊ C are used for storing coolness in air conditioning, while materials that above 90 ̊ C are used for absorption refrigeration. All other materials that melt between these two temperatures can be applied in solar heating and for heat load leveling applications.
Yuwen Zhang⃰ and Amir Faghri 1995 [5] studied a numerical solution of laminar forced convection heat transfer of a microencapsulated phase change material suspension in a circular tube with constant heat flux. P.Lamberg and K.sire 2003 [6] studied analytical model based on a quasi-linear, transient, thin- fin equation for melting in a semi-infinite PCM storage with an internal fin. Darius Heim 2005 [7] studied a comparative two solution methods of specific and latent heat transfer in building components e.g. walls, ceilings or floors numerically. This study is a contribution to the integration of latent heat storage materials to the integration of latent heat storage materials with in whole building dynamic simulation using two different approaches. A.Carbonari et al .2005 [8] studied numerically and experimental analyses of PCM containing sandwich panels for prefabricated walls. A finite element numerical algorithm used for the simulation of two dimensional problems of heat transfer with phase change is veracious. Four prototypes of PCM containing sandwich panels for prefabricated walls were tested (two of them used validate the numerical finite element method for design purposes) in a test-room capable of simulating several kinds of outdoor and indoor environmental conditions, comparing the numerical results with the experimental ones derived from tests carried out on two different kinds of PCM containing sandwich panels.
combine the benefit of both solar energy as heat source and PCM material as a sustainable heat sink.
2.THEORETICAL ANALYSIS:
This section describes governing equations and numerical solutions by using computational fluid dynamics (CFD). Also description of the turbulence models k-Ɛ and boundary condition which are used in this study.
Theoretical analysis includes two main parts only.
i-Solar collector as the source heating room with inclined finned black wall. All fins are rectangular uniform cross section and fixed at equal interval space.
ii-Paraffin wax room as sink of absorb heat .
For above system heat conduction and free convection were anlaysed into two dimensional at turbulent flow with different solar intensity and daytime.
To solve this problem, the following assumptions are necessary:
(1) Solar intensity fall on the solar collector as constant heat flux at a fixed time.
(2) The thermophysical properties of the PCM, solid and HTF (air) are independent of temperature.
(3) The PCM is homogeneous and isotropic.
(4) The PCM is initially in solid phase at initial temperature low than melting temperature.
(5) The heat transfer in the PCM is controlled only by conduction.
(6) The flow of HTF is two dimensional, incompressible, turbulent flow, no slip and steady state velocities with variable temperature with time only.
(7) The energy dissipation of HTF is negligible.
Now, based on the previous assumption, the system of equations governs the velocity and temperature fields of HTF are written as follows [9]:
Continuity equation
𝜕(𝜌𝑢𝑖)
𝜕𝑥𝑖 = 0 (1)
Momentum equation (2)
𝜕(𝜌𝑢𝑗𝑢𝑖) 𝜕𝑥𝑗 = − 𝜕𝑃 𝜕𝑥𝑖+ 𝜕 𝜕𝑥𝑗[(𝜇 + 𝜇𝑡) 𝜕𝑢𝑖 𝜕𝑥𝑗] Energy equation 2 2 2 2 y T x T c k y T v x T u t
T f f
f f f f f (3)
Also, the suitable and simplified governing energy equation for two dimensional, unsteady state heat transfer in the solid paraffin without heat generation is shown below:
2 2 2 2 y T x T c k t
T s s
s s
s (4)
By solving the governing equations, the discretization equations for the velocity, pressure and temperature fields can be obtained. The governing equations are solved numerically using the finite volume method (Upwind scheme) by explicit difference for time and forward difference [10]. All discretization equations, except energy equations, are solved by using the SIMPLE (Semi-Implicit Method for Pressure–Linked Equations) algorithm method. Numerical model was employed for complete results which solved with help of ANSYS FLUENT code 16.0. From the obtained pressure, velocity and temperature distributions, respectively, one can determine the axial variation of the thermal performance as average Nusselt number.
3.INITIAL &BOUNDARY CONDITIONS:
i -Initial condition: T=Ti at time=0
ii- The solar collector.
Constant heat flux, no slip wall:u=v-0. All fins are insulated tip t> 0 at.
iii- All Inlet and outlet pipes are insulated.
iv-Paraffin room:
Walls are insulated and no slip condition.
Paraffin Top surface is coupling boundary; Fluid-solid interfacesat t>0.
y p T p k y f T f k v u 0
Paraffin bottom surface is coupling boundary; Solid- fluid interfacesat t>0.
y p T p k y f T f k v u 0
THERMO-PHYSICAL PROPERTIES OF TESTED PARAFFIN WAX[10]
Parameters Values
Density [kg/m3] 880 (solid)/760 (liquid)
Specific heat [kJ/kg K] 2.9 (solid)/2.2 (liquid)
Thermal conductivity [W/m K] 0.2
Melting temperature [oC] 51
Latent heat [kJ/kg] 140
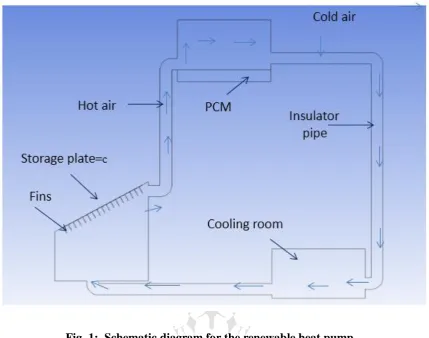
Fig. 1: Schematic diagram for the renewable heat pump.
Figure 1 presents the system diagram with boundary conditions to explain thr air flow direction through the closed system. Heat absorbs through the top surface of the PCM as a sensible heat and rejected to the atmosphere from the bottom surface.
4. EXPERIMENTAL SETUP:
At (150) cm bottom side the third cooling room is placed and the closed circuit system is constructed.
24 K thermocouples are fixed at different positions of the system: nine is fixed a collector room, 9 at paraffin room and others at inlet and outlet ports of each pipe. All thermocouples are controlled by H112 heat transfer service unit as a selector for reading temperature. A pyranometer is used to measure total hemispherical radiation- beam plus diffuse- on a horizontal and inclined surfaces. This a type of actionometer is used for measuring solar irradiance and the solar radiation flux density (w/m2) from the hemisphere above within a
wavelength range o.3 μm to 3μm.
1-Storage plate. 2-Thermocouple "K".3-sollar collector.4-pipe . 5-H112 .Heat transfer service unite (HTSU). 6-Paraffin room . 7-Insulation. 8-Cooling room.
Fig 2: Photograph view of solar heat pump with PCM.
1
2
3
5
4
6
5. RESULTS & DISCUSSION:
This section presents the results obtained from the theoretical and experimental analysis. The first part of the analysis was a convergence study for the proposed numerical code. The second part present is the experimentally results from the measured data. Then the final is the comparison between numerical and experimental results.
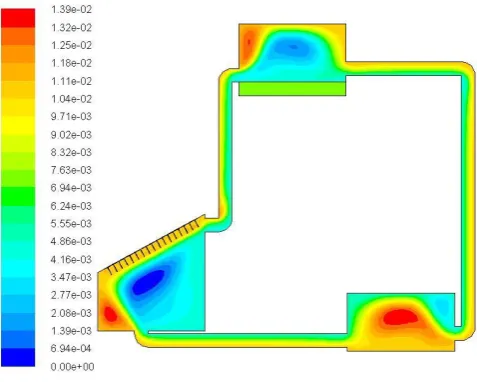
I-Theoretical results: Figure. 3 presents the numerical results of the air stream function through the heat pump system at Ra=15x1011.The effect of free convection is clearly appeared along the system. The variation of stream function means that there is a change in power between the intensity of radiation as a source of heat absorbed by PCM. Also figure 4 shows the same conture but for velocity magnitude of air inside heat pump. Maximum velocity is reached about 0.17 m/s through the inlet port of the paraffin room due the difference in cross area, where the pipe dia is 10 cm.
Figure 4: Conture of velocity magnitude for system during 21 May 2018 Ra=15x1011
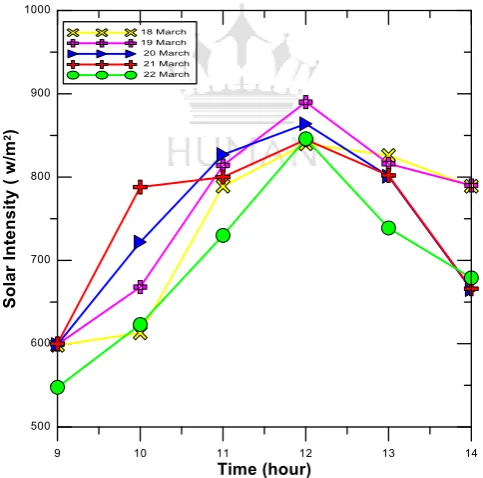
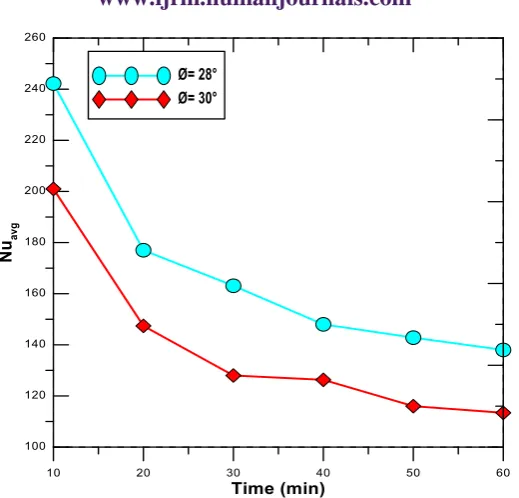
Figure .5 shows the thermal numerical results for the inclined finned wall collector with time. Results present temperature distribution along the wall through one hour with 10 min time step. Highest values for temperature are recorded at time 12.0 AM. Theoretical prediction for solar intensity with different day in March 2018 at the climate of Basra city is presented at figure 6. In all days the highest solar intensity recorded at 12 hours, and maximum value at BASRAH during March reached to 900 w/m2. From the energy equation and the numerical solution the average Nusselt number of the fluid is presented at figure 7 with different inclination angle of the collector wall. At constant heat flux, high Nusselt number means low temperature difference. So at angle Ø =30º.low value of Nuavg than angle 28º.At initial value maximum
Nuavg is occurred then decreased at the end time. This result is agree with the climate of Basra
Figure 5: Variation of theoretical temperature along the collector wall with time at Ø=30º and Ra=14*𝟏𝟎𝟏𝟏, (15 March 11.0→12.0 AM).
Figure 7: Theoretical average nusselt number of air inside Solar collector with different collector inclination angle (15 May 11.0→12.0 AM)
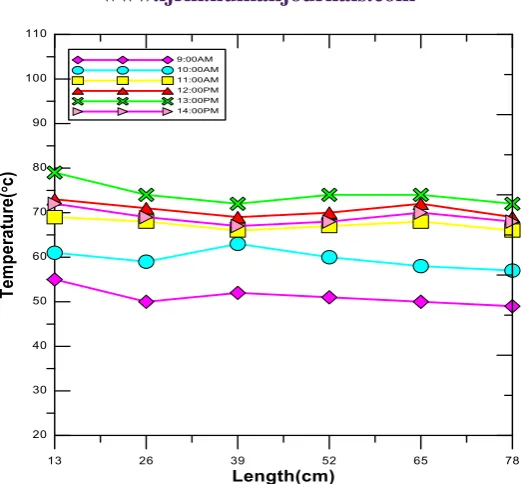
ii-Experimental results: The experimental results include the both solar intensity and local temperature reading and then calculate the fluid average Nusselt Number. Figure 8 presents the actual average solar intensity value at march and May mounths with different times respectively. High solar intensity was recorded at May 2018 and maximum value at time 12.0 hour with collector angle Ø=30º. Experimentally the temperature distribution is recorded along the collector wall at Ø=30º and Ra=14*1011.with different time along one hour. High level of
the temperatures were indicated at hour 13.0 PM as shown in figure 9.
Figure 9: Variation experimental temperatures along the collector plate at Ø=30º and Ra=14*𝟏𝟎𝟏𝟏 (15 March).
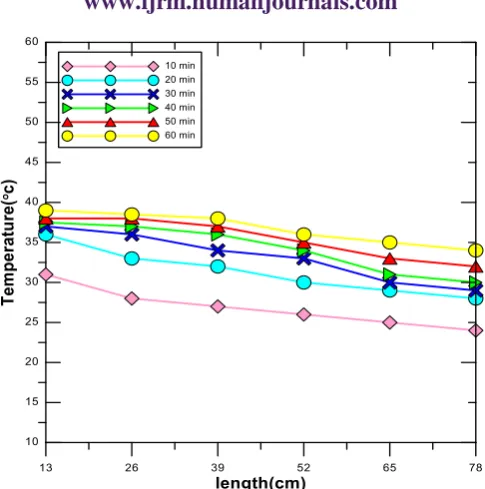
Thermal analysis for the paraffin room is examined experimentally as explained in figure 10 at 10 Min interval time. Temperatures distribution along the Paraffin wall at Ø=30º, melting point 53ºC and Ra=14*1011are recorded. For all times the paraffin wall temperature is decreased with increased length due to the heat transfer between hot air and solid paraffin. Also the sensible storage heat is absorbed by the temperature gradient and wall temperature increased with increased time. Figure .11 shows the variation of the Nuavg of the fluid near
Figure10: Variation of experimental temperature along the Paraffin wall at Ø=30º and Ra=14*𝟏𝟎𝟏𝟏 (15 March 11→12 AM).
Figure 11: Experimental average nusselt variation with time into the Paraffin room at Ø=30º, 15March
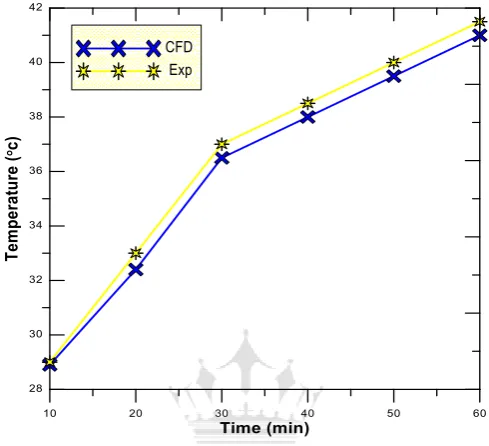
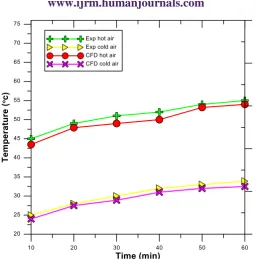
wall explain at figure 13 during months March and May respectively. Also the average wall temperature is increased with time as explained at figure 7. The comparison show good agreement at all times.Finally the important result is presented at figure 14.Results show good performance for the heat pump by using PCM together with solar energy. The difference between the exit hot air from the collector and the exit the cold air from the cooling room more than 20 ºC at the climate of Basra city. Also good agreement between CFD and experimental results.
Figure 12: Comparison of the Paraffin wall temperature at Ø =30º, and 15 May (11→12 AM)
Figure 14: Comparison for hot air exit and cold air exit temperature at March, Ø=30º, 11.0→12.0AM .
6.CONCLUSION:
NOMENCLATURE
ρ Density k Turbulent energy.
β Thermal expansion Ɛ Turbulent dissipation energy.
Tm Melting temperature u,v Average Fluid velocity.
Tp PCM temperature Ø Collector inclination angle.
Tf fluid temperature. CFD Computation fluid dynamics
PCM Phase change material. C Specific heat
Ts Solid temperature k Thermal conductivity
g Gravity μt Turbulent dynamic viscosity
t Time Exp Experiment
P Phase change f Fluid
REFERENCES:
[1] Amos Veremachi, Boaventura Chongo Cuamba , Azher Zia,Jorgen Lovseth, Ole Jorgen Nydal.PCM Heat Storage Charged with a Double-Reflector Solar System. Journal of Solar Energy. Hindawi Publishing Corporation. 2016, Article ID 9075349.,
[2] Paris A. Fokaides ,Angeliki Kylili , Soteris A. Kalogirou. Phase change materials (PCMs) integrated into transparent building elements: a review" Mater Renew Sustain Energy (2015) 4:6 DOI 10.1007/s40243-015-0047-8.
[3] Lippong Tan, Yuenting Kwok, Ahbijit Date , Aliakbar Akbarzadeh.Numerical Study of Natural Convection Effects in Latent Heat Storage using Aluminum Fins and Spiral Fillers. World Academy of Science, Engineering and Technology
International Journal of Mechanical and Mechatronics Engineering Vol:6, No:8, 2012.pp.1438-1445.
Brousseau P , Lacroix M. .Study of the thermal performance of a multi-layer PCM storage unit”, Journal of Energy Conservation and Management. (1996).Vol. 37, No. 5, pp. 599-609.
[5] Yuwen Zhang,Amir Faghri. Analysis of forced convection heat transfer in microencapsulated phase change material suspensioons. Transport Phenomena in Multiphase Systems 1st Edition. (1995).vol . 9,No.4
[6] P.Lamberg, K.Sire n.Analytical model for melting in a semi-infinite PCM storage with an internal fin.Heat and Mass Transfer 39 (2003),pp.167-176.
[7] Darius Heim. Two solution method of heat transfer with phase change within whole building dynamic simulation.( 2005).
[8] A.Carbonari a, M.De Grassi a, C. Di Perna b, P. Principi.Numerical and experimental analyses of PCM containing sandwich panels for prefabricated walls.2005.